Advanced PCR Trading# **Advanced PCR Trading**
**Put-Call Ratio (PCR)** helps traders analyze market sentiment by comparing put and call option volumes. Advanced PCR analysis enhances **trend prediction and risk management**.
## **1️⃣ Deep PCR Analysis**
✅ **OI-Based PCR:** High **Put OI** at support → Bullish, high **Call OI** at resistance → Bearish.
✅ **PCR Trend Shift:** Sudden spikes indicate **trend reversals or strong momentum**.
✅ **Strike-Wise PCR Analysis:** Identifies **key support & resistance levels** for option trading.
## **2️⃣ Trading Strategies Using PCR**
✅ **Extreme PCR Levels:**
🔹 **PCR > 1.5:** Overloaded with puts → **Potential short covering rally**.
🔹 **PCR < 0.5:** Too many calls → **Risk of market correction**.
✅ **PCR & Price Action:** Combine with **support-resistance and volume analysis** for confirmation.
### **Conclusion**
Advanced PCR trading helps in **trend confirmation, identifying reversals, and managing risk**, making it a valuable tool for options traders. 🚀
Cryptomarket

overview of financial markets# **Overview of Financial Markets**
Financial markets are platforms where assets like **stocks, bonds, currencies, and commodities** are traded, ensuring liquidity and economic growth.
## **1️⃣ Types of Financial Markets**
✅ **Stock Market:** Buying & selling shares (e.g., NSE, BSE).
✅ **Bond Market:** Governments & corporations raise funds via debt securities.
✅ **Forex Market:** Global currency trading with high liquidity.
✅ **Commodities Market:** Trading in gold, oil, and agricultural products.
✅ **Derivatives Market:** Futures & options contracts based on underlying assets.
## **2️⃣ Key Functions**
✅ **Liquidity:** Ensures smooth asset transactions.
✅ **Price Discovery:** Reflects demand-supply dynamics.
✅ **Risk Management:** Hedging through derivatives.
### **Conclusion**
Financial markets provide **investment opportunities, capital growth, and risk management**, making them vital to the economy. 🚀

technical analysis class 1| Technical Analysis – Class 1**
### **Introduction to Technical Analysis**
Technical analysis is a method of evaluating financial markets by analyzing price movements, chart patterns, and indicators. Unlike fundamental analysis, which focuses on company financials, technical analysis is based purely on market data.
### **Core Principles of Technical Analysis**
1. **Price Discounts Everything** – Market prices reflect all available information, including fundamentals, news, and investor sentiment.
2. **Price Moves in Trends** – Trends can be classified as uptrend, downtrend, or sideways. Identifying trends helps traders make better decisions.
3. **History Repeats Itself** – Market patterns tend to repeat due to human psychology and behavioral tendencies.
### **Key Components of Technical Analysis**
1. **Price Charts** – The foundation of technical analysis, charts visualize price movements. Common types include:
- **Line Chart** – Simplest form, showing closing prices.
- **Bar Chart** – Displays open, high, low, and close (OHLC).
- **Candlestick Chart** – Most popular, showing price action in a more visual manner.
2. **Support & Resistance Levels** –
- **Support:** A price level where buying interest is strong enough to prevent further decline.
- **Resistance:** A price level where selling pressure prevents further rise.
3. **Trend Analysis** –
- **Uptrend:** Higher highs and higher lows.
- **Downtrend:** Lower highs and lower lows.
- **Sideways Trend:** Price moves within a range.
4. **Volume Analysis** – Confirms price trends. Increasing volume in an uptrend suggests strong momentum, while declining volume may indicate weakness.
### **Conclusion**
Technical analysis provides traders with tools to analyze price trends and make informed decisions. Mastering support, resistance, trend identification, and volume analysis is key to successful trading.
Would you like a more detailed breakdown or any specific topics in Class 2? 🚀📈

Ethereum 1D/1W Technical Price Commentary - Ethereum is currently trading at 1949$
- Ethereum has erased 53% from its recent swing high so far (4097$-1947$)
- Ethereum has been correcting and underperforming for more than a quarter now whereas in Q1 2025 Ethereum has lost half of its value
- ETH/BTC still has not bottomed out and we are still left with more downside technically. The path from 0.23-0.016 looks easy and can easily mitigate this level post that I will re-evaluate new levels.
- Ethereum is below the Point of interest deviating many important levels, unless you see a consolidation making higher high on a 4H Timeframe there's actually no point in longing Ethereum or adding it in SPOT.
- Next observation, the path that I have drawn clearly shows the next path for ETH, where I anticipate ETH to easily revisit 1521$. If that place has buyers interest it will be a quick liquidity grab and a strong bounceback for ETH or else we might start consolidating.

SOLVUSDT - RETEST OF RESISTANCE IN A BEARISH TRENDSymbol - SOLVUSDT
CMP - 0.0430
SOLVUSDT is currently consolidating within a neutral range, which has emerged amid an ongoing downtrend. The cryptocurrency market has swiftly retreated following the news from Sunday. Bitcoin has re-entered the selling zone, falling below the 90K level. A continued decline in Bitcoin could exert downward pressure on the broader market.
SOLV is forming a range between 0.044 and 0.0292, with the price showing signs of strengthening toward the key liquidity and interest zones. Given the prevailing market conditions - including the downtrend, a weak market sentiment, the lack of a strong catalyst, and Bitcoin's decline - it is reasonable to assume that the coin has limited potential for further upward movement. The current price action may result in a false breakout of resistance, followed by a decline.
Resistance levels: 0.0436, 0.0439, 0.0494
Support levels: 0.0369, 0.0345
Considering the daily ATR from the session's open, it is expected that the volatility will be exhausted by the time resistance is reached, leaving little room for a breakout. There is a high probability of a price retracement from the 0.0436-0.0439 range, with the price likely to fall towards the key support zones below.

what is support and resistance ?# **What is Support and Resistance?**
**Support and Resistance** are key price levels where buying or selling pressure is strong, influencing price movement.
## **1️⃣ Understanding Support & Resistance**
✅ **Support:** A price level where demand is strong, preventing further decline.
✅ **Resistance:** A price level where supply is strong, preventing further rise.
## **2️⃣ How to Use Them in Trading**
✅ **Breakout Trading:** Price breaking resistance → **Buy**, breaking support → **Sell**.
✅ **Reversal Trading:** Price bouncing off support → **Buy**, rejecting resistance → **Sell**.
✅ **Multiple Tests Strengthen Levels:** The more a level is tested, the stronger it becomes.
### **Conclusion**
Support and Resistance help traders **identify entry-exit points, stop-loss levels, and trend reversals**, making them crucial for market analysis. 🚀

what is MACD trading ?# **What is MACD Trading?**
MACD (**Moving Average Convergence Divergence**) is a trend-following momentum indicator used to identify **trend direction, strength, and potential reversals**.
## **1️⃣ Key MACD Components**
✅ **MACD Line:** Difference between the **12-day & 26-day EMA**.
✅ **Signal Line:** **9-day EMA** of the MACD line (triggers buy/sell signals).
✅ **Histogram:** Measures distance between MACD & Signal Line (momentum strength).
## **2️⃣ How to Trade with MACD**
✅ **MACD Crossover:**
🔹 **Bullish:** MACD crosses above Signal Line → **Buy signal**.
🔹 **Bearish:** MACD crosses below Signal Line → **Sell signal**.
✅ **MACD Divergence:**
🔹 **Bullish:** Price makes **lower lows**, MACD makes **higher lows** → **Uptrend reversal**.
🔹 **Bearish:** Price makes **higher highs**, MACD makes **lower highs** → **Downtrend reversal**.
### **Conclusion**
MACD is a **powerful tool for trend confirmation and momentum analysis**. Using it with **support-resistance and volume** increases trade accuracy. 🚀

What is Rsi and how to use it ?# **What is RSI and How to Use It?**
The **Relative Strength Index (RSI)** is a momentum indicator that measures **overbought and oversold conditions**, helping traders identify trend strength and potential reversals.
## **1️⃣ RSI Levels & Interpretation**
✅ **Above 70:** Overbought zone → Possible **trend reversal or correction**.
✅ **Below 30:** Oversold zone → Possible **trend bounce or reversal**.
✅ **50 Level:** Midpoint indicating **trend strength** (above 50 = bullish, below 50 = bearish).
## **2️⃣ How to Use RSI in Trading**
✅ **Overbought & Oversold Trading:** Look for reversals near **70 or 30**.
✅ **Divergence Trading:**
🔹 **Bullish Divergence:** Price makes lower lows, RSI makes higher lows → **Buy signal**.
🔹 **Bearish Divergence:** Price makes higher highs, RSI makes lower highs → **Sell signal**.
✅ **RSI Trend Confirmation:** Use with **support, resistance, and moving averages**.
### **Conclusion**
RSI helps traders **spot trend reversals, confirm momentum, and optimize trade entries**, making it a valuable tool for market analysis. 🚀

stock market class 1# **Stock Market – Class 1**
The **stock market** is where investors buy and sell shares of publicly traded companies. It plays a key role in **wealth creation, capital raising, and economic growth**.
## **1️⃣ Key Components**
✅ **Stock Exchanges:** Platforms like **NSE, BSE** facilitate trading.
✅ **Indices:** **Nifty 50, Sensex** track market performance.
✅ **Market Participants:** Retail & institutional investors, FIIs, DIIs.
## **2️⃣ How the Stock Market Works**
✅ **Primary Market:** Companies issue IPOs to raise funds.
✅ **Secondary Market:** Investors trade stocks based on demand & supply.
✅ **Bull & Bear Markets:** Rising vs. falling trends.
### **Conclusion**
Understanding the **basics of stock trading, market structure, and investor behavior** is essential for making informed decisions. 🚀

Advanced option chain pcr# **Advanced Option Chain PCR (Put-Call Ratio)**
The **Put-Call Ratio (PCR)** helps traders gauge market sentiment by comparing put option volume to call option volume. A deeper understanding of **PCR levels, open interest, and trends** can enhance options trading strategies.
## **1️⃣ Key PCR Interpretations**
✅ **PCR > 1:** More puts than calls → **Bearish sentiment** (fear in the market).
✅ **PCR < 1:** More calls than puts → **Bullish sentiment** (optimism in the market).
✅ **Neutral PCR (~0.9-1.1):** Balanced market, indicating consolidation.
## **2️⃣ Advanced PCR Analysis**
✅ **OI-Based PCR:** Analyzing **PCR with Open Interest (OI)** helps confirm **trend strength**.
✅ **PCR Trend Shift:** A sudden drop or rise in PCR indicates **potential reversals**.
✅ **Strike-Wise PCR Analysis:** Helps identify **strong support & resistance levels**.
### **Conclusion**
Advanced PCR analysis, combined with **OI, volume, and price action**, provides deeper insights into market sentiment and helps traders make informed decisions. 🚀

overview of financial markets# **Overview of Financial Markets**
Financial markets facilitate the trading of **stocks, bonds, currencies, and commodities**, ensuring capital flow and economic stability.
## **1️⃣ Major Financial Markets**
✅ **Stock Market:** Equity trading (e.g., NSE, BSE).
✅ **Bond Market:** Debt securities for fundraising.
✅ **Forex Market:** Global currency exchange.
✅ **Commodities Market:** Trading in gold, oil, and agricultural products.
✅ **Derivatives Market:** Futures & options contracts based on underlying assets.
## **2️⃣ Key Functions**
✅ **Liquidity:** Ensures easy asset transactions.
✅ **Price Discovery:** Reflects supply and demand.
✅ **Risk Management:** Hedging through derivatives.
### **Conclusion**
Financial markets are essential for **investment, capital formation, and economic growth**, offering various opportunities for traders and investors. 🚀

HYPE Trade Setup: Major Support Retest HYPE has seen a massive drop in the past few days and is now sitting at a critical support level. If buyers step in, we could see a strong bounce toward the next resistance zones.
🛠 Trade Details:
Entry: Around $14.3
Take Profit Targets:
$18.00 (First TP - Resistance Zone)
$20.00 (Second TP - Potential Breakout Level)
Stop Loss: Below $12.00
This setup offers a solid risk-to-reward opportunity if HYPE holds its support. Watch for volume confirmation before entering! 🚀

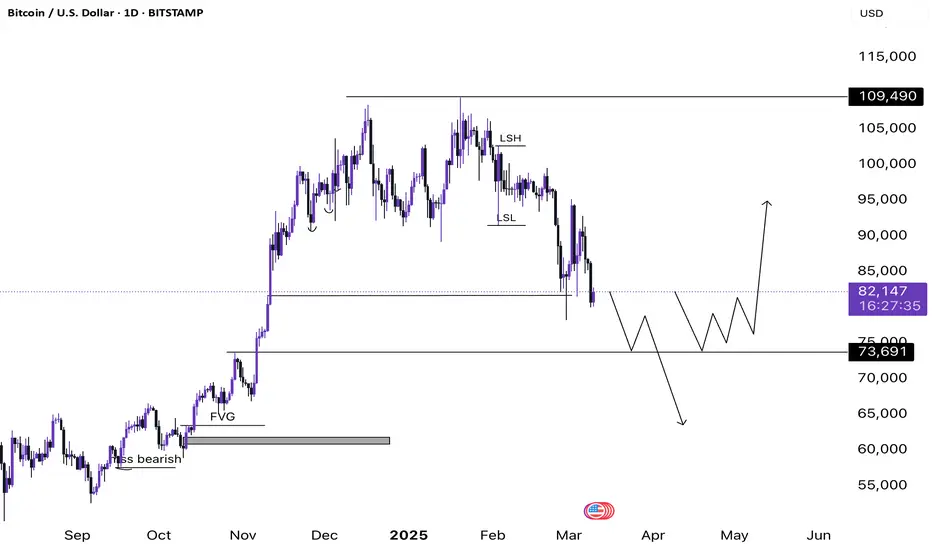
Bitcoin 1D Bear Market Technical Analysis - Bitcoin is currently trading at 82,249$
- Bitcoin has so far erased 24.98% from its All Time Highs and especially after Trump's presidency.
- Market Structure shift looks completely bearish, unless we flip above 96,000$ on a daily timeframe
- We have many inefficiencies left until 73,691$ and I have drawn those paths as well.
- The first path shows price filling the inefficiency and then taking out more liquidity to fall further and clear the fair value gap sitting at about 63,329$
- The second path shows we might not not fall below 73k after filling the inefficiency rather we start building a base before moving towards the upside.
- Market doesn't look good from a structure perspective be very selective when it comes to punching trades.
MACD trading with histogram# **MACD Trading with Histogram**
The **MACD Histogram** helps traders visualize **momentum strength and trend shifts** by measuring the gap between the MACD Line and Signal Line.
## **1️⃣ Understanding the Histogram**
✅ **Positive Histogram:** Bars above zero → **Bullish momentum** (MACD above Signal Line).
✅ **Negative Histogram:** Bars below zero → **Bearish momentum** (MACD below Signal Line).
✅ **Expanding Bars:** Strengthening trend.
✅ **Shrinking Bars:** Weakening trend → **Possible reversal**.
## **2️⃣ Trading Strategies**
✅ **Histogram Crossover:**
🔹 **Bullish:** Histogram moves from negative to positive → Buy.
🔹 **Bearish:** Histogram moves from positive to negative → Sell.
✅ **Histogram Divergence:**
🔹 **Bullish Divergence:** Price makes lower lows, histogram forms higher lows → **Uptrend reversal**.
🔹 **Bearish Divergence:** Price makes higher highs, histogram forms lower highs → **Downtrend reversal**.
### **Conclusion**
Using the **MACD Histogram** with **trendlines and support-resistance levels** improves trade accuracy and **helps identify momentum shifts early**. 🚀

macd trading# **MACD Trading Strategy**
MACD (**Moving Average Convergence Divergence**) is a momentum indicator used to identify **trend strength, reversals, and entry-exit points**.
## **1️⃣ Key Components**
✅ **MACD Line:** Difference between the 12-day and 26-day EMA.
✅ **Signal Line:** 9-day EMA of the MACD line (triggers buy/sell signals).
✅ **Histogram:** Shows the gap between MACD and Signal Line (momentum strength).
## **2️⃣ Trading Strategies**
✅ **MACD Crossover:**
🔹 **Bullish:** MACD crosses above the Signal Line → Buy.
🔹 **Bearish:** MACD crosses below the Signal Line → Sell.
✅ **MACD Divergence:**
🔹 **Bullish Divergence:** Price makes lower lows, MACD makes higher lows → Uptrend reversal.
🔹 **Bearish Divergence:** Price makes higher highs, MACD makes lower highs → Downtrend reversal.
### **Conclusion**
MACD is a reliable tool for **trend confirmation and momentum analysis**. Combining it with **support-resistance and volume** enhances trade accuracy. 🚀

database trading part 2#Database Trading
Database trading enhances decision-making by using **historical data, AI models, and statistical patterns** for trade execution.
## **1️⃣ Advanced Data Utilization**
✅ **Backtesting Strategies:** Evaluates trade performance on past data.
✅ **AI & Machine Learning:** Predicts market movements using data-driven models.
✅ **Pattern Recognition:** Identifies high-probability trade setups.
## **2️⃣ Optimizing Trade Execution**
✅ **Real-Time Data Processing:** Helps in **scalping, swing, and intraday trading**.
✅ **Automated Strategies:** Reduces emotional bias and improves consistency.
✅ **Risk Management:** Data-driven stop-loss & take-profit levels for better control.
### **Conclusion**
Database trading enhances accuracy by using **quantitative models and real-time data**, making it a powerful tool for modern traders. 🚀

overview of financial markets# Overview of Financial Markets
Financial markets facilitate the trading of stocks, bonds, currencies, and commodities, enabling capital flow and economic growth.
## 1️⃣ Types of Financial Markets
✅ **Stock Market:** Companies issue shares; investors trade equity (e.g., NSE, BSE).
✅ **Bond Market:** Governments & corporations raise funds by issuing debt securities.
✅ **Forex Market:** Global exchange of currencies with high liquidity.
✅ **Commodities Market:** Trading of gold, oil, and agricultural products.
✅ **Derivatives Market:** Futures & options contracts based on underlying assets.
### Conclusion
Financial markets provide investment opportunities, liquidity, and price discovery, playing a vital role in the global economy. 🚀

Advanced Option Trading With Professionals The 3 5 7 rule is a risk management strategy in trading that emphasizes limiting risk on each individual trade to 3% of the trading capital, keeping overall exposure to 5% across all trades, and ensuring that winning trades yield at least 7% more profit than losing trades.
Why do 90% option traders lose money?
This is because option traders often find themselves directionless, making it difficult to predict market movements accurately. The complex nature of options, combined with the high volatility, leads to significant losses for most traders. It's time to stop option trading.

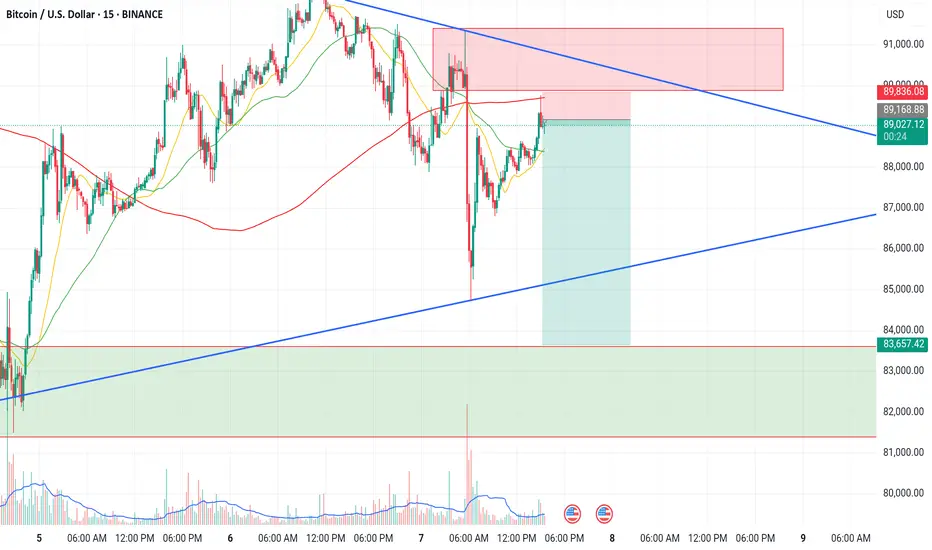
Very good shorting opportunity in BTC. Trade setup explainedBtc is getting rejection from 1hour supply zone. We can short btc with sl of 89840. We can target level of 83650. Risk reward ratio of the trade is very good i.e 1:8. Below at 83000 levels We have a demand zone which will be our target for the trade.
Bitcoin Mini Future Bearish Price ActionAfter the accelerated fall post breakdown of horizontal channel, the price dropped to fill the gap and bounced back.
The bounce took price back into the horizontal channel but the price slid out of it.
Then price dropped towards the gap and bouncing just above it.
The price tried to enter the horizontal channel but took resistance, further confirming bearish price action.
As it remains outside the channel, it seems bearish.

Global Health Ltd (MEDANTA) Stock AnalysisGlobalTradeHub | Global Health Ltd (MEDANTA) Stock Analysis
Fundamental Analysis:
Global Health Ltd, operating under the Medanta brand, is a leading hospital chain in India. Strong revenue growth is driven by increasing healthcare demand, expansion plans, and high patient footfall. Risks include regulatory changes and rising operational costs.
Technical Analysis:
The stock is facing resistance near ₹880. A breakout could push it toward ₹920. Strong support is at ₹820, with further downside risk if breached. RSI around 60 suggests bullish momentum but nearing overbought levels.
Key Levels:
- Resistance: ₹880 / ₹920
- Support: ₹820 / ₹780
Conclusion:
Global Health has solid fundamentals and sector growth potential. A breakout above ₹880 could drive further upside, while dips to support zones may offer buying opportunities. 🏥📈

Bajaj Finance Ltd (BAJFINANCE) Stock AnalysisGlobalTradeHub | Bajaj Finance Ltd (BAJFINANCE) Stock Analysis
Fundamental Analysis:
Bajaj Finance, a leading NBFC, benefits from strong loan growth, digital transformation, and a diversified portfolio across consumer and SME lending. Consistent profitability and low NPAs make it a strong player. Risks include rising interest rates and economic slowdowns affecting credit demand.
Technical Analysis:
The stock is facing resistance near ₹7,250. A breakout could push it toward ₹7,500. Strong support is at ₹6,900, and a breakdown may lead to ₹6,600. RSI around 62 suggests bullish momentum but nearing overbought territory.
Key Levels:
- Resistance: ₹7,250 / ₹7,500
- Support: ₹6,900 / ₹6,600
Conclusion:
Bajaj Finance remains fundamentally strong. A breakout above ₹7,250 could trigger further upside, while dips to support zones offer buying opportunities. 💰📈

Sportking India Ltd (SPORTKING) Stock AnalysisGlobalTradeHub | Sportking India Ltd (SPORTKING) Stock Analysis
Fundamental Analysis:
Sportking India, a leading textile manufacturer, benefits from rising demand for yarn exports and domestic apparel consumption. Strong operational efficiency and expansion plans support growth. However, risks include raw material price volatility and global economic slowdowns impacting textile exports.
Technical Analysis:
The stock is testing resistance near ₹1,150. A breakout could push it toward ₹1,250. Strong support lies at ₹1,050, with further downside risk if breached. RSI around 60 indicates moderate bullish momentum.
Key Levels:
- Resistance: ₹1,150 / ₹1,250
- Support: ₹1,050 / ₹980
Conclusion:
Sportking India remains strong in the textile sector. A breakout above ₹1,150 could drive further gains, while dips to support zones may offer accumulation opportunities. 🏭📈
