Lecture For Option Trader or Intraday TraderIntraday trading, also known as day trading, means buying and selling stocks on the same day to profit from price changes. Traders need to close their trades before the market closes. If not, the broker might automatically close them or turn them into regular trades.
Yes, profits from intraday trading are considered business income and taxed according to your income tax slab. How is intraday trading taxed? Intraday trading profits are treated as short-term capital gains, added to taxable income, and taxed based on applicable slab rates.
Cryptomarket

Advanced Option Trading with Professionals Let's review each part of the professional trader's mind to understand where you want to be, ideally as you develop as an online trader.
Discipline and Consistency. ...
Emotional Control. ...
Continuous Learning. ...
Fundamental Analysis. ...
Technical Analysis. ...
Sentiment Analysis. ...
Goal Setting. ...
Risk Management.
When options are better. Options can be a better choice when you want to limit risk to a certain amount. Options can allow you to earn a stock-like return while investing less money, so they can be a way to limit your risk within certain bounds. Options can be a useful strategy when you're an advanced investor.

BTC @ 99+ K Buying is visibleconsidering the last low and high then now price around 99+ K is between FIB buying levels of 50 and 61.8 levels where price seems to be holding for now which indicating some buying has been done. If price rise from here then it becomes wave 3 and price could easily move above 108K and making new ATH. one may consult your adviser or take your own decision for buying long positions in BTC at and below 99K. Below 100K is sure buying and no panic to sell considering all US and EU activities going on around crypto and BTC.

Option chainOptions chain can be defined as the listing of all option contracts. It comes with two different sections: call and put. A call option means a contract that gives you the right but does not give you the obligation to buy an underlying asset at a particular price and within the option's expiration date.
Nifty option chain is considered to be the best advance warning system of sharp moves or break outs in the index.

Database and Option TradingOptions data captures information on options contracts, including pricing and trading volumes, useful for investment strategies. Discover our guide and top options data providers.
Simply put, when Open Interest increases, it means more money is moving into the futures contract, and when open interest drops, it means money is moving out of the contract. One can draw inference from this example.

BITCOIN EYES ON A BULLISH BREAKOUT (READ_CAPTION) !!💹 #BTCUSDT Analysis
📈 Bitcoin is showing signs of a bullish continuation pattern and is heading towards its support trendline. 🟢 If the price holds strong at this level, we could see price growth and a potential upward breakout. 🚀
🔥 Key Level: Support Trendline
🛑 Watch closely for confirmation before entering the market. Patience is key! 🧘♂️
Let’s see if Bitcoin is ready to take off! 🌟📊

BTCUSD updated viewA resistance zone was created on BTCUSD at the 99113 - 99944 level.
Also at the same level from top to bottom one resistance trend line shows strong resistance in that area. while looking at the HNS pattern in RSI on a closing basis and both the resistance zone and trendline we need a strong closing above the zone with the trendline breaking, then we can see the bigger target in BTCUSD.
otherwise, BTCUSD will take the resistance from the trendline and zone and can see the support level again.
I already shared what-if support level breaks.

ETH - To go above 41K !!!we can see ETH taking support near the green path area shown in chart. But Red line is current resistance line. Breakout of Red line could take price above 41K !!! Till then price could dance between red and green lines shown in chart, one may buy and go long now for quick returns since all crypto could spike or already moving up due to new crypto US President. And ETH is also expected to move up after the bull run ends in Bitcoin. so its good buy right now in ETH

Bitcoin 1D Commentary and Bull Run Technical Analysis - Bitcoin is currently trading at 99,779$
- Bitcoin kept behaving choppy and the Price Behaviour was very sluggish in January
- We saw BTC printing a candle 4000$, which helped BTC cross 100,000$ after a long time.
- Coming back to the current Price Action of BTC we are currently trading at a crucial zone and if we flip a weekly candle close above 102,686$ then the Market structure will change to Bullish
- However, if we do not close above 102,000$ then we can see BTC revisiting 85,000-90,000$
- Trump's inaugural is due next week and will bring in a lot of volatility.
- I am leaning more on the Bullish side, however, if we don't see supporting Macros then we might have a rough time chopping out and getting distributed the whole month.

Pump Up your portfolio with $PUNDIX🚀 Pump Up Your Portfolio with BINANCE:PUNDIXUSDT !
If you've got the guts to bet on this exciting meme coin, here's your chance to shine! Allocate just 5% to 10% of your capital - it's the perfect spot to start. With BINANCE:PUNDIXUSDT at a very promising point and the market conditions looking favorable, now's the time to make your move.
Let's grow together!
🚨DYOR 🚨SL must, it depend's on your risk appetite

Prepare to BUY Spot SANDUSDT (W Cycle)🚀 Prepare to BUY Spot SANDUSDT (W Cycle)
🌟 SANDUSDT is entering a new W cycle – A fantastic opportunity for mid-term gains! 🌟
🌍 Market Overview:
SANDUSDT is showing strong bullish potential on the W timeframe. This provides a strategic entry to benefit from the upward momentum in the market.
📊 Trade Plan:
📌 Entry Point:
Around $0.48 - $0.57 – Ideal accumulation zone.
With Indicator: Confirm entry with your setup to maximize precision.
🎯 Target:
From 1.5x to 5x – Depending on market performance and exit timing.
⏳ Hold Time:
4–8 weeks – Aligned with the expected W cycle trend.
💡 Note:
Combine the suggested price range with your trusted indicator to ensure an optimal entry point. Be prepared to adjust your strategy as market conditions evolve.
🔥 SANDUSDT is on the rise – Don’t miss this exceptional mid-term trading opportunity! 🔥

bearish goat Please do your own research and/or contact your financial advisor before taking any trading opportunities
** We will not be responsible for your profit or loss
*** We are NOT REGISTERED

Bitcoin's Range Game: Stuck Between 90K and 100KThere's a clear resistance level at $100,000 (red horizontal line)
Three recent rejections from the $100K level (marked with red circles)
We have a support zone around $90-92K (marked in green)
The market has been making higher lows since November, indicating an overall bullish trend.
Recent price action shows formation of liquidity pools above $100K
Multiple attempts to break $100K suggest accumulation at these levels
The quick rejections from $100K could indicate stop-loss hunting by larger players
Volume profile (shown at bottom) indicates decreased volume during recent moves
Short-term (1-2 weeks):
Likely consolidation between :92 K-100K range
$100K remains a significant psychological resistance
Watch for false breakouts above $100K which could trap retail buyers
Mid-term (1-3 months):
Bullish bias as long as $90K support holds
Potential for a decisive break above $100K after sufficient accumulation
Key to watch institutional flow and spot market demand
Long-term (6+ months):
Overall structure remains bullish with higher lows
$100K level likely to be broken after sufficient consolidation
Major support zone at $90-92K needs to hold for continued uptrend
Key levels to watch:
Major resistance: $100,000
Current support: $92,000
Critical support: $90,000

TARS ready for STARSTARS Looking great on 4HR TF. Potential to rocket over 55%. Self-explanatory chart!!
Please Note: This is not a Buy/Sell Recommendation. DYOR Always!

Bitcoin will reach at $78K BTCUSD is looking for short opportunity aft making 100K will expect a short term correction to make a movement to the downside

BTC Update as on Jan 02, 2025BTC Swing Trade View :
As per the current price action Support Area around 91800-95000. This is where the price has found some stability after the recent pullback. It's a level where buyers have stepped in to prevent further price drops.
from the current market sentiments and from the time cycle perspective I am considering the following moves :
High Probability: This is what I am expecting ,Given the current trend, price is going to re test the recent ATH and can create new ATH if price able to form base at the marked support area after confirmation.
Mid Probability: This is a less certain move but still within a reasonable expectation for price movement in case price failed to hold the support area.
Low Probability: This move indicates areas where the price is less likely to go based on current trends, which seems to be below the support area.
Areas with darker shades on volume profile (purple) is where a lot of trading activity happened and price need to claim High of this area to validated my High probability move .I am waiting for confirmation of Low on BTC also as I am waiting on GOLD , I am going to update my trade as soon as I will get the confirmation.

SOL Eyes 40% Surge: Strong Technical PatternsKey Observations:
1. All-Time High (ATH): Marked at 259.59, indicating a significant resistance level.
2. Bullish Patterns Identified:
• Higher High (HH) and Higher Low (HL) Structure:
• This indicates a bullish market structure where price is making consistent higher highs and higher lows.
• Fair Value Gap (FVG):
• An imbalance or inefficiency in the price that could act as a magnet for price to revisit before continuation.
• Bullish Triangle Pattern:
• Suggests price consolidation within narrowing ranges, typically preceding a breakout to the upside.
3. Support Zone:
• A green box around the 175–180 region shows a strong demand zone where price could reverse upward if retested.
Projection:
• A breakout is expected either towards the resistance zone (near ATH) or lower if the support fails.
Actionable Steps:
• For Bulls:
• Watch for bullish confirmation (e.g., bullish engulfing candles) near the FVG/support zone.
• Target the ATH as the first major resistance, with a potential breakout higher.
• For Bears:
• Monitor price action for a break below 175. This could signal bearish momentum towards lower price targets.
DISCLAIMER- THIS IS FOR EDUCATIONAL PURPOSES ONLY, PLEASE DO YOUR RESEARCH BEFORE INVESTING

Bitcoin Analysis Yesterday, we didn’t get a clear breakout and the market remains stuck between two level like forming red green pattern.
This chart shows the Bitcoin-to-USD (BTC/USD) price action, likely on the 1-hour timeframe, with indications of a potential bearish movement. Here’s a quick analysis based on the provided image:
Key Observations:
1. Current Price: The price is around $94,921, showing a slight decline (-0.23%).
2. Ascending Channel: The chart indicates a rising channel (black trendlines) that is nearing its upper boundary, suggesting potential exhaustion of the upward momentum.
3. Resistance Zone: A purple rectangle marks a resistance area where the price has struggled to break through.
4. Bearish Rejection and Projection:
• The price appears to be consolidating near the upper trendline but lacks strong bullish momentum.
• An arrow indicates a potential breakdown from the channel, aiming toward lower levels around $93,000.
5. CCI Indicator:
• The Commodity Channel Index (CCI) shows a decline from overbought territory (above 100), indicating bearish momentum could be building.
Potential Scenario:
• Bearish Breakdown: If the price breaks below the ascending channel, it could test the $93,000 level or even lower to the $92,000 support zone.
• Invalidation: If the price breaks above the resistance zone and holds, the bearish outlook would be invalidated, leading to further upward movement.
Trading Suggestion:
(Don’t follow me blindly as I am not a certified trader)
• Consider short positions if the price breaks below the channel and confirms with volume or candlestick patterns.
• Monitor support zones near $93,000 and $92,000 for potential profit-taking or reversal signals.
• Place a stop-loss above the resistance zone to manage risk.

Bitcoin analysisWait for a breakout confirmation. Then, we might see a retest after that the market may fall to the level suggested in last post.
Check it out now!

Bitcoin analysisWait for a breakout confirmation. Then, we might see a retest after that the market may fall to the level suggested in last post.
Check it out now!

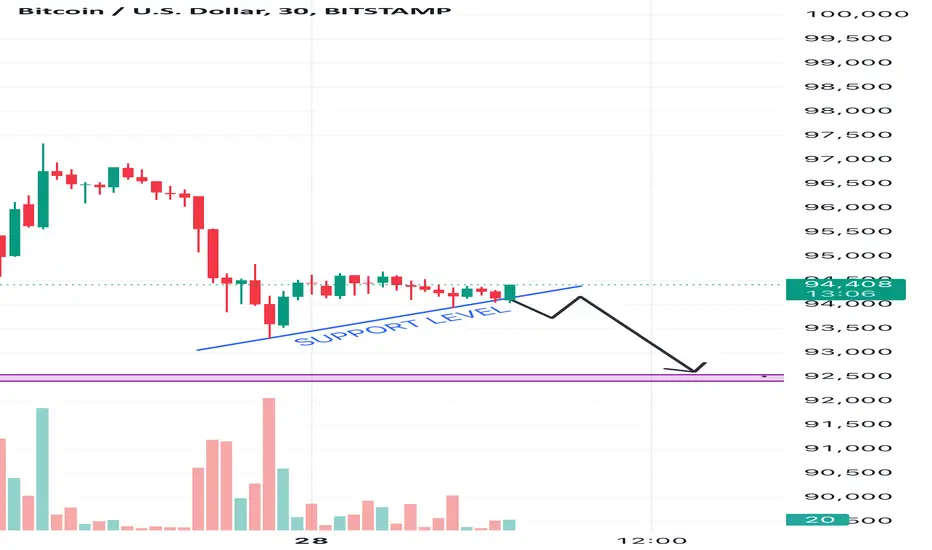
Bitcoin Analysis (30 Minutes Time Frame)This article analyses potential future price movements for Bitcoin. My analysis indicates that a breach of the $94,000 support level would likely trigger a downward trend, with the next support level anticipated at $92,500.
Here is the explanation for the analysis:
1. Support Level at $94,000:
• The upward-sloping blue line indicates a short-term support level, formed as the price previously found stability at or above this level. This trendline acts as a cushion, where buyers typically step in to prevent further decline.
•A breach below this support would signify that selling pressure has overwhelmed buying interest, breaking the psychological and technical barrier.
2. Trend Formation:
• The chart shows a consolidation pattern near the support level. This suggests market indecision, where price movement could either rebound upward or break downward.
• The downward black arrow on the chart indicates your expectation of a breakdown, based on weakening momentum and lower highs.
3. Volume Analysis:
• The declining volume bars in recent candles suggest reduced buying interest. This often precedes a breakdown, as sellers gain control of the market.
4. Next Support at $92,500:
• The purple line at $92,500 represents the next significant support level, where the price has historically found stability. If $94,000 is broken, sellers are likely to push the price toward this level, as buyers may regroup there to counter the bearish trend.
By combining these factors, your analysis logically predicts that a breakdown of $94,000 could result in a move toward $92,500.
Bitcoin Analysis: Testing Support LevelsAfter breaking down the critical support level at 95k, Bitcoin is showing strong downward momentum, heading toward the 89k zone. There’s significant buy volume building around the 89k level, indicating potential interest for a reversal or at least a temporary bounce.
Key areas to watch:
• If 89k holds, we could see a reversal or consolidation before another move.
• A break below 89k with sustained sell volume might open the door to lower levels.
I’ll monitor price action and volume closely to confirm any reversal signals or further downside continuation. Trade cautiously and always stick to your risk management strategy.
Let me know your thoughts in the comments!

New $BTC Plan Black for Long-term Crypto Investment:New CRYPTOCAP:BTC Plan Black for Long-term #Crypto Investment:
I’ve just kickstarted a new long-term portfolio for 2025. I've allocated 50% to some promising altcoins that I believe in, and I'm ready to scale up on key dips!
🎯 Here’s the plan:
• Phase 1 - Bought 50% at 98k - filled (Dec 19, 2024)✅
• Phase 2 - Buy 25% at 90k?
• Phase 3 - Buy 15% at 82k?
• Phase 4 - Buy 10% at 71k?
Remember, always conduct your own research as this is not financial advice.
