BTC developing a good sell opportunityBTC is moving in range for long time. Now it has shown a displacement after ChoCH and formed a bearish 15m FVG. There may be a good trade at sell side if price approach it. Well there are two trade scenarios are forming.
1. Price moves to 15m FVG and OTE overlap zone.
2. Most probably price will take liquidity of FVG and OTE zone and create MSS in LTF.
3. After breaking trend line it should pullback till FVG/trend line or any newly created OB/FVG.
All these combinations are signalling a high probability and high Risk and Reward (1:8) trade scenario.
Note – if you liked this analysis, please boost the idea so that other can also get benefit of it. Also follow me for notification for incoming ideas.
Also Feel free to comment if you have any input to share.
Disclaimer – This analysis is just for education purpose not any trading suggestion. Please take the trade at your own risk and with the discussion with your financial advisor.
Cryptomarket

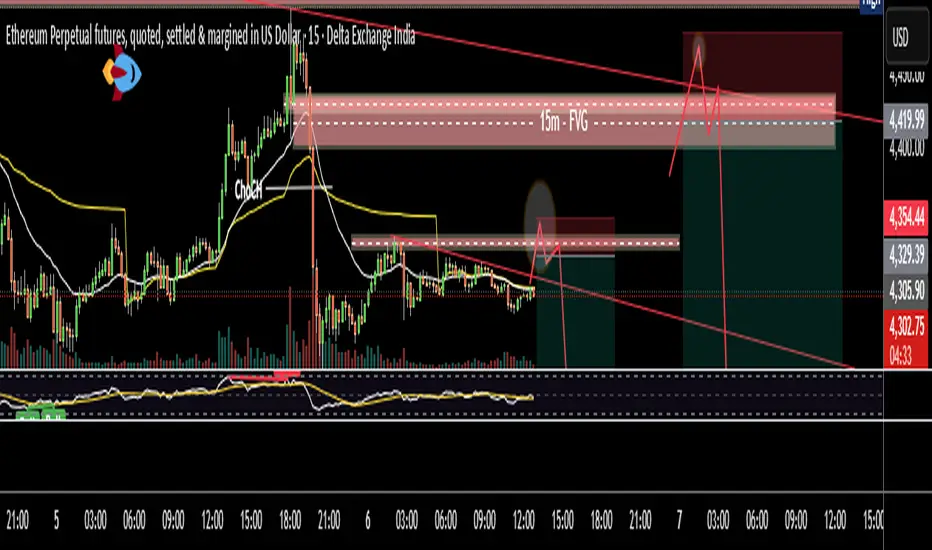
ETH multiple Sell OpportunitiesETH is moving in range for almost a week time. Now it has shown a displacement after ChoCH and formed a bearish 15m FVG. There may be a good trade at sell side if price approach it. Well there are two trade scenarios are forming.
Trade # 1
1. Price is moving around a short term trend line and resistance.
2. If price breaks trend line and take the liquidity of resistance than it may be sell trade.
Trade # 2
3. Price moves to 15m FVG and OTE overlap zone.
4. Most probably price will take liquidity of FVG zone and break trend line.
5. After breaking trend line it should pullback till FVG/trend line or any newly created OB/FVG.
All these combinations are signaling a high probability and high Risk and Reward (1:8) trade scenario.
Note – if you liked this analysis, please boost the idea so that other can also get benefit of it. Also follow me for notification for incoming ideas.
Also Feel free to comment if you have any input to share.
Disclaimer – This analysis is just for education purpose not any trading suggestion. Please take the trade at your own risk and with the discussion with your financial advisor.
SOLUSD Short trade @205Overall Crypto market is under correction mode. After sharp fall SOLUSD showed some pullback @205 levels and that’s the best entry price to enter for a Short trade. Risk reward ratio is 1:2.5 in this trade.
Entry - 205
Target -198
SL - 207.80

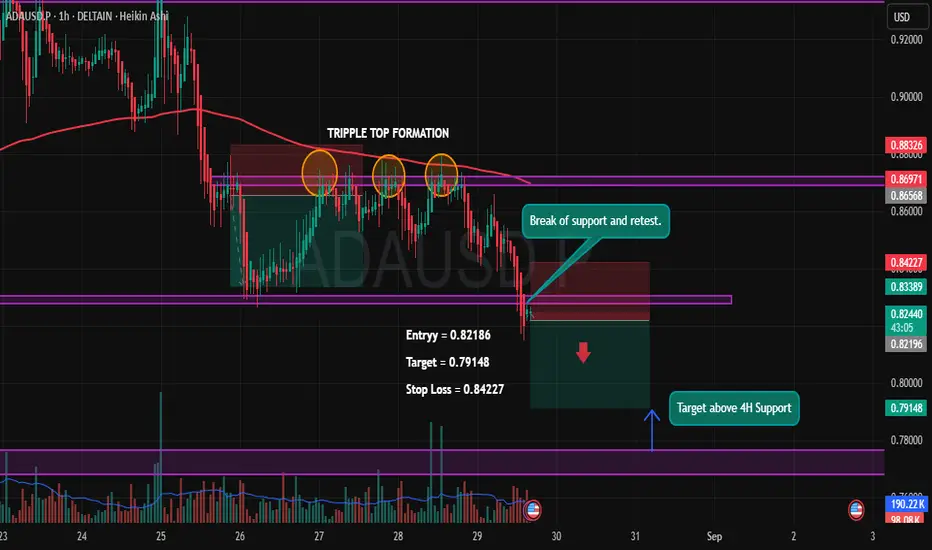
ADA/USDT – Triple Top Breakdown Play🔎 Setup Insight:
ADA has formed a Triple Top pattern near the 0.869 zone, confirming strong rejection from resistance. After multiple failed attempts to break higher, price finally broke down key support and is now retesting it, giving a clean short opportunity.
✨ Trade Plan:
Entry: 0.82186
Target: 0.79148 (Above 4H support zone)
Stop Loss: 0.84227
✅ Reasons for Short Bias:
Triple Top Formation ➝ Strong bearish reversal signal.
Break & Retest of Support ➝ Previous demand now acting as supply.
Confluence with 200 EMA rejection ➝ Trend remains bearish.
Volume Confirmation ➝ Selling volume stronger than buying.
🎯 Targeting the next major support on the 4H timeframe, with a favorable Risk-Reward setup.
⚠️ Disclaimer: This analysis is for educational purposes only and not financial advice. Always manage your risk before entering any trade.
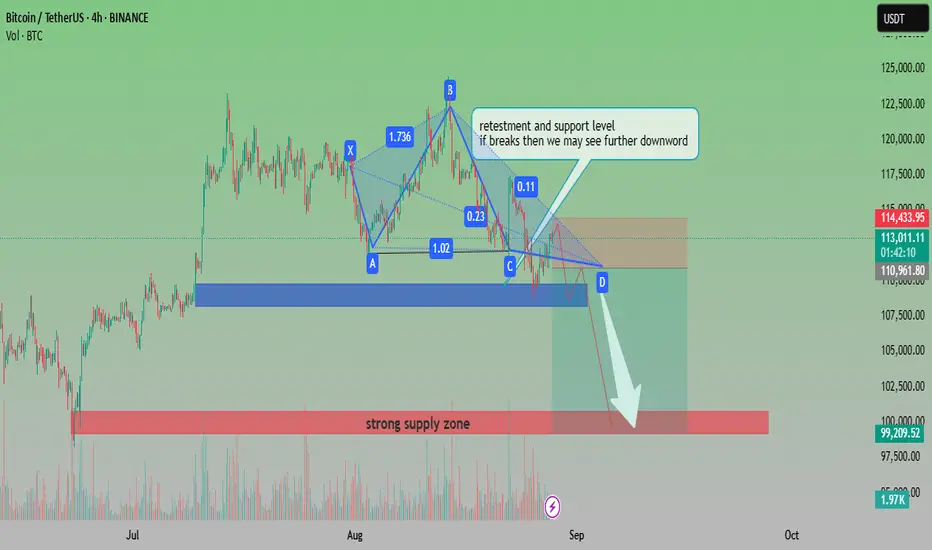
BTCUSDT Bearish Pattern with Key Support RetestAnalysis:
The chart shows Bitcoin (BTCUSDT) forming a harmonic pattern that signals potential bearish continuation. Price is currently retesting a critical support and resistance level around the 113,000–114,000 zone. If this level fails to hold, further downside movement is expected.
Pattern Formation: The harmonic structure (XABCD) suggests a bearish setup.
Support Zone: Around 110,900–111,000, a crucial level to watch.
Downside Target: If support breaks, the price could move toward the 99,000–100,000 strong supply zone.
Volume: A noticeable volume build-up supports potential continuation to the downside.
📉 Outlook: Bearish bias. A breakdown from current retest levels may accelerate selling pressure toward the 100k psychological zone.
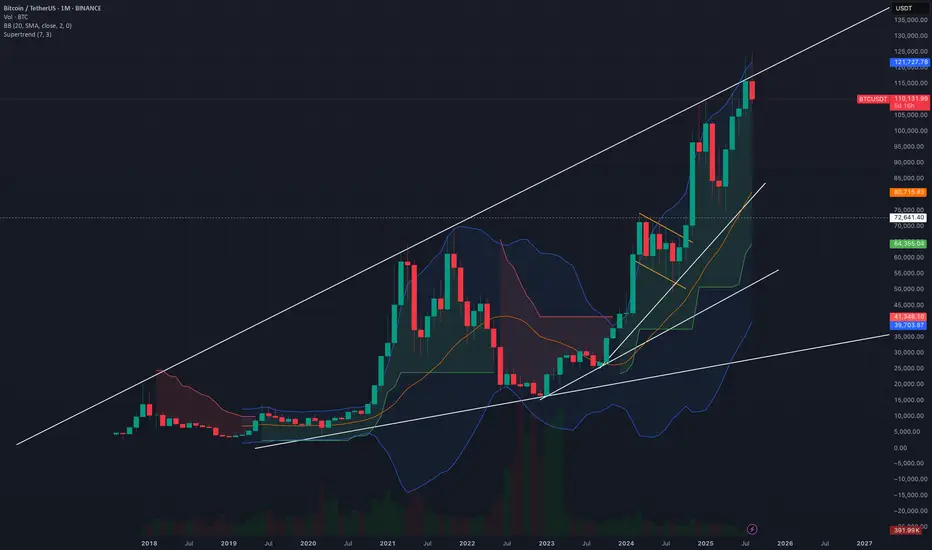
BitCoin? a bit down or big downBitcoin is loosing it fizz now and rally may be about to end.
as per chart reading i can see that it is on the resistance levels
and as now world economies are also settling it should be possible that crypto frenzy get no hype and for that Bitcoin may see a down pludge
Possibly for next 2-2.5 Years Bitcoin won't cross the recent highs and may be retesting 72K level or more downside.
Up move will only continue after breaking and closing above this trendline.
Bearish Setup on BCH/USDOverview:
The market conditions and price action are currently indicating a bearish trend for BCH/USD. Below is the detailed breakdown of the trade setup and why this position is logical:
Market Structure:
The price is in a downward trend, confirmed by the lower highs and lower lows visible on the chart.
A break below key support levels, along with the current price action, suggests that the bearish move is likely to continue.
Entry Level:
Entry = 580.53: The entry has been strategically placed below a key resistance level, which is also near the recent high. This confirms that a breakdown is happening, setting the stage for further downward movement.
We are entering at a point where the price has shown weakness and failed to continue its upward movement, which typically signals a potential continuation to the downside.
Stop Loss (SL):
Stop Loss = 601.45: The stop loss has been placed above a previous swing high, ensuring that the trade will only be invalidated if the price reverses above this level, thus protecting us from a false breakout.
The chosen level ensures the risk is kept under control while still allowing for reasonable price fluctuations within the trend.
Take Profit (TP):
Target = 535.76: The target is set based on recent price action, aligning with previous support levels. This level is where the price is expected to find potential support before making any reversal.
The risk-to-reward ratio here is favorable, with a potential reward much higher than the initial risk, making the setup an attractive swing trade opportunity.
Trend Confirmation:
The price is below the 50-period and 200-period EMAs, indicating that the overall trend is bearish.
The trendline at the bottom, which slopes upward, serves as an additional support that the price is expected to break below before confirming the bearish move.
Volume:
Volume analysis indicates increasing selling pressure, supporting the bearish narrative.
A breakout with higher volume confirms the strength of the downtrend, reducing the chances of a fakeout.
Conclusion:
The overall market structure, confirmed by the price action, trend, and volume analysis, suggests that the market is likely to move lower.
With a favorable risk-to-reward ratio, this setup is logical and worth considering for those looking to enter a short position on BCH/USD.

Bearish Trade Setup for ETH/USDOverview:
The setup for this trade is based on a bearish outlook for Ethereum (ETH) against the US Dollar (USD) on the 1-hour chart. The entry, stop loss, and take profit levels are carefully defined to provide a balanced risk-to-reward ratio. Here's why this setup is a solid trade idea:
1. Trade Entry:
Entry Price: 4574.87
The entry point is set based on a recent price retracement within the prevailing downtrend. The price has shown signs of rejection from key resistance levels, and the trade is positioned to capitalize on further downside momentum.
2. Target Price:
Target Price: 4241.87
The target level is derived from technical analysis, where price is expected to move toward previous support levels, presenting a logical exit point for profits.
3. Stop Loss:
Stop Loss Price: 4741.37
The stop loss is placed above recent swing highs, ensuring the trade has enough room to breathe while minimizing the risk of false breakouts. This level is a protective measure to ensure that a reversal or unexpected price movement does not lead to unnecessary losses.
4. Risk-to-Reward Ratio:
RRR: The trade has an acceptable risk-to-reward ratio, where the potential reward outweighs the risk by more than 1:1. This is crucial for maintaining profitability over the long term.
5. Trend Analysis:
The market is currently in a bearish phase, as seen in the price action and the overall downtrend. The setup capitalizes on this momentum with a proper risk management strategy.
The use of indicators like moving averages can further confirm the downtrend, though they are not displayed here, they should align with the bearish trend.
6. Volume Confirmation:
The volume should ideally be decreasing during the retracement phase and increase during the move towards the target price, confirming the bearish continuation.
7. Conclusion:
This trade is well-positioned to take advantage of a continuation of the bearish trend. The entry, stop loss, and target are all logically placed based on key price levels and risk management principles. As always, ensure to monitor the trade, and be ready to adjust if market conditions change unexpectedly.

ETH BigBOEntry- 4555-4545
Targets- All time High
SL- 4465 (FIb Levels)
Reason- After a big volume candle near all time high ETH made a retracement and from here it can continue its upside journey towards all time high and 5050 Levels. Entry is being made in Fib Golden zone level which has been made in bigger tf that is daily tf and entry in taken in the shorter tf that is 1 hr tf.
Disclaimer- This is just for educational purpose.
Jai Shree Ram

Bullish Position on BCHUSD (Bitcoin Cash/US Dollar)Overview:
This trade setup presents a strong bullish opportunity on BCH/USD, with a clear upward move anticipated based on price action and trendline analysis. The entry point, stop loss, and target are already marked on the chart.
Entry Point: 599.09
The entry is set at 599.09, where the market shows a solid break above the recent resistance level. The bullish move is supported by the trendline breakout and price action, indicating a potential upward continuation.
Stop Loss: 577.34
The stop loss is placed at 577.34, just below the recent swing low, providing a safe distance from any possible market pullback. This ensures we exit the trade in case the market moves against the position.
Target: 625.32
The target is set at 625.32, which is based on the recent resistance level and Fibonacci extension projections. A move towards this target is highly probable if the current bullish momentum continues.
Trade Rationale:
Trendline Breakout: Price has broken a descending trendline (indicated in blue) that has been holding the market in a bearish pattern. This breakout signals a shift in market sentiment, with a potential to ride the bullish wave.
Volume Surge: The recent price surge is supported by increasing volume, which further strengthens the case for continuation of the upward move.
Price Action Confirmation: The price is making higher lows and higher highs, which is characteristic of an uptrend, aligning with the bullish scenario.
Risk/Reward:
The risk-to-reward ratio is 1:1.42, which is a favorable setup for those aiming for a reasonable reward relative to the risk taken.
Conclusion:
This is a well-structured bullish trade setup with a clear entry, stop loss, and target. If the price continues to show strength and remains above the trendline, the trade is likely to hit the target at 625.32. Ensure to monitor the position regularly and adjust the stop loss as necessary to lock in profits if the price moves in your favor.

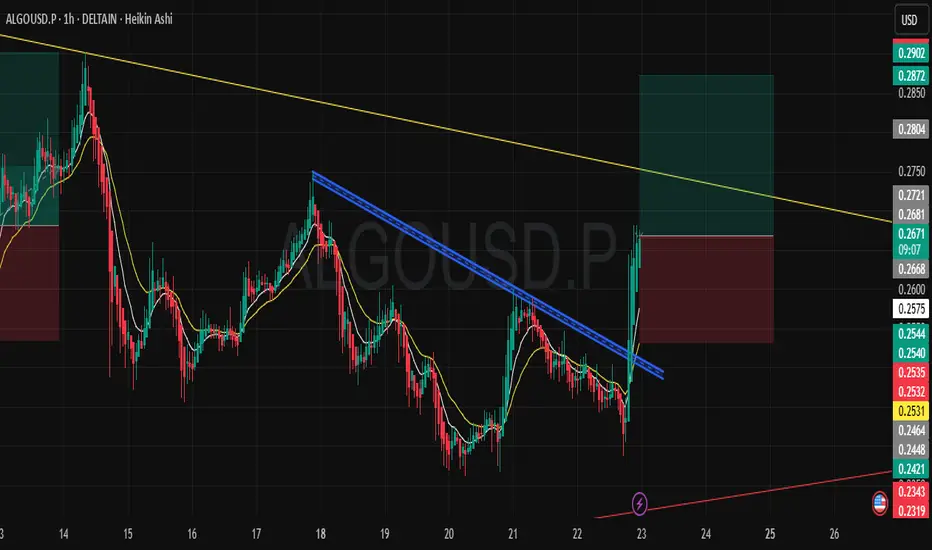
ALGO/USDT – Bullish Breakout Setup (1H)ALGO has shown a clean breakout from the descending trendline (blue) after several days of lower highs. The breakout was backed by strong bullish candles and a close above the short-term EMAs, confirming momentum shift to the upside.
🔹 Trade Plan:
Entry: Around 0.2575 (post-breakout confirmation)
Stop Loss: 0.2540 (below structure & EMAs)
Targets:
First Target: 0.2721
Second Target: 0.2804
Extended Target: 0.2902
🔹 Technical Outlook:
The descending trendline was acting as resistance since August 17 and has now been broken.
EMAs are turning upward and aligning bullishly.
Strong volume push on breakout candle indicates buyers stepping in.
Next major resistance sits near the higher descending yellow trendline – a break above that could open the way toward higher levels.
📊 Bias: Bullish as long as price holds above 0.2540. Watching for continuation toward upper resistance.
Bullish Trade Setup for XRP/USD - Pattern CompletionThis is a bullish setup based on a harmonic pattern completing, with the price approaching a key resistance zone. Our entry, stop-loss (SL), and take-profit (TP) levels are clearly marked on the chart.
Entry: 3.0628
The entry point is marked when the price reaches the ideal level for the pattern completion.
Take Profit (TP): 3.1832
This is the target area where the price is expected to move towards, as per the harmonic pattern and previous price action.
Stop Loss (SL): 2.9627
The stop-loss is placed below the low of the last structure to protect from unexpected price movement.
Technical Analysis:
Pattern Identification:
A clear bullish harmonic pattern is visible, with points X, A, B, C, and D forming a potential Bat or Gartley pattern. This type of setup has historically shown a high probability of reversal or continuation at point D.
Price Action Confirmation:
The price has already shown some signs of reversal at point C, with increasing buying volume at the current levels.
The market sentiment is strong, and we are entering at a point where the pattern completion aligns with the overall bullish market structure.
Volume:
There is a noticeable increase in volume as the price approaches the resistance zone (point X), supporting the idea of a bullish breakout.
Risk-to-Reward (RRR):
The setup offers a 1:2.56 RRR, which is well within an acceptable range, ensuring that the potential reward outweighs the risk taken on the trade.
Why This Trade Makes Sense:
Pattern Confirmation: The harmonic pattern is completing, and price action aligns with the expectations of a move higher.
Key Resistance Break: If the price breaks above the marked resistance, this could signify a strong continuation of the bullish trend.
Solid Risk Management: With a well-placed stop loss, the trade is risk-managed while giving the price room to move.
This setup provides a good risk-to-reward ratio and a high probability of success, based on the technical confluence of the harmonic pattern and price action.

APEUSDT.P – Possible Long Opportunities (1H Chart, Binance)1. Price rejected from 0.6450 supply and is now correcting lower.
2. Strong demand zones are visible around 0.6220–0.6180 and deeper near 0.5880–0.5650.
3. If price holds above 0.6180, we may see a bullish bounce toward 0.6340–0.6450 resistance.
4. A deeper retracement into 0.5880–0.5650 could provide a high-probability long entry if demand reacts strongly.
📈 Plan:
First long entry: around 0.6220–0.6180 with target 0.6400–0.6450.
Second long entry (if broken lower): 0.5880–0.5650 demand zone with swing targets back toward 0.6220 and 0.6400.
Invalidation below 0.5600.
Recommendation: Wait for bullish confirmation before entry(in short Time frame) ; avoid chasing price.

ALTUSDT.P (2H) – Long SetupPrice broke out of consolidation and is retesting the demand zone 0.03300 – 0.03335. This zone aligns with liquidity grab + order block support.
Entry Zone: 0.03300 – 0.03335
Stop Loss: Below 0.03213 (recent swing low)
Target 1: 0.03643
Target 2: 0.03950 – 0.03951
RR Ratio: ~1:3 – 1:4
✅ Waiting for bullish confirmation at demand.
⚠️ If demand fails, structure may turn bearish again.

"Bitcoin Eyes $100K Re-Entry: Retest, Support Zone, Then Push ?Chart Analysis
1. Price Structure & Trendlines
The chart displays a former upward trendline that has been broken, leading to a corrective pullback.
Following that, price is perched within a “retest zone” (the red-shaded rectangle), which aligns with both historical horizontal resistance—now turning into support—and an area of previous consolidation. This is a classic setup: price often retests key breakout levels before resuming its move.
2. Support Levels
The main support is clearly drawn around the $100K zone, highlighted by a grey bar below the retest zone. This is a psychological and structural area to watch for potential strong buying.
Immediate support appears near $110K–$112K, as noted by the lower edge of the red retest area—this zone has shown to catch corrections before in technical analysis and news reports
AInvest
Mudrex
Barron's
.
3. Resistance & Upside Targets
If the retest holds, the chart charts a potential bounce toward the upper rising trendline and beyond, potentially aiming for the $126K–$130K region, as marked by Fibonacci retracement levels.
This aligns with several external forecasts suggesting resistance or target zones in that range
AInvest
Mudrex
Barron's
.
4. Potential Price Path & Scenarios (Denoted by Red Arrows)
Bearish Scenario: Price may dip down into the retest zone, test support, and—if the breakdown occurs—continue lower toward $100K—a key area of interest.
Bullish Scenario: The support holds, leading to a V-shaped recovery that propels price back above $115K, potentially triggering a rally toward $122K–$130K.
Summary Table
Key Zone / Level Significance & Note
$110K–$112K Critical near-term support; breakdown risks move toward $100K
AInvest
Mudrex
Retest Zone (~$114K–$115K) Area combining horizontal support and trendline; serves as pivot for next move
Mudrex
AInvest
$120K–$123K Major resistance where a breakout could fuel continuation toward $127K–$130K
Mudrex
Barron's
Broader Context & Market Sentiment
Bitcoin is currently consolidating after setting new highs near $124K
MarketWatch
The Economic Times
Barron's
Cointribune
.
Analysts observe that sustaining above the $110K–$112K band is essential to the bullish case; falling below it could invite deeper downside
Barron's
Cointribune
AInvest
.
Conversely, a decisive move above $120K–$123K could validate continuation toward $127K–$130K, and even higher—some forecasts extend to $135K and beyond
Mudrex
Indiatimes
Barron's
CoinCodex
.
Final Thoughts
Your chart beautifully illustrates the classic “retest after breakout” dynamic:
Hold above the retest zone? Look for a rebound toward $120K+, with the potential for a full bullish revival aiming for $130K.
Break below $110K–$112K? Watch for a possible move toward $100K—a critical support level.
Stay alert to macro catalysts too—like Federal Reserve interest rate signals, institutional inflows (ETFs), and regulatory developments—which could steer the next leg substantially

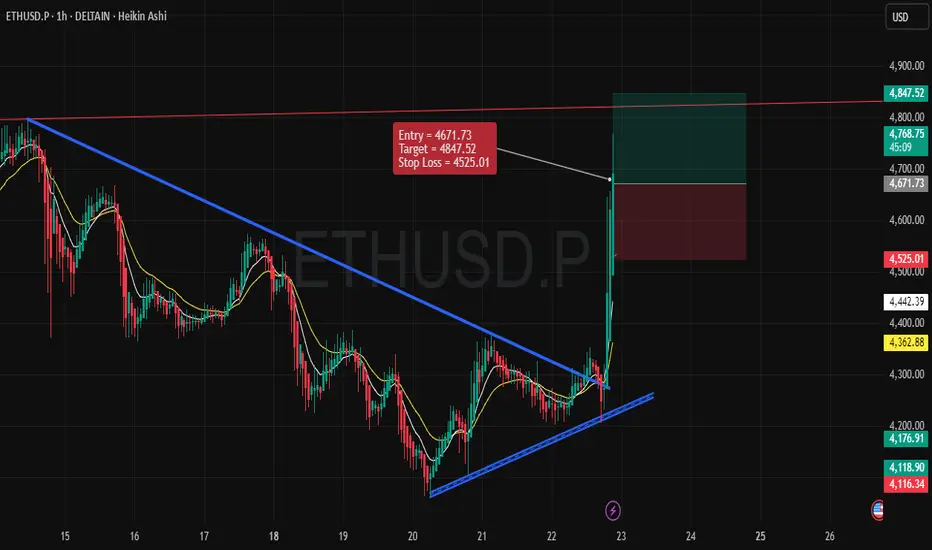
Bullish Scenario for ETH/USD (1-Hour Time Frame)Entry Point: 4671.73
Stop Loss: 4525.01
Target (Take Profit): 4847.52
1. Price Structure and Trend:
The price has been moving within a well-defined downtrend, but there has been a noticeable shift. The recent breakout above the blue trendline signals a potential reversal from a bearish to a bullish trend.
This breakout indicates increased buying interest, suggesting that ETH/USD might continue its upward momentum in the short term.
2. Key Levels:
Support Level: The price has recently bounced off a support zone near 4525, which acts as the stop loss level. A strong bounce from this point further validates the bullish outlook.
Resistance Level: The target price of 4847.52 is placed near a resistance zone, which represents the next major hurdle for ETH/USD.
3. Entry Strategy:
The entry point is placed at 4671.73, just after the breakout above the blue trendline, where the price is gaining upward momentum.
The market seems to have found new buying strength after consolidating, which strengthens the case for a potential move to the target level.
4. Risk-to-Reward Ratio (RRR):
The risk-to-reward ratio for this trade is favorable, with a potential gain of around 175 points (4847.52 - 4671.73) against a risk of approximately 146.72 points (4671.73 - 4525.01). This results in a solid 1:1.2 RRR, which is a reasonable expectation for this bullish trade.
5. Indicators and Confirmation:
The chart features moving averages (yellow and white lines) indicating a shift from a bearish trend to a bullish phase.
The price action shows strong buying pressure, especially with the recent candlestick pattern, confirming the breakout and trend continuation.
6. Conclusion:
With a confirmed breakout, an entry at 4671.73 offers a great opportunity for a bullish move towards the target of 4847.52. The stop loss is safely placed at 4525.01, considering recent support.
This trade setup appears well-aligned with the current market conditions and technical indicators, making it a logical and worthwhile trade idea.
Bearish ADA/USD Trade Idea: Downtrend Continues1. Market Analysis:
The ADA/USD pair is currently in a strong downtrend. A downward-sloping resistance line is clearly visible, highlighting the continuing pressure on price. The pattern forming is a descending triangle, which is typically a bearish signal when the price breaks below the lower support level.
2. Entry Point:
Our entry point is at 0.8292. This is based on the price action within the triangle pattern, as the market is struggling to break the resistance and is testing the lower boundary multiple times. A breakdown below this level is anticipated, continuing the bearish momentum.
3. Stop Loss:
The stop loss is set at 0.88768. This level represents a recent swing high within the triangle pattern. If price moves back above this level, the trend reversal could be signaled, so it’s crucial to manage risk with this stop.
4. Target:
The target price is set at 0.74165. This is a key support area, previously tested, and the price action indicates that it could act as the next major level of demand. This aligns with our trade objective of riding the trend toward the next significant support.
5. Rationale:
The descending triangle is a bearish continuation pattern, and the breakout below the lower support confirms the downtrend.
Volume has been decreasing as the price approaches the triangle's apex, a common sign that the market is getting ready for a breakout.
The overall trend is bearish, and this setup aligns with the prevailing market sentiment.
6. Conclusion:
This trade idea is based on a well-formed technical pattern, with clear entry, stop loss, and target levels. By entering at 0.8292, setting a stop loss at 0.88768, and targeting 0.74165, we are positioning ourselves to profit from the continuation of the current downtrend in ADA/USD.
Make sure to monitor price action closely, as any deviation from the expected pattern might require adjustments to the trade.

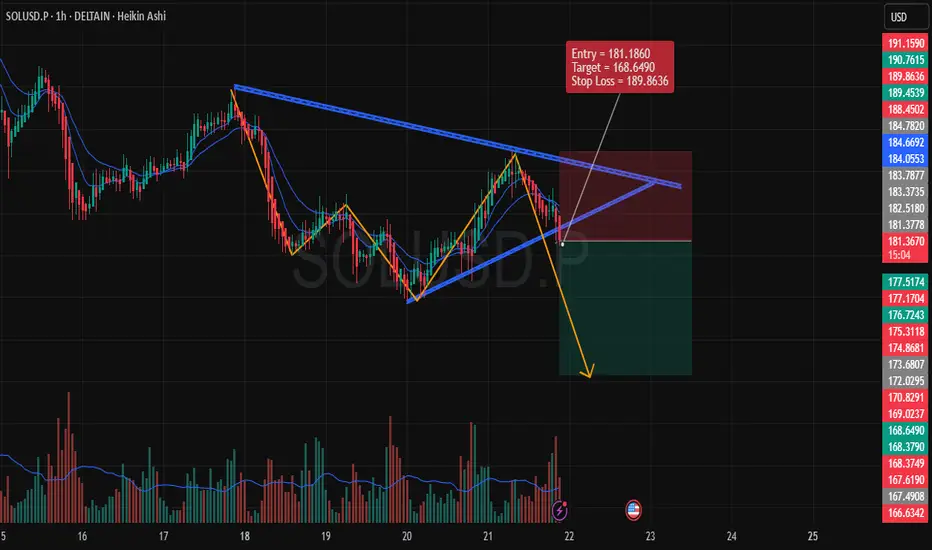
Bearish Setup on SOLUSD (1-Hour Time Frame)Entry Price: 181.1860
Target: 168.6490
Stop Loss (SL): 189.8636
1. Chart Analysis
We are observing a descending triangle pattern formation, which generally signals a bearish continuation once the price breaks downward.
The price action has already shown signs of rejection at the upper boundary of the pattern, reinforcing the possibility of a breakout to the downside.
2. Indicators & Confirmation
Volume Analysis: Noticeable spike in volume during the recent downward movement, which indicates strong selling pressure. This is crucial for confirming the potential bearish trend.
EMA Confluence: The price is below the 9 and 20 EMAs, which are crucial indicators of the current market trend. The EMAs are acting as dynamic resistance, further supporting the bearish scenario.
3. Risk Management
The stop loss is placed above the most recent significant high at 189.8636. This placement ensures that we protect against any false breakouts or short-term price reversals.
The target at 168.6490 is derived based on previous support levels and a measured move from the triangle pattern. This target is realistic given the market structure.
4. Price Action
The price action shows lower highs and lower lows, a typical characteristic of a downtrend. If this pattern holds, the next logical price move is to break downward through the support of the triangle.
5. Conclusion
Overall, this setup provides a solid bearish opportunity, backed by technical patterns and strong momentum indicators. The risk-to-reward ratio is favorable, making it a well-structured trade.
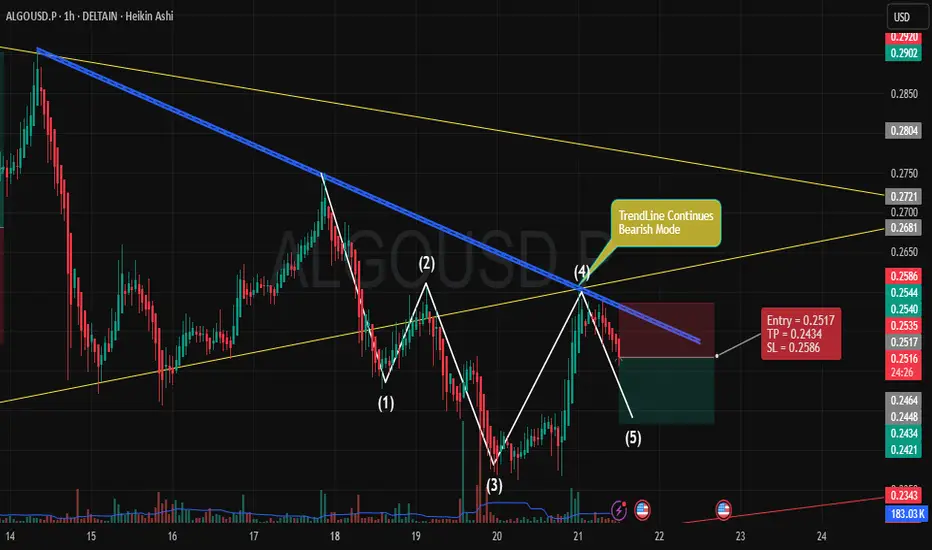
Bearish Continuation for ALGOUSD** IF you like my observation, please boost and follow for more content."
Trade Overview:
Entry: 0.2517
Stop Loss (SL): 0.2586
Take Profit (TP): 0.2434
Key Points:
Trend Analysis:
The price is currently under a bearish trend as indicated by the downward sloping blue trendline. This trendline shows consistent resistance, rejecting price rallies and continuing the bearish bias.
The yellow trendlines represent key support and resistance zones, highlighting the consolidation range where the price has been fluctuating within a defined pattern.
Market Structure:
Price has formed a lower high (marked as point 4), followed by a lower low (point 5), confirming the continuation of the downtrend. This suggests that the market is likely to keep pushing lower towards the target.
The price has retraced upwards but has failed to break the bearish trendline, reinforcing the idea of further downside potential.
Entry Strategy:
Entry Point: We are entering at 0.2517, just below the recent resistance, anticipating the price to continue downward after failing to breach the trendline.
The price action at point (4) suggests weakness in the upward movement, making this a prime opportunity to capitalize on further downside movement.
Risk-Reward Setup:
The Stop Loss is set at 0.2586, just above the last swing high, giving room for minor retracements while protecting against a breakout above the trendline.
The Take Profit is set at 0.2434, targeting the next level of support where the price could potentially find buying interest. This gives a favorable Risk-Reward Ratio of about 2:1.
Volume Confirmation:
Notice the increase in volume during the downward movement, suggesting that sellers are in control. A drop in volume during price retracements further validates the weak bullish momentum and confirms the expected continuation to the downside.
Why This Setup?
The bearish trend, price action, and trendline rejection all align with a continuation trade setup.
The risk-reward is favorable, with a clear structure to exit the trade if the price moves against the position.
The broader market context is also in line with a bearish outlook, making this a high-probability trade setup for the next few hours.
XRP/USD Trade Setup: Bearish Position on Technical AnalysisTimeframe: 1 Hour
Entry Price: 3.0229
Take Profit (TP): 2.8769
Stop Loss (SL): 3.1199
1. Market Overview
XRP is currently in a bearish phase, and the price action indicates that a downward continuation is likely. The market has been rejecting higher levels, with strong resistance at the 3.1777 zone, and now the price appears to be moving lower.
2. Entry Criteria:
The entry point is set at 3.0229, just below the current price level, where we anticipate the market to continue its downward movement after facing resistance at higher levels.
The recent price action shows a clear rejection from the upside, and we are expecting further downside once the price breaks below the immediate support near the entry.
3. Technical Indicators:
Heikin Ashi Candles: The chart uses Heikin Ashi candles, which help smooth the price action. The red candles indicate a bearish sentiment, confirming the continuation of downward pressure.
Volume Analysis: The increase in volume during the recent selling phase is confirming that the bears are in control and the trend may continue to the downside.
4. Support & Resistance Levels:
Resistance: The price is facing resistance around 3.1777, which has proven to be a significant level of rejection.
Support: The main support zone is located near the 2.8769 level, which coincides with our take profit (TP). This is a logical target as it aligns with previous lower levels and current trend structure.
5. Risk-Reward Ratio:
The Stop Loss is placed at 3.1199, just above the recent swing highs and resistance level, ensuring we limit risk in case of a market reversal.
The Take Profit is set at 2.8769, offering a solid risk-reward ratio of 1:1.5. This level is where we expect the price to find support and potentially reverse after hitting the target.
6. Trade Management:
Monitor Resistance Level: If the price fails to break below the entry and starts moving upward, consider adjusting the stop loss or exiting the position to limit losses.
Trailing Stop: Once the price starts moving in your favor, consider implementing a trailing stop to lock in profits as the price moves lower.
7. Potential Risks:
False Breakdown: A false breakdown is always a risk, where the price could temporarily dip below the support and reverse, hitting the stop loss before continuing lower.
Market Volatility: Be mindful of the inherent volatility in the crypto market, which can lead to sudden reversals due to news or other external factors.
8. Conclusion:
This trade setup is based on a bearish market structure, where price is showing clear resistance and the potential for further downward movement. The setup is logical with a strong risk-reward ratio and a clear target for profits. As always, risk management is crucial, and it's important to monitor price action closely for any signs of reversal.
Good luck, and trade carefully!

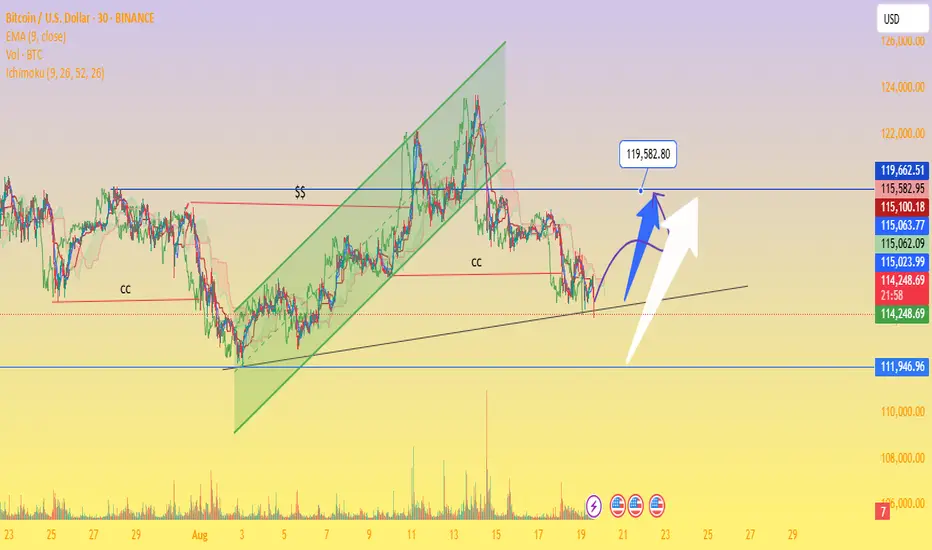
Bitcoin at a Critical Support – Breakout Toward $119K or ?Ascending Channel Breakdown – Price previously respected a rising green channel but broke below, showing weakness.
Critical Support Zone: Around $111,946 – $114,000 (black trendline + yellow support area).
Resistance Levels:
Near-term: $115,100 – $115,582
Strong: $119,582 (highlighted as major upside target)
Volume Profile: Declining volume with recent dip → signals possible accumulation before the next move.
Ichimoku Cloud: Price is slightly below cloud, indicating short-term bearish bias but with potential rebound if reclaimed.
Scenarios:
Bullish Case (Blue/White Arrows): If BTC holds above $114,000 support and breaks $115,500, a rally toward $119,500+ is possible.
Bearish Case: Failure to hold $114,000 may trigger a drop toward $111,946 (major demand zone).
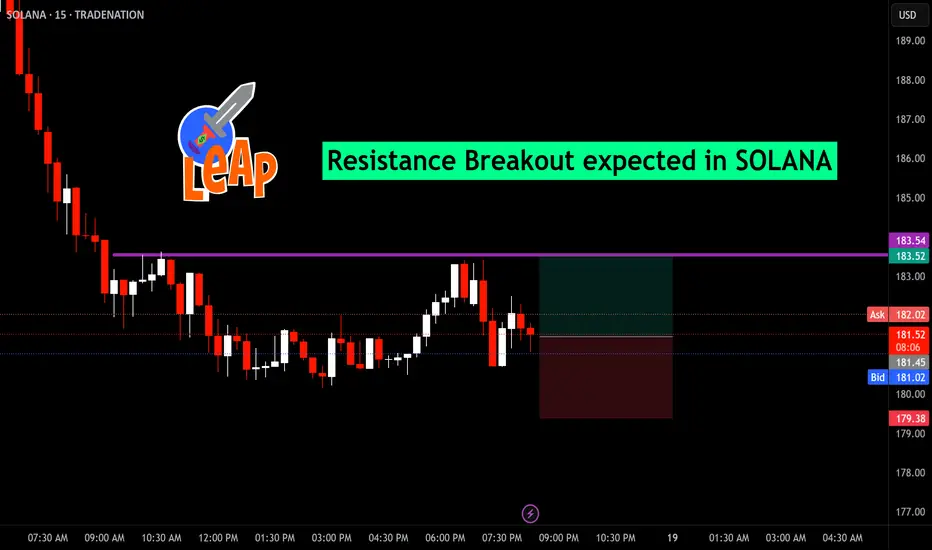
Resistance Breakout expected in SOLANASOLANA Resistance Breakout Alert!
This chart highlights a key trading opportunity in Solana (SOL) on the 15-minute timeframe. After a sustained downward trend, the price is currently consolidating near a significant resistance level at $183.54, marked by the purple horizontal line.
Current Price Action: SOLANA is fluctuating between $179.38 and $182.07, with buyers and sellers locking horns just below resistance.
Breakout Potential: A close above $183.54 (purple line) could trigger bullish momentum and potentially lead to a LEAP in price action.
Trade Setup: Watch for a confirmed breakout above resistance for entry. Target zones and risk management can be visualized on the chart’s green/red areas.
Sustainability & ESG Investing TrendsIntroduction
Over the past two decades, the financial world has experienced a massive transformation in how investments are analyzed, structured, and valued. Traditional investment strategies focused almost exclusively on financial metrics such as revenue growth, earnings per share, P/E ratios, and cash flows. But today, a new dimension has been added: Sustainability and ESG (Environmental, Social, and Governance) investing.
Investors, institutions, governments, and even retail traders are no longer looking at financial returns in isolation. They are increasingly asking:
Is this company environmentally responsible?
How does it treat its employees and communities?
Are its governance practices transparent and ethical?
This movement is more than just a trend—it represents a structural shift in how capital is allocated globally. Sustainability and ESG investing is about aligning profits with purpose. It’s about creating wealth while ensuring that companies contribute positively to society and the planet.
In this article, we’ll explore the evolution, importance, drivers, challenges, and future of sustainability & ESG investing trends, breaking it down in an easy-to-understand and comprehensive way.
1. Understanding Sustainability & ESG
What is Sustainability Investing?
Sustainability investing refers to investment strategies that prioritize companies or assets contributing to long-term environmental and social well-being. Instead of short-term financial gains, the focus is on sustainable value creation.
What is ESG Investing?
ESG stands for:
Environmental – How a company manages its environmental impact (climate change, carbon footprint, renewable energy use, waste management).
Social – How a company treats people (employees, customers, communities, human rights).
Governance – How a company is managed (board structure, executive pay, transparency, shareholder rights).
An ESG-focused investor doesn’t just look at profit margins—they also ask: Is this company ethical? Is it sustainable in the long run?
Why ESG Matters
Climate change is now a financial risk.
Consumers prefer sustainable brands.
Regulators demand transparency.
Younger investors want purpose-driven investments.
2. Evolution of ESG & Sustainability Investing
Early Stage (1960s–1980s)
The origins can be traced back to socially responsible investing (SRI), where investors avoided “sin stocks” (alcohol, tobacco, gambling, weapons).
Religious and ethical considerations played a big role.
Growth Stage (1990s–2000s)
The 1990s saw globalization and rising awareness about corporate social responsibility.
Companies began publishing sustainability reports.
The UN launched initiatives like the Principles for Responsible Investment (PRI) in 2006.
Modern Stage (2010s–2020s)
Climate change, global warming, and social justice movements accelerated ESG awareness.
The Paris Climate Agreement (2015) reinforced global commitments to sustainability.
ESG assets under management (AUM) skyrocketed to $40+ trillion globally by 2025.
3. Key Drivers of ESG & Sustainability Investing
Climate Risks – Extreme weather, rising sea levels, and resource scarcity directly affect business operations and valuations.
Consumer Preferences – Millennials and Gen Z prefer eco-friendly and socially conscious brands.
Regulations & Policies – Governments mandate disclosures (EU’s SFDR, India’s BRSR, SEC proposals in the US).
Capital Flows – Global funds and pension plans increasingly allocate capital based on ESG scores.
Corporate Reputation – Companies with poor ESG practices face backlash, loss of trust, and higher costs.
4. Global ESG Investment Trends
Trend 1: Surge in ESG Assets
As of 2025, global ESG assets are projected to cross $50 trillion, representing nearly a third of total AUM worldwide.
Europe leads the charge, followed by North America and Asia.
Trend 2: Renewable Energy Boom
Solar, wind, and green hydrogen projects attract heavy investments.
Fossil fuel divestment is accelerating.
Trend 3: ESG ETFs & Index Funds
ESG-focused exchange-traded funds (ETFs) have exploded in popularity.
Major indices like the MSCI ESG Leaders Index guide institutional investors.
Trend 4: Technology & ESG Data
AI, blockchain, and big data help assess ESG scores more transparently.
ESG rating agencies (MSCI, Sustainalytics, Refinitiv) play a growing role.
Trend 5: Green Bonds & Sustainable Financing
Green bonds (funds raised for eco-projects) have surpassed $2 trillion issuance globally.
Social bonds and sustainability-linked loans are also gaining traction.
5. ESG in India: The Emerging Market Story
India, as one of the fastest-growing economies, is experiencing its own ESG wave.
Regulation: SEBI (Securities and Exchange Board of India) has mandated the Business Responsibility and Sustainability Report (BRSR) for top listed companies.
Investor Demand: Indian mutual funds are launching ESG-focused schemes.
Corporate Adoption: Firms like Infosys, Tata, and Wipro are global ESG leaders.
Green Finance: India issued its first sovereign green bonds in 2023.
Challenges in India:
Lack of standardized ESG reporting.
Limited awareness among retail investors.
Trade-off between growth and sustainability in a developing economy.
6. Sectoral ESG Trends
1. Energy
Fossil fuels are being replaced with renewables.
Oil & gas companies are investing in carbon capture.
2. Technology
Big tech faces scrutiny on data privacy and energy usage in data centers.
Tech firms lead in transparency reporting.
3. Banking & Finance
Banks integrate ESG into lending decisions.
Green finance and ESG loans are rising.
4. Healthcare & Pharma
Focus on ethical drug pricing, access to healthcare, and sustainable production.
5. Manufacturing
Supply chain sustainability is a big issue.
ESG compliance is crucial for exports.
7. Benefits of ESG Investing
Risk Management – ESG factors identify hidden risks (climate lawsuits, governance failures).
Long-Term Returns – ESG-compliant firms often outperform peers over the long run.
Investor Confidence – Transparency builds trust with stakeholders.
Competitive Advantage – Sustainable firms attract better talent and customers.
Global Alignment – Aligns with SDGs (UN Sustainable Development Goals).
8. Challenges in ESG Investing
Greenwashing – Companies exaggerate or falsely claim ESG compliance.
Data Inconsistency – ESG ratings differ widely across agencies.
Short-Term Costs – ESG transition requires heavy investments.
Lack of Awareness – Many retail investors still prioritize quick profits.
Policy Differences – No uniform global ESG standard.
9. Future of ESG & Sustainability Investing
Prediction 1: Stricter Regulations
Governments worldwide will enforce mandatory ESG disclosures.
Prediction 2: ESG in Emerging Markets
India, China, Brazil, and Africa will see exponential ESG adoption.
Prediction 3: Integration with Technology
AI-driven ESG scoring, blockchain-based supply chain tracking, and carbon credit markets will become mainstream.
Prediction 4: Mainstream Adoption
In the near future, ESG will not be a separate category—it will be the default way of investing.
Prediction 5: Retail ESG Investing
Just like mutual funds became mainstream, ESG-focused products will attract retail participation in India and abroad.
10. Practical Guide: How to Invest in ESG
Mutual Funds & ETFs – Invest in ESG-themed funds.
Direct Stocks – Pick companies with strong ESG ratings.
Green Bonds – Support eco-projects while earning fixed returns.
Thematic Portfolios – Build portfolios around sustainability themes (renewables, EVs, water management).
Due Diligence – Verify ESG claims; avoid greenwashing traps.
Conclusion
Sustainability & ESG investing is not a passing fad—it’s a megatrend shaping the future of finance. The world is moving towards a system where profit and purpose must co-exist.
For investors, this means:
ESG is becoming a risk management tool.
ESG compliance improves long-term performance.
Early adopters stand to benefit from the global shift in capital flows.
India, being at the cusp of massive economic growth, is perfectly positioned to ride the ESG wave. The government’s push for clean energy, digital governance, and responsible corporate practices will only accelerate this trend.
In short, the future of investing is sustainable investing. Capital is no longer blind; it is conscious, responsible, and forward-looking.
