Bearish ADA/USD Trade Idea: Downtrend Continues1. Market Analysis:
The ADA/USD pair is currently in a strong downtrend. A downward-sloping resistance line is clearly visible, highlighting the continuing pressure on price. The pattern forming is a descending triangle, which is typically a bearish signal when the price breaks below the lower support level.
2. Entry Point:
Our entry point is at 0.8292. This is based on the price action within the triangle pattern, as the market is struggling to break the resistance and is testing the lower boundary multiple times. A breakdown below this level is anticipated, continuing the bearish momentum.
3. Stop Loss:
The stop loss is set at 0.88768. This level represents a recent swing high within the triangle pattern. If price moves back above this level, the trend reversal could be signaled, so it’s crucial to manage risk with this stop.
4. Target:
The target price is set at 0.74165. This is a key support area, previously tested, and the price action indicates that it could act as the next major level of demand. This aligns with our trade objective of riding the trend toward the next significant support.
5. Rationale:
The descending triangle is a bearish continuation pattern, and the breakout below the lower support confirms the downtrend.
Volume has been decreasing as the price approaches the triangle's apex, a common sign that the market is getting ready for a breakout.
The overall trend is bearish, and this setup aligns with the prevailing market sentiment.
6. Conclusion:
This trade idea is based on a well-formed technical pattern, with clear entry, stop loss, and target levels. By entering at 0.8292, setting a stop loss at 0.88768, and targeting 0.74165, we are positioning ourselves to profit from the continuation of the current downtrend in ADA/USD.
Make sure to monitor price action closely, as any deviation from the expected pattern might require adjustments to the trade.
Cryptomarket

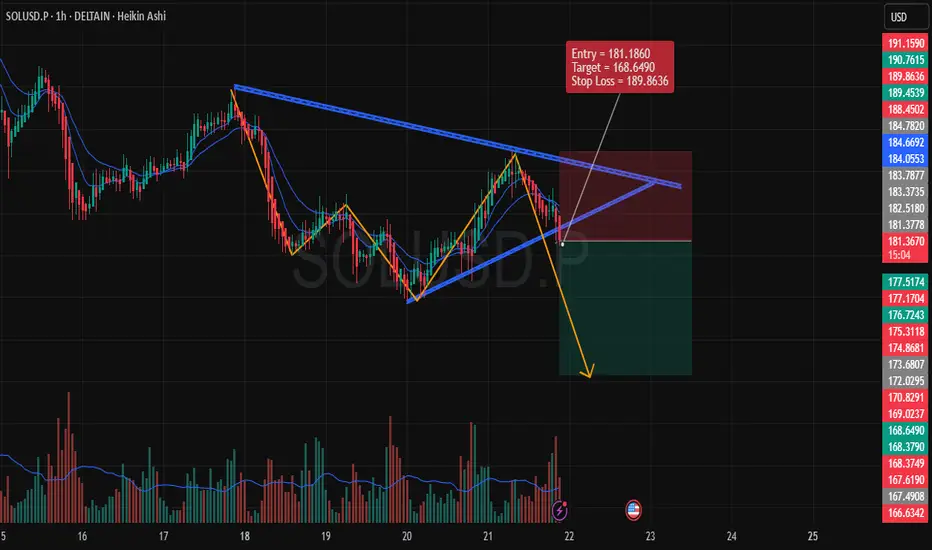
Bearish Setup on SOLUSD (1-Hour Time Frame)Entry Price: 181.1860
Target: 168.6490
Stop Loss (SL): 189.8636
1. Chart Analysis
We are observing a descending triangle pattern formation, which generally signals a bearish continuation once the price breaks downward.
The price action has already shown signs of rejection at the upper boundary of the pattern, reinforcing the possibility of a breakout to the downside.
2. Indicators & Confirmation
Volume Analysis: Noticeable spike in volume during the recent downward movement, which indicates strong selling pressure. This is crucial for confirming the potential bearish trend.
EMA Confluence: The price is below the 9 and 20 EMAs, which are crucial indicators of the current market trend. The EMAs are acting as dynamic resistance, further supporting the bearish scenario.
3. Risk Management
The stop loss is placed above the most recent significant high at 189.8636. This placement ensures that we protect against any false breakouts or short-term price reversals.
The target at 168.6490 is derived based on previous support levels and a measured move from the triangle pattern. This target is realistic given the market structure.
4. Price Action
The price action shows lower highs and lower lows, a typical characteristic of a downtrend. If this pattern holds, the next logical price move is to break downward through the support of the triangle.
5. Conclusion
Overall, this setup provides a solid bearish opportunity, backed by technical patterns and strong momentum indicators. The risk-to-reward ratio is favorable, making it a well-structured trade.
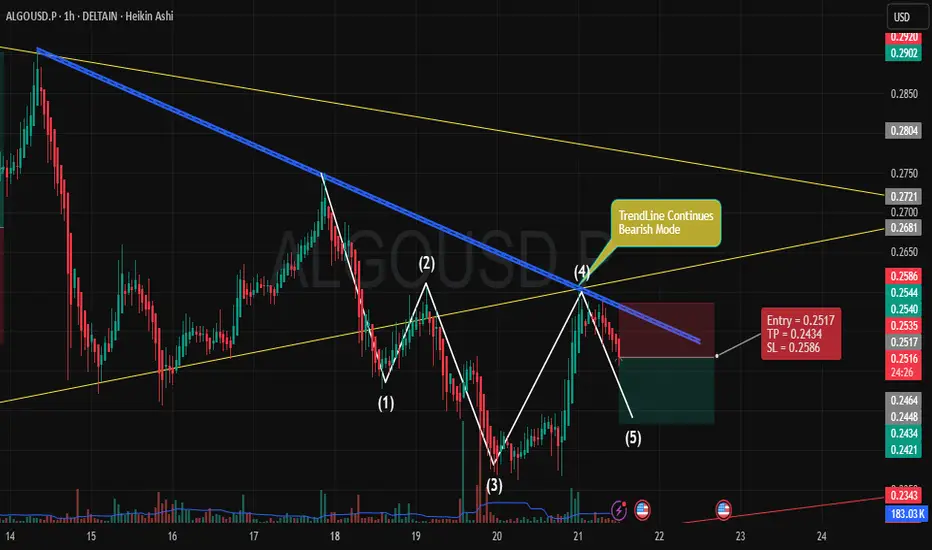
Bearish Continuation for ALGOUSD** IF you like my observation, please boost and follow for more content."
Trade Overview:
Entry: 0.2517
Stop Loss (SL): 0.2586
Take Profit (TP): 0.2434
Key Points:
Trend Analysis:
The price is currently under a bearish trend as indicated by the downward sloping blue trendline. This trendline shows consistent resistance, rejecting price rallies and continuing the bearish bias.
The yellow trendlines represent key support and resistance zones, highlighting the consolidation range where the price has been fluctuating within a defined pattern.
Market Structure:
Price has formed a lower high (marked as point 4), followed by a lower low (point 5), confirming the continuation of the downtrend. This suggests that the market is likely to keep pushing lower towards the target.
The price has retraced upwards but has failed to break the bearish trendline, reinforcing the idea of further downside potential.
Entry Strategy:
Entry Point: We are entering at 0.2517, just below the recent resistance, anticipating the price to continue downward after failing to breach the trendline.
The price action at point (4) suggests weakness in the upward movement, making this a prime opportunity to capitalize on further downside movement.
Risk-Reward Setup:
The Stop Loss is set at 0.2586, just above the last swing high, giving room for minor retracements while protecting against a breakout above the trendline.
The Take Profit is set at 0.2434, targeting the next level of support where the price could potentially find buying interest. This gives a favorable Risk-Reward Ratio of about 2:1.
Volume Confirmation:
Notice the increase in volume during the downward movement, suggesting that sellers are in control. A drop in volume during price retracements further validates the weak bullish momentum and confirms the expected continuation to the downside.
Why This Setup?
The bearish trend, price action, and trendline rejection all align with a continuation trade setup.
The risk-reward is favorable, with a clear structure to exit the trade if the price moves against the position.
The broader market context is also in line with a bearish outlook, making this a high-probability trade setup for the next few hours.
XRP/USD Trade Setup: Bearish Position on Technical AnalysisTimeframe: 1 Hour
Entry Price: 3.0229
Take Profit (TP): 2.8769
Stop Loss (SL): 3.1199
1. Market Overview
XRP is currently in a bearish phase, and the price action indicates that a downward continuation is likely. The market has been rejecting higher levels, with strong resistance at the 3.1777 zone, and now the price appears to be moving lower.
2. Entry Criteria:
The entry point is set at 3.0229, just below the current price level, where we anticipate the market to continue its downward movement after facing resistance at higher levels.
The recent price action shows a clear rejection from the upside, and we are expecting further downside once the price breaks below the immediate support near the entry.
3. Technical Indicators:
Heikin Ashi Candles: The chart uses Heikin Ashi candles, which help smooth the price action. The red candles indicate a bearish sentiment, confirming the continuation of downward pressure.
Volume Analysis: The increase in volume during the recent selling phase is confirming that the bears are in control and the trend may continue to the downside.
4. Support & Resistance Levels:
Resistance: The price is facing resistance around 3.1777, which has proven to be a significant level of rejection.
Support: The main support zone is located near the 2.8769 level, which coincides with our take profit (TP). This is a logical target as it aligns with previous lower levels and current trend structure.
5. Risk-Reward Ratio:
The Stop Loss is placed at 3.1199, just above the recent swing highs and resistance level, ensuring we limit risk in case of a market reversal.
The Take Profit is set at 2.8769, offering a solid risk-reward ratio of 1:1.5. This level is where we expect the price to find support and potentially reverse after hitting the target.
6. Trade Management:
Monitor Resistance Level: If the price fails to break below the entry and starts moving upward, consider adjusting the stop loss or exiting the position to limit losses.
Trailing Stop: Once the price starts moving in your favor, consider implementing a trailing stop to lock in profits as the price moves lower.
7. Potential Risks:
False Breakdown: A false breakdown is always a risk, where the price could temporarily dip below the support and reverse, hitting the stop loss before continuing lower.
Market Volatility: Be mindful of the inherent volatility in the crypto market, which can lead to sudden reversals due to news or other external factors.
8. Conclusion:
This trade setup is based on a bearish market structure, where price is showing clear resistance and the potential for further downward movement. The setup is logical with a strong risk-reward ratio and a clear target for profits. As always, risk management is crucial, and it's important to monitor price action closely for any signs of reversal.
Good luck, and trade carefully!

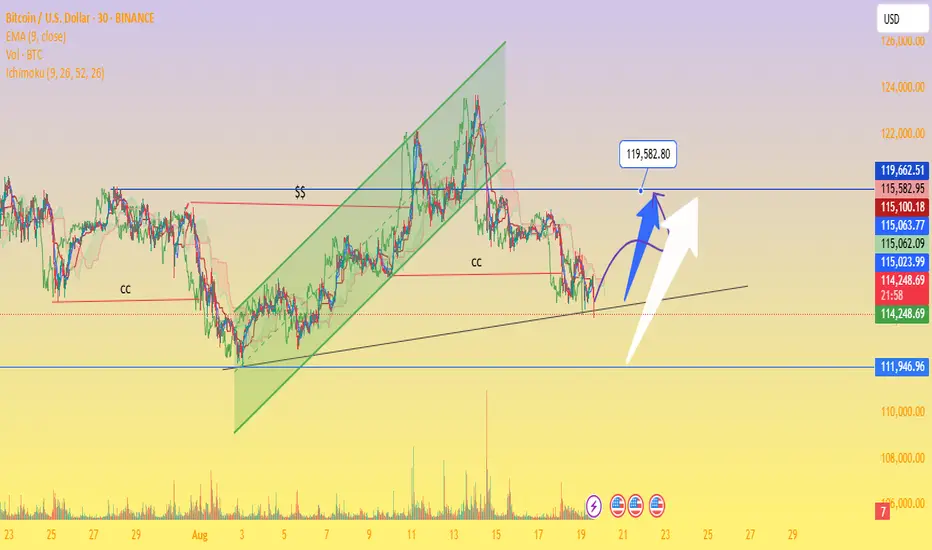
Bitcoin at a Critical Support – Breakout Toward $119K or ?Ascending Channel Breakdown – Price previously respected a rising green channel but broke below, showing weakness.
Critical Support Zone: Around $111,946 – $114,000 (black trendline + yellow support area).
Resistance Levels:
Near-term: $115,100 – $115,582
Strong: $119,582 (highlighted as major upside target)
Volume Profile: Declining volume with recent dip → signals possible accumulation before the next move.
Ichimoku Cloud: Price is slightly below cloud, indicating short-term bearish bias but with potential rebound if reclaimed.
Scenarios:
Bullish Case (Blue/White Arrows): If BTC holds above $114,000 support and breaks $115,500, a rally toward $119,500+ is possible.
Bearish Case: Failure to hold $114,000 may trigger a drop toward $111,946 (major demand zone).
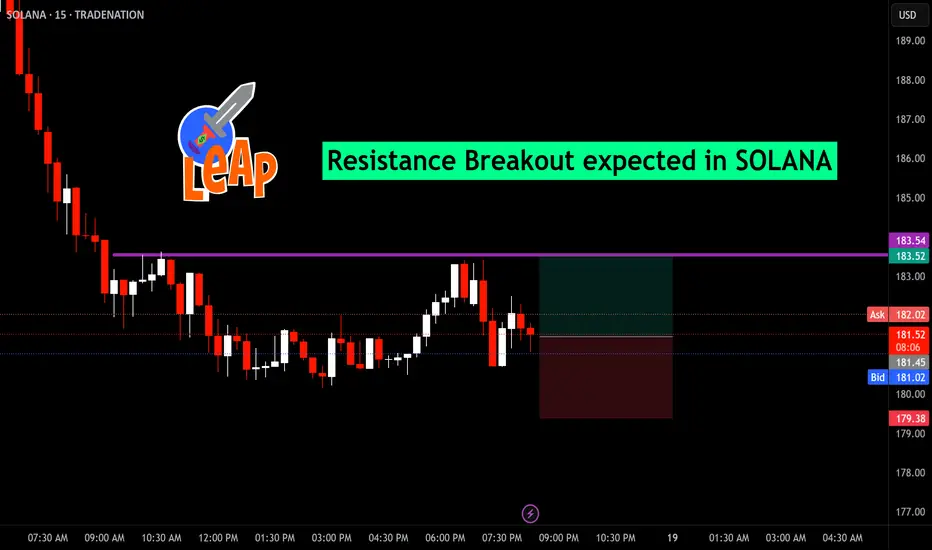
Resistance Breakout expected in SOLANASOLANA Resistance Breakout Alert!
This chart highlights a key trading opportunity in Solana (SOL) on the 15-minute timeframe. After a sustained downward trend, the price is currently consolidating near a significant resistance level at $183.54, marked by the purple horizontal line.
Current Price Action: SOLANA is fluctuating between $179.38 and $182.07, with buyers and sellers locking horns just below resistance.
Breakout Potential: A close above $183.54 (purple line) could trigger bullish momentum and potentially lead to a LEAP in price action.
Trade Setup: Watch for a confirmed breakout above resistance for entry. Target zones and risk management can be visualized on the chart’s green/red areas.
Sustainability & ESG Investing TrendsIntroduction
Over the past two decades, the financial world has experienced a massive transformation in how investments are analyzed, structured, and valued. Traditional investment strategies focused almost exclusively on financial metrics such as revenue growth, earnings per share, P/E ratios, and cash flows. But today, a new dimension has been added: Sustainability and ESG (Environmental, Social, and Governance) investing.
Investors, institutions, governments, and even retail traders are no longer looking at financial returns in isolation. They are increasingly asking:
Is this company environmentally responsible?
How does it treat its employees and communities?
Are its governance practices transparent and ethical?
This movement is more than just a trend—it represents a structural shift in how capital is allocated globally. Sustainability and ESG investing is about aligning profits with purpose. It’s about creating wealth while ensuring that companies contribute positively to society and the planet.
In this article, we’ll explore the evolution, importance, drivers, challenges, and future of sustainability & ESG investing trends, breaking it down in an easy-to-understand and comprehensive way.
1. Understanding Sustainability & ESG
What is Sustainability Investing?
Sustainability investing refers to investment strategies that prioritize companies or assets contributing to long-term environmental and social well-being. Instead of short-term financial gains, the focus is on sustainable value creation.
What is ESG Investing?
ESG stands for:
Environmental – How a company manages its environmental impact (climate change, carbon footprint, renewable energy use, waste management).
Social – How a company treats people (employees, customers, communities, human rights).
Governance – How a company is managed (board structure, executive pay, transparency, shareholder rights).
An ESG-focused investor doesn’t just look at profit margins—they also ask: Is this company ethical? Is it sustainable in the long run?
Why ESG Matters
Climate change is now a financial risk.
Consumers prefer sustainable brands.
Regulators demand transparency.
Younger investors want purpose-driven investments.
2. Evolution of ESG & Sustainability Investing
Early Stage (1960s–1980s)
The origins can be traced back to socially responsible investing (SRI), where investors avoided “sin stocks” (alcohol, tobacco, gambling, weapons).
Religious and ethical considerations played a big role.
Growth Stage (1990s–2000s)
The 1990s saw globalization and rising awareness about corporate social responsibility.
Companies began publishing sustainability reports.
The UN launched initiatives like the Principles for Responsible Investment (PRI) in 2006.
Modern Stage (2010s–2020s)
Climate change, global warming, and social justice movements accelerated ESG awareness.
The Paris Climate Agreement (2015) reinforced global commitments to sustainability.
ESG assets under management (AUM) skyrocketed to $40+ trillion globally by 2025.
3. Key Drivers of ESG & Sustainability Investing
Climate Risks – Extreme weather, rising sea levels, and resource scarcity directly affect business operations and valuations.
Consumer Preferences – Millennials and Gen Z prefer eco-friendly and socially conscious brands.
Regulations & Policies – Governments mandate disclosures (EU’s SFDR, India’s BRSR, SEC proposals in the US).
Capital Flows – Global funds and pension plans increasingly allocate capital based on ESG scores.
Corporate Reputation – Companies with poor ESG practices face backlash, loss of trust, and higher costs.
4. Global ESG Investment Trends
Trend 1: Surge in ESG Assets
As of 2025, global ESG assets are projected to cross $50 trillion, representing nearly a third of total AUM worldwide.
Europe leads the charge, followed by North America and Asia.
Trend 2: Renewable Energy Boom
Solar, wind, and green hydrogen projects attract heavy investments.
Fossil fuel divestment is accelerating.
Trend 3: ESG ETFs & Index Funds
ESG-focused exchange-traded funds (ETFs) have exploded in popularity.
Major indices like the MSCI ESG Leaders Index guide institutional investors.
Trend 4: Technology & ESG Data
AI, blockchain, and big data help assess ESG scores more transparently.
ESG rating agencies (MSCI, Sustainalytics, Refinitiv) play a growing role.
Trend 5: Green Bonds & Sustainable Financing
Green bonds (funds raised for eco-projects) have surpassed $2 trillion issuance globally.
Social bonds and sustainability-linked loans are also gaining traction.
5. ESG in India: The Emerging Market Story
India, as one of the fastest-growing economies, is experiencing its own ESG wave.
Regulation: SEBI (Securities and Exchange Board of India) has mandated the Business Responsibility and Sustainability Report (BRSR) for top listed companies.
Investor Demand: Indian mutual funds are launching ESG-focused schemes.
Corporate Adoption: Firms like Infosys, Tata, and Wipro are global ESG leaders.
Green Finance: India issued its first sovereign green bonds in 2023.
Challenges in India:
Lack of standardized ESG reporting.
Limited awareness among retail investors.
Trade-off between growth and sustainability in a developing economy.
6. Sectoral ESG Trends
1. Energy
Fossil fuels are being replaced with renewables.
Oil & gas companies are investing in carbon capture.
2. Technology
Big tech faces scrutiny on data privacy and energy usage in data centers.
Tech firms lead in transparency reporting.
3. Banking & Finance
Banks integrate ESG into lending decisions.
Green finance and ESG loans are rising.
4. Healthcare & Pharma
Focus on ethical drug pricing, access to healthcare, and sustainable production.
5. Manufacturing
Supply chain sustainability is a big issue.
ESG compliance is crucial for exports.
7. Benefits of ESG Investing
Risk Management – ESG factors identify hidden risks (climate lawsuits, governance failures).
Long-Term Returns – ESG-compliant firms often outperform peers over the long run.
Investor Confidence – Transparency builds trust with stakeholders.
Competitive Advantage – Sustainable firms attract better talent and customers.
Global Alignment – Aligns with SDGs (UN Sustainable Development Goals).
8. Challenges in ESG Investing
Greenwashing – Companies exaggerate or falsely claim ESG compliance.
Data Inconsistency – ESG ratings differ widely across agencies.
Short-Term Costs – ESG transition requires heavy investments.
Lack of Awareness – Many retail investors still prioritize quick profits.
Policy Differences – No uniform global ESG standard.
9. Future of ESG & Sustainability Investing
Prediction 1: Stricter Regulations
Governments worldwide will enforce mandatory ESG disclosures.
Prediction 2: ESG in Emerging Markets
India, China, Brazil, and Africa will see exponential ESG adoption.
Prediction 3: Integration with Technology
AI-driven ESG scoring, blockchain-based supply chain tracking, and carbon credit markets will become mainstream.
Prediction 4: Mainstream Adoption
In the near future, ESG will not be a separate category—it will be the default way of investing.
Prediction 5: Retail ESG Investing
Just like mutual funds became mainstream, ESG-focused products will attract retail participation in India and abroad.
10. Practical Guide: How to Invest in ESG
Mutual Funds & ETFs – Invest in ESG-themed funds.
Direct Stocks – Pick companies with strong ESG ratings.
Green Bonds – Support eco-projects while earning fixed returns.
Thematic Portfolios – Build portfolios around sustainability themes (renewables, EVs, water management).
Due Diligence – Verify ESG claims; avoid greenwashing traps.
Conclusion
Sustainability & ESG investing is not a passing fad—it’s a megatrend shaping the future of finance. The world is moving towards a system where profit and purpose must co-exist.
For investors, this means:
ESG is becoming a risk management tool.
ESG compliance improves long-term performance.
Early adopters stand to benefit from the global shift in capital flows.
India, being at the cusp of massive economic growth, is perfectly positioned to ride the ESG wave. The government’s push for clean energy, digital governance, and responsible corporate practices will only accelerate this trend.
In short, the future of investing is sustainable investing. Capital is no longer blind; it is conscious, responsible, and forward-looking.

How Pros Plan Their Trades (Before Entering the Market)Introduction
In trading, the difference between professionals and amateurs doesn’t lie in who can predict the future—no one can—but in how they plan their trades before entering the market. Professionals treat trading like a business. Every position is carefully designed, risk is pre-calculated, and contingencies are set in advance. They know that planning is where the real “edge” lies, not in gut feelings or random speculation.
This article will explore how professional traders plan their trades—step by step—covering everything from market analysis, risk management, and entry/exit strategies, to psychology and record-keeping.
1. The Foundation: Trading Philosophy & Edge
Before professionals even open their charts, they have a trading philosophy that guides all their decisions. This philosophy is built around an edge—a repeatable method that provides higher probability setups over time.
Clarity of Method: A pro doesn’t jump between indicators or strategies every week. They master one or two setups and refine them.
Edge Definition: For some, the edge lies in volume profile analysis; for others, it’s price action, options strategies, or mean reversion.
Statistical Advantage: The edge doesn’t guarantee every trade wins, but over a large number of trades, it produces consistent results.
Example:
A price-action trader may specialize in breakouts with volume confirmation. They won’t trade anything that doesn’t fit this mold.
2. Pre-Market Preparation
Planning begins before the market opens. Professionals treat this like a pilot’s pre-flight checklist.
a) Economic Calendar
Check scheduled news: Fed meetings, RBI policies, inflation data, corporate earnings.
Avoid entering trades right before high-impact events unless news trading is part of the strategy.
b) Global Market Overview
Review overnight moves in U.S., European, and Asian markets.
Check GIFT Nifty, Dow futures, crude oil, bond yields, and currency moves.
These set the tone for local market sentiment.
c) Sectoral & Stock Scanning
Identify which sectors are strong or weak (banks, IT, energy, etc.).
Spot stocks near breakout levels or with unusual volume.
d) Mental Readiness
Professionals ensure they are calm, rested, and focused. Emotional imbalance leads to poor execution.
3. Trade Idea Generation
Once the groundwork is done, pros filter potential trades. They don’t chase random moves—they prepare a watchlist of high-probability setups.
a) Technical Analysis
Chart patterns: breakouts, pullbacks, double bottoms/tops.
Volume confirmation: rising volume on entry levels.
Key levels: support, resistance, moving averages, VWAP.
b) Fundamental Catalysts
Earnings beats/misses.
Mergers, acquisitions, product launches.
Policy changes or macro triggers.
c) Market Structure & Order Flow
Pros often use volume profile, order book, and liquidity zones to identify where big players are positioned.
Result: By this stage, they’ve shortlisted 2–5 potential trades for the session.
4. Defining the Trade Setup
A trade idea becomes a planned trade only when every detail is defined before entry.
a) Entry Criteria
Exact price level (e.g., breakout above ₹1,200).
Conditions (e.g., must have 20% higher-than-average volume).
Confirmation (e.g., wait for candle close above resistance).
b) Stop-Loss Placement
Always defined before entering.
Logical placement: below support, ATR-based, or volatility-adjusted.
Never random points.
c) Position Sizing
Based on risk management, not emotions.
Example: If risking 1% of capital per trade, calculate lot size accordingly.
d) Profit Target / Exit Plan
Define take-profit levels (e.g., risk-reward ratio of 1:3).
Partial exits if momentum slows.
Trail stop-loss as trade moves in favor.
5. Risk Management Blueprint
Professionals survive because they respect risk more than reward.
a) Risk per Trade
Usually 0.5%–2% of capital per trade.
Keeps account safe from drawdowns.
b) Risk-Reward Ratio
Minimum 1:2 or 1:3 setups.
If the target doesn’t justify the risk, they skip the trade.
c) Diversification & Correlation
Avoid overexposure in the same sector or correlated instruments.
d) Daily/Weekly Loss Limits
If daily loss exceeds a certain limit, they stop trading.
This prevents emotional revenge trading.
6. Psychological Preparation
Even the best plan fails if emotions take over. Pros prepare mentally before entry.
a) Neutral Mindset
They don’t “hope” or “fear”—they execute.
Losing trades are accepted as part of the game.
b) Visualization
Before entry, they visualize both winning and losing scenarios.
This avoids shock when markets move against them.
c) Detachment
They trade the setup, not the money.
Focus remains on following the process.
7. Executing the Plan
Once the trade is planned, execution is mechanical.
Place stop-loss immediately after entry.
Set alerts for key price levels.
Stick to the plan—no impulsive changes.
Golden Rule: Professionals never enter a trade without knowing exactly:
Why they’re entering.
Where they’ll exit if wrong.
Where they’ll exit if right.
8. Trade Review & Journaling
Planning doesn’t stop after entry or exit—it extends into review.
a) Journaling
Every trade is recorded: entry, exit, rationale, screenshots.
Notes on psychology (“I felt anxious”, “I overtraded”).
b) Performance Analysis
Weekly/monthly reviews of win rate, risk-reward, mistakes.
Identify which setups work best.
Eliminate low-probability trades.
c) Continuous Improvement
Plans evolve as the trader grows.
Strategies are refined based on data, not feelings.
9. Example of a Professional Trade Plan
Stock: Infosys (NSE)
Trade Idea: Breakout above ₹1,650 resistance.
Entry Criteria: Enter long only if price closes above ₹1,650 with 1.5x average volume.
Stop-Loss: ₹1,620 (below nearest support).
Target 1: ₹1,700 (partial booking).
Target 2: ₹1,750 (full exit).
Risk-Reward: 1:3.
Position Size: 1% risk of capital.
Exit Plan: Trail stop-loss after ₹1,700 is hit.
Notes: Avoid entry if global markets are negative.
This is how pros pre-define everything before touching the buy/sell button.
10. Common Mistakes Amateurs Make (That Pros Avoid)
Entering without stop-loss.
Trading based on tips or news without analysis.
Risking too much capital on one trade.
Shifting stop-losses out of fear.
Overtrading without a plan.
11. The Professional Mindset
Ultimately, pros see trading as a business of probabilities. Every trade is a bet with defined risk, like a casino operating with a statistical edge. They don’t need every trade to win—they just need consistency.
Discipline > Prediction.
Process > Outcome.
Risk Control > Profit Hunting.
Conclusion
Professional traders don’t enter the market blindly. Every move is backed by preparation, structured planning, and strict risk control. They design trades like an architect draws blueprints—nothing is left to chance.
For aspiring traders, the lesson is clear: spend more time planning your trades than placing them.
Planning is where pros win the game—execution is just following the script.

Sectoral Rotation in Indian MarketsIntroduction
Stock markets do not move in a straight line. They rotate, shift, and evolve as capital flows from one sector to another. This process is known as Sectoral Rotation or Sector Rotation Strategy. In simple terms, it refers to the shifting of investor money between different sectors of the economy based on economic cycles, market conditions, earnings growth, valuations, and investor sentiment.
In the Indian context, sectoral rotation has played a critical role in shaping long-term and short-term trends in the equity markets. Investors who understand these shifts are able to ride the strongest sectors at the right time, while avoiding underperforming ones. For traders, it becomes an important framework for momentum-based opportunities, while for long-term investors it ensures capital allocation towards sectors that align with the broader economic growth trajectory.
This article explores Sectoral Rotation in Indian Markets in detail — covering its meaning, drivers, historical examples, market cycles, role of FIIs/DIIs, strategies for traders and investors, and practical applications with Indian market examples.
1. What is Sectoral Rotation?
Sectoral Rotation is the process of shifting investments across different sectors as per changing economic, business, and market cycles. Instead of sticking with one industry, investors diversify their portfolios by actively moving into sectors expected to outperform in the coming phase.
For example:
During an economic boom, cyclical sectors like Banking, Automobiles, Realty, Capital Goods, and Metals tend to perform strongly.
During economic slowdown, defensive sectors like FMCG, IT, Pharma, and Utilities gain traction.
This flow of capital leads to outperformance of certain indices (like Nifty Bank, Nifty IT, Nifty Pharma, etc.) while others underperform — creating opportunities for strategic investors.
2. Why Does Sectoral Rotation Happen?
Sectoral rotation is driven by a variety of factors, including:
Economic Cycles:
Different sectors perform better in different stages of the economic cycle (expansion, peak, contraction, recovery).
Interest Rate Movements:
Rising interest rates benefit banks but hurt rate-sensitive sectors like real estate and autos.
Government Policies:
Budget announcements, reforms, and subsidies can trigger sectoral shifts (e.g., PLI schemes benefiting manufacturing).
Commodity Prices:
Metals, energy, and oil & gas sectors are heavily dependent on global commodity trends.
Global Trends:
Export-oriented sectors like IT and Pharma benefit from global demand and currency fluctuations.
FII/DII Flows:
Institutional investors often rotate between sectors depending on valuation and global risk appetite.
3. The Sectoral Rotation Model
Globally, the Sector Rotation Model links stock market performance with the economic cycle. It divides the economy into four stages:
Early Recovery (Post Recession):
Interest rates are low, liquidity is high, consumer demand picks up.
Leading Sectors: Banking, Automobiles, Realty, Capital Goods.
Mid Expansion:
Economy is growing strongly, corporate profits rise, industrial activity increases.
Leading Sectors: Infrastructure, Metals, Cement, Oil & Gas.
Late Expansion / Peak:
Inflation rises, interest rates start climbing, valuations peak.
Leading Sectors: IT, Pharma, FMCG (defensives start gaining traction).
Slowdown / Recession:
Growth slows, demand weakens, companies cut capex.
Leading Sectors: FMCG, Pharma, Utilities, IT (safe havens).
This cycle repeats, with money rotating back to cyclical sectors as recovery begins again.
4. Sectoral Rotation in Indian Context
India, being an emerging market, shows sharper sectoral rotation compared to developed economies. This is because:
Economic growth is uneven and policy-driven.
Certain sectors like IT, Pharma, Banking, FMCG, Auto, Metals, Realty, and Energy dominate Nifty indices.
Domestic consumption patterns and global macro factors play equally important roles.
Historical Examples:
IT Boom (1998–2000):
Indian IT companies like Infosys, Wipro, and TCS surged as the dot-com boom created demand for outsourcing.
Infrastructure & Realty Rally (2003–2008):
Banks, Realty, and Infra led the market during the high-growth phase before the 2008 crisis.
Pharma & FMCG (2009–2014):
Post-crisis slowdown saw defensives outperform while cyclical sectors lagged.
Banking & Financials (2014–2018):
Economic reforms, GST, and demonetization boosted BFSI stocks.
IT & Pharma Revival (2020–2022):
Pandemic-driven digitization and healthcare demand led IT and Pharma to outperform.
Manufacturing & Capital Goods (2023–2025):
Government’s infrastructure push and PLI schemes have shifted focus to industrials, railways, and defense.
5. Key Sectors in Indian Markets
The Indian stock market is structured around sectoral indices like:
Nifty Bank – Banking & Financial Services.
Nifty IT – IT services and software.
Nifty Pharma – Pharmaceutical companies.
Nifty FMCG – Consumer goods companies.
Nifty Auto – Automobile manufacturers.
Nifty Metal – Steel, aluminium, and other metal producers.
Nifty Realty – Real estate developers.
Nifty Energy – Oil, Gas, Power companies.
Nifty Infra – Infrastructure and capital goods companies.
Each of these indices becomes the leader or laggard depending on where we are in the economic cycle.
6. Sectoral Rotation and FIIs/DIIs
Foreign Institutional Investors (FIIs) and Domestic Institutional Investors (DIIs) play a critical role in sectoral rotation.
FIIs: Generally prefer liquid, large-cap sectors like BFSI, IT, and Metals. They also rotate based on global risk appetite. For example, FIIs buy IT and Pharma when the rupee is weak, but they dump rate-sensitive sectors when US interest rates rise.
DIIs: Focus more on domestic growth themes like FMCG, Realty, and Infrastructure. Their buying often balances FII outflows, and they rotate based on domestic demand and government policy support.
7. Identifying Sectoral Rotation in Practice
How can investors spot sectoral rotation? Some methods include:
Relative Strength (RS) Analysis:
Compare sectoral indices against Nifty 50 to see which are outperforming.
Moving Averages & Price Action:
Sectors crossing above 200-DMA often lead broader rallies.
Volume Profile & Market Structure:
Rising volumes in specific sectoral stocks indicate accumulation.
Fund Flows Data:
Track FII/Mutual Fund sector-wise allocation.
Macro Indicators:
Rising interest rates = Banks gain.
Falling crude oil = Autos and FMCG benefit.
Weak rupee = IT & Pharma benefit.
8. Trading & Investing Strategies Based on Sectoral Rotation
For Traders:
Trade sector leaders (stocks showing highest strength in the leading sector).
Use momentum strategies in outperforming sectors.
Rotate capital quickly as leadership shifts.
For Investors:
Allocate more capital to sectors aligned with the current economic phase.
Balance cyclical and defensive exposure.
Use staggered investment to manage risks during transitions.
9. Risks in Sectoral Rotation
Timing Risk: Entering late in the cycle can result in losses.
Policy Risk: Sudden government regulations can disrupt sector performance (e.g., windfall tax on oil & gas).
Global Risk: Export-oriented sectors are vulnerable to global shocks.
Over-concentration: Shifting too much into one sector increases risk.
10. Future Outlook: Sectoral Rotation in India (2025 and Beyond)
Manufacturing & Capital Goods: Strong due to Make in India, infra push, and PLI schemes.
Banking & Financials: Likely to remain strong with credit growth and economic expansion.
IT Services: Stable growth with AI, cloud, and global outsourcing.
Pharma & Healthcare: Structural demand from aging population and exports.
Green Energy & EVs: Long-term winners from sustainability push.
Consumer Discretionary (Auto, FMCG): Linked to rising middle-class income.
Conclusion
Sectoral Rotation is one of the most powerful investment frameworks in the Indian stock market. It reflects how money moves across industries as per changing economic, policy, and market conditions. For traders, it provides momentum opportunities, while for investors, it offers a disciplined way to allocate capital towards growth sectors while minimizing exposure to laggards.
From the IT boom of the 2000s to the Infrastructure push of the 2020s, India’s market history is filled with examples of sectoral shifts. Understanding these patterns not only helps in outperforming the market but also ensures that investors are aligned with the larger economic story of India’s growth.

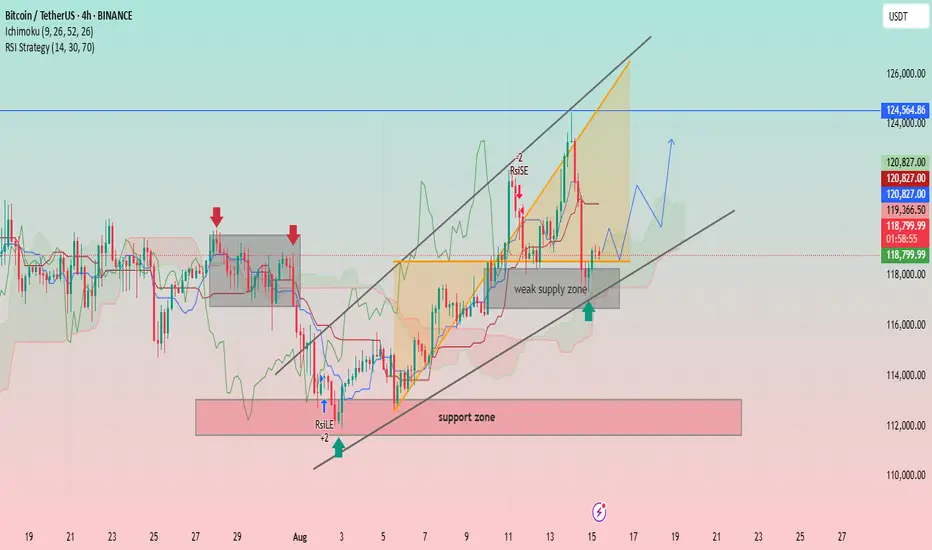
BTC/USDT: Bullish Momentum and Key Support LevelsUptrend Channel: The price is trading within an ascending channel, denoted by two parallel black trendlines. This suggests a bullish trend is in play.
Support and Resistance:
A significant support zone is identified between approximately 112,000 and 114,000 USDT.
A weak supply zone is marked around 118,000 USDT. The price has recently tested this area and found some support.
A strong resistance level is visible at approximately 124,564.86 USDT.
Indicators:
Ichimoku Cloud (9, 26, 52, 26): The price is currently trading above the cloud, indicating a bullish sentiment. The cloud itself appears to be thin and slightly bullish, suggesting potential for continued upward movement.
RSI Strategy (14, 30, 70): The Relative Strength Index (RSI) is used as a strategy, with a "RSILE" signal (likely "RSI Low Entry") marked with a "+2" and a red arrow, suggesting a potential buy signal near the support zone in early August. A "-2" signal is marked near the top of the channel, indicating a potential overbought condition or reversal signal.
Price Action and Projections:
The price recently experienced a sharp decline from the upper trendline, indicating profit-taking or resistance at that level.
The price is currently near the lower trendline and the "weak supply zone," which appears to be acting as support.
A potential future price path is drawn with a blue arrow, suggesting that the price may consolidate or bounce off the current support area and move higher towards the upper boundary of the channel.
Another potential path is drawn with a red arrow, showing a possible further drop towards the lower trendline before a bounce.
XRPUSDT Consolidation Within Ascending Support – The chart shows higher lows forming along an ascending trendline, suggesting underlying bullish pressure despite previous lower highs.
Price is currently consolidating inside a rectangle pattern (green zone), sitting above the key support near $2.98.
The red resistance zone around $3.57 is a major breakout point — a successful breach could lead to a strong bullish move.
The PPO indicator is showing a slight recovery from negative territory, indicating momentum is attempting to shift upward.
If price fails to break out, a retest of the ascending trendline or the grey demand zone below $3.00 could occur before the next attempt upward.
Overall, XRP is coiling for a breakout, with $3.57 as the key resistance to watch and $2.98 as critical support.

News & Event-Driven Trading1. Introduction
News & Event-Driven Trading is one of the most dynamic and high-impact trading approaches in financial markets. Unlike purely technical strategies that rely on chart patterns and indicators, this style focuses on real-time events, economic announcements, and breaking news to predict price movements.
In essence, traders act upon the information edge—anticipating or reacting to how markets will digest new developments.
Why is it so powerful?
Because markets are fueled by information—whether it’s an interest rate cut by the Federal Reserve, a company’s blockbuster earnings, a merger announcement, a geopolitical crisis, or even a sudden tweet from a CEO.
This style is especially appealing to:
Intraday traders who want volatility and quick opportunities.
Swing traders who hold positions for days or weeks around major events.
Institutional traders who exploit news faster with algorithmic systems.
2. The Core Concept
The main idea is information leads to reaction:
News breaks (planned or unplanned).
Market reacts with volatility and price changes.
Traders position themselves before, during, or after the event to capture profits.
There are three main approaches:
Anticipatory trading (before the news).
Reactive trading (immediately after the news).
Post-news trend trading (riding the sustained move after initial reaction).
3. Types of News & Events That Move Markets
Event-driven traders focus on market-moving catalysts. Here’s a breakdown:
A. Economic Data Releases
These are scheduled and predictable in timing (though not in outcome). Examples:
Interest Rate Decisions (Federal Reserve, RBI, ECB, etc.)
Inflation Data (CPI, WPI, PPI)
Employment Reports (U.S. Non-Farm Payrolls, unemployment rate)
GDP Data
Manufacturing & Services PMIs
Consumer Confidence Index
Impact:
These can cause massive short-term volatility, especially in forex, bonds, and index futures.
B. Corporate News
Earnings Reports (quarterly or annual results).
Mergers & Acquisitions (buyouts, takeovers).
Product Launches or Failures.
Management Changes (CEO resignation/appointment).
Legal or Regulatory Actions (lawsuits, penalties).
Impact:
Stock-specific moves can be huge—often double-digit percentage changes within minutes.
C. Geopolitical Events
Wars or conflicts.
Terrorist attacks.
Diplomatic negotiations.
Trade agreements or sanctions.
Impact:
Often affects commodities (oil, gold), defense sector stocks, and safe-haven currencies like USD, JPY, CHF.
D. Natural Disasters
Earthquakes, hurricanes, floods, wildfires.
Pandemic outbreaks.
Impact:
Can disrupt supply chains, impact insurance companies, and create sudden commodity demand shifts.
E. Policy & Regulatory Changes
Tax reforms.
Environmental laws.
Banking regulations.
Crypto regulations.
Impact:
Sector-specific rallies or selloffs.
F. Market Sentiment Events
Analyst upgrades/downgrades.
Large insider buying/selling.
Activist investor announcements.
Impact:
Can cause quick speculative bursts in stock prices.
4. Approaches to News Trading
A. Pre-News Positioning
Traders predict the outcome of an event and position accordingly.
Example: Buying bank stocks before an expected interest rate hike.
Risk: If the prediction is wrong, losses can be immediate.
Pros: Potential for big gains if correct.
Cons: High risk due to uncertainty.
B. Immediate Reaction Trading
Traders act within seconds or minutes after news is released.
Requires fast execution, newsfeed access (Bloomberg, Reuters), or AI-driven alert systems.
Often used in high-frequency trading.
Pros: Quick profits from the first wave of volatility.
Cons: Slippage and fake-outs are common.
C. Post-News Trend Riding
Traders wait for the initial volatility to settle and then ride the sustained move.
Example: Waiting 15–30 minutes after a big earnings beat, then joining the trend as institutions pile in.
Pros: Lower whipsaw risk.
Cons: Misses the explosive early move.
5. Tools for News & Event-Driven Trading
Economic Calendars
Forex Factory, Investing.com, Trading Economics.
Shows event time, previous data, forecast, and actual result.
News Feeds
Bloomberg Terminal, Reuters, Dow Jones Newswires.
Paid services deliver breaking news seconds before it hits public media.
Social Media Monitoring
Twitter (now X) can break corporate and geopolitical news faster than mainstream outlets.
Earnings Calendars
MarketWatch, Nasdaq Earnings Calendar.
Volatility & Options Data
Implied volatility scans to detect expectations of big moves.
Charting & Trading Platforms
MetaTrader, TradingView, ThinkorSwim—integrated with live news alerts.
6. Key Strategies
A. Earnings Season Plays
Strategy: Buy call options if expecting a beat, buy puts if expecting a miss.
Watch pre-market or after-hours reaction.
B. Breakout on News
Identify key support/resistance before the event.
Trade breakout in direction of news-driven move.
C. Fading the News
If initial spike seems overdone, take opposite trade.
Works well on low-quality news or market overreaction.
D. Merger Arbitrage
Buy target company’s stock after acquisition news.
Short acquirer if market deems deal overpriced.
E. Macro Event Trading
Example: Buy gold ahead of expected geopolitical tensions.
7. Risk Management in News Trading
Volatility is a double-edged sword—profits can be huge, but so can losses.
Position Sizing – Never risk more than 1–2% of capital per trade.
Stop-Loss Orders – Place wider stops for volatile events.
Avoid Overleverage – Especially in forex and futures.
Event Filtering – Don’t trade every event; focus on high-impact ones.
Plan Scenarios – Have a plan for both positive and negative outcomes.
8. Psychological Challenges
FOMO (Fear of Missing Out) – Chasing moves after they’ve happened.
Overtrading – Trying to catch every news event.
Bias Confirmation – Ignoring facts that contradict your trade idea.
Adrenaline Trading – Making impulsive decisions under stress.
Solution:
Stick to predefined rules, practice in simulated environments, and keep a trading journal.
9. Case Studies
Case 1: Federal Reserve Interest Rate Decision
Date: March 2020 (Pandemic Emergency Cut)
Event: Fed slashed rates to near zero.
Immediate reaction: S&P 500 futures rallied, gold surged, USD weakened.
Trading opportunity: Buying gold and long positions in growth stocks.
Case 2: Tesla Earnings Beat
Date: October 2021
Event: Strong earnings beat Wall Street estimates.
Immediate reaction: TSLA surged 12% in after-hours.
Post-news play: Riding the uptrend for the next 5 trading sessions.
Case 3: Crude Oil Spike After Middle East Tensions
Event: Missile strike on oil facility.
Immediate reaction: Brent crude jumped 10% overnight.
Strategy: Long crude oil futures, short airline stocks (due to fuel costs).
10. Advantages & Disadvantages
Advantages:
Potential for large, quick profits.
Clear catalysts.
Can trade across asset classes (stocks, forex, commodities).
Disadvantages:
High volatility = high risk.
Requires fast execution and news access.
Slippage and spread widening are common.
Conclusion
News & Event-Driven Trading blends the speed of day trading with the intelligence of fundamental analysis.
Done right, it can be incredibly profitable because it capitalizes on the fastest-moving money in the market—the moment when everyone is reacting to fresh information.
However, it’s not for the faint-hearted. It demands:
Preparation (knowing when events occur),
Speed (executing quickly), and
Discipline (sticking to risk limits).
For traders who can master these, news trading isn’t just another strategy—it’s a way to be on the front line of market action.
BTC - OTE + SD Bearish Targets- As per my previous analysis, BTC Long targets were achieved perfectly and exactly from those levels a selling was expected. So, we hopped on to a SHORT trade at the TOP.
1. OTE (Optimal Trade Entry)
2. Bearish SD Targets (Standard Deviation Projections)
- Short Trade TP1 and TP2 are completed, which is almost 3000 points!
- Waiting for TP3
Do drop in your thoughts about this trade!
CRYPTO:BTCUSD Let's HODL!

BTC/USD Eyeing Breakout Toward $121.5K – Supply Zone Retest ?Current Price: ~$119,872 showing consolidation just above the 0.618 Fibonacci retracement level.
Structure: Price has bounced from the supply zone (~118.4K–118.6K) and is currently pushing upward.
Ichimoku Cloud: Price is trading within a cloud breakout attempt, indicating potential bullish momentum.
Fair Value Gaps (FVG): Two unfilled FVGs above suggest liquidity targets at ~$120.6K and ~$121.5K.
Support Levels:
Strong Support: ~$115.8K–116.5K.
Local Supply Zone Support: ~$118.4K.
Target: Main upside target sits at $121,533, aligning with a prior high and liquidity pool.
Trade Plan (Long Setup):
Entry: $119,700 – $119,900 (current consolidation zone)
Stop Loss: Below $118,400 (below supply zone)
Take Profit 1: $120,600 (first FVG target)
Take Profit 2: $121,533 (major resistance/liquidity target)
Risk/Reward Ratio: ~2.8
Notes: Wait for a bullish confirmation candle or 1H close above $119,900 before entering. Avoid chasing if price spikes without retest.
This plan follows the chart’s bullish structure and aims to ride the move into the untested liquidity areas above.
If you want, I can also give you a short scenario plan in case price rejects here. That would make this a full two-way trade setup.

ILV Setup – Consolidation at Major SupportAfter a strong rally, ILV has pulled back and is now consolidating within a major support zone — setting the stage for a potential next leg higher.
Trade Setup:
• Entry Zone: $17.00 – $18.00
• Take Profit Targets:
🥇 $20.00 – $24.00
🥈 $29.00 – $35.00
• Stop Loss: Just below $16.00

"BTC Hits Premium Zone – Is $117K the Next Stop?""BTC Hits Premium Zone – Is $117K the Next Stop?"
Bitcoin has rallied into the $121,000–$123,000 resistance zone, aligning with a Fair Value Gap (FVG) and a Breaker Block, both of which are high-probability reversal points in Smart Money Concepts (SMC). This region represents a premium pricing area, where institutions often take profits and trigger retracements.
Key Observations:
Liquidity Sweep: Prior highs have been taken, potentially fulfilling buy-side liquidity objectives.
Breaker Block Resistance: Price is currently reacting to this zone, indicating sellers stepping in.
Fair Value Gap: The unfilled imbalance between $121,000–$123,000 is acting as a short-term supply area.
Projected Retracement: A move down toward $117,000 is anticipated, coinciding with prior structure support and a liquidity pocket.
Technical Levels:
Resistance Zone: $121,000–$123,000
Target Zone: $117,000 (first key support)
Major Support: $112,000–$113,000 range
Bias: Short-term bearish toward $117,000 before potential continuation, unless price closes strongly above $123,000, invalidating the reversal thesis.

Smart Liquidity1. Introduction to Smart Liquidity
In the world of financial markets — whether traditional stock exchanges, forex markets, or the rapidly evolving world of decentralized finance (DeFi) — liquidity is a crucial concept. Liquidity simply refers to how easily an asset can be bought or sold without causing a significant impact on its price. Without adequate liquidity, markets become inefficient, volatile, and prone to manipulation.
Smart Liquidity, however, is not just liquidity in the conventional sense. It represents an evolution in how liquidity is managed, deployed, and utilized using advanced strategies, technology, and algorithms. It combines market microstructure theory, institutional trading practices, and algorithmic liquidity provisioning with real-time intelligence about market participants' behavior.
In the trading world, “smart liquidity” can refer to:
Institutional trading systems that detect where big players are placing orders and adapt execution strategies accordingly.
Smart order routing that seeks the best execution price across multiple venues.
Liquidity pools in DeFi that dynamically adjust incentives, fees, and token allocations to maintain efficient trading conditions.
Smart money concepts in price action trading, where traders look for liquidity zones (stop-loss clusters, order blocks) to anticipate institutional moves.
Essentially, smart liquidity is about identifying, accessing, and optimizing liquidity intelligently — not just relying on what’s available at face value.
2. The Evolution of Liquidity and the Rise of "Smart" Systems
To understand Smart Liquidity, we need to see where it came from:
Stage 1: Traditional Liquidity
In early stock and commodity markets, liquidity came from human market makers standing on a trading floor.
Orders were matched manually, with spreads (difference between bid and ask) providing profits for liquidity providers.
Large trades could easily move markets due to limited depth.
Stage 2: Electronic Liquidity
Electronic trading platforms and ECNs (Electronic Communication Networks) emerged in the 1990s.
Automated order matching allowed for faster execution, reduced spreads, and global access.
Liquidity started being measured by order book depth and trade volume.
Stage 3: Algorithmic & Smart Liquidity
With algorithmic trading in the 2000s, liquidity became a programmable resource.
Smart order routing systems appeared — scanning multiple exchanges, finding the best price, splitting orders across venues to minimize slippage.
High-frequency traders began exploiting micro-second inefficiencies in liquidity distribution.
Stage 4: DeFi and Blockchain Liquidity
The launch of Uniswap in 2018 introduced Automated Market Makers (AMMs) — smart contracts that provide constant liquidity without order books.
“Smart liquidity” in DeFi meant dynamic pool balancing, cross-chain liquidity aggregation, and automated yield optimization.
3. Core Principles of Smart Liquidity
Regardless of whether it’s in traditional finance (TradFi) or decentralized finance (DeFi), smart liquidity relies on three pillars:
a) Liquidity Intelligence
Identifying where liquidity resides — in limit order books, dark pools, or DeFi pools.
Recognizing liquidity pockets — price zones where many orders are clustered.
Using real-time analytics to adapt execution.
b) Liquidity Optimization
Deciding how much liquidity to tap without creating excessive slippage.
In DeFi, this might mean adjusting pool ratios or routing trades via multiple pools.
In TradFi, it involves breaking large orders into smaller pieces and executing over time.
c) Adaptive Liquidity Provision
Proactively supplying liquidity when markets are imbalanced to earn incentives.
In DeFi, this involves providing assets to liquidity pools and earning fees.
In market-making, it means adjusting bid-ask spreads based on volatility.
4. Smart Liquidity in Traditional Finance (TradFi)
In stock, forex, and futures markets, smart liquidity is often linked to institutional-grade execution systems.
Key Mechanisms:
Smart Order Routing (SOR)
Monitors multiple trading venues in real time.
Routes portions of an order to where the best liquidity and prices exist.
Example: A bank buying 10M shares might split the order into dozens of smaller trades across NYSE, NASDAQ, and dark pools.
Liquidity Seeking Algorithms
Designed to detect where large orders are hiding.
They “ping” the market with small trades to reveal liquidity.
Often used in dark pools to minimize market impact.
Iceberg Orders
Large orders hidden behind smaller visible ones.
Helps avoid revealing full trading intent.
VWAP/TWAP Execution
VWAP (Volume Weighted Average Price) spreads execution over a time frame.
TWAP (Time Weighted Average Price) executes evenly over time.
Example in Action:
If a hedge fund wants to buy 1 million shares of a stock without pushing up the price:
Smart liquidity algorithms might send 2,000–5,000 share orders every few seconds.
Orders are routed to venues with low spreads and high liquidity.
Some orders might go to dark pools to avoid public visibility.
5. Smart Liquidity in DeFi (Decentralized Finance)
In DeFi, “smart liquidity” often refers to dynamic, automated liquidity provisioning using blockchain technology.
Key Components:
Automated Market Makers (AMMs)
Smart contracts replace traditional order books.
Prices are set algorithmically using formulas like x × y = k (Uniswap model).
Smart liquidity adjusts incentives for liquidity providers (LPs) to keep pools balanced.
Liquidity Aggregators
Protocols like 1inch, Matcha, Paraswap scan multiple AMMs for the best rates.
Splits trades across multiple pools for optimal execution.
Dynamic Fee Adjustments
Platforms like Curve Finance adjust trading fees based on volatility and pool balance.
Impermanent Loss Mitigation
Smart liquidity protocols use hedging strategies to reduce LP losses.
Cross-Chain Liquidity
Bridges and protocols enable liquidity flow between blockchains.
6. Smart Liquidity Concepts in Price Action Trading
In Smart Money Concepts (SMC) — a form of advanced price action analysis — “liquidity” refers to clusters of stop-loss orders and pending orders that can be targeted by large players.
How It Works:
Liquidity Zones: Price areas where many traders have stop-loss orders (above swing highs, below swing lows).
Liquidity Grabs: Institutions push price into these zones to trigger stops, collecting liquidity for their own positions.
Order Blocks: Consolidation areas where large orders were placed, often becoming liquidity magnets.
7. Benefits of Smart Liquidity
Better Execution
Reduces slippage and improves fill prices.
Market Efficiency
Balances order flow across venues.
Accessibility
DeFi smart liquidity allows anyone to be a liquidity provider.
Risk Management
Algorithms can avoid volatile, illiquid conditions.
Profit Potential
Market makers and LPs earn fees.
8. Risks and Challenges
In TradFi
Information Leakage: Poorly executed algorithms can reveal trading intent.
Latency Arbitrage: High-frequency traders exploit small delays.
In DeFi
Impermanent Loss for LPs.
Smart Contract Risk (hacks, bugs).
Liquidity Fragmentation across multiple blockchains.
For Retail Traders
Misunderstanding liquidity zones can lead to stop-outs.
Algorithms are often controlled by institutions, making it hard for small traders to compete.
9. Real-World Examples
TradFi Example: Goldman Sachs’ Sigma X dark pool using smart order routing to match institutional buyers and sellers.
DeFi Example: Uniswap v3’s concentrated liquidity, letting LPs choose specific price ranges to deploy capital efficiently.
SMC Example: A forex trader spotting liquidity above a recent high, predicting a stop hunt before price reverses.
10. The Future of Smart Liquidity
AI-Powered Liquidity Routing: Machine learning models predicting where liquidity will emerge.
On-Chain Order Books: Combining centralized exchange depth with decentralized transparency.
Cross-Chain Smart Liquidity Networks: Seamless asset swaps across multiple blockchains.
Regulatory Clarity: More standardized rules for liquidity provision in crypto and TradFi.
11. Conclusion
Smart Liquidity is not just about having a lot of liquidity — it’s about using it wisely.
In traditional finance, it means algorithmically accessing and managing liquidity across multiple venues without tipping your hand.
In DeFi, it’s about automated, dynamic, and permissionless liquidity provisioning that adapts to market conditions.
In price action trading, it’s about understanding where liquidity lies on the chart and how big players use it.
In short:
Smart Liquidity = Intelligent liquidity discovery + efficient liquidity usage + adaptive liquidity provision.
It’s a fusion of market microstructure knowledge, advanced algorithms, and behavioral finance — making it one of the most powerful concepts in modern trading.

Crypto Trading & Blockchain Assets 1. Introduction
Cryptocurrencies and blockchain-based assets have revolutionized how we think about money, finance, and even ownership itself. From Bitcoin's birth in 2009 to the explosion of decentralized finance (DeFi), non-fungible tokens (NFTs), and tokenized real-world assets (RWA), the digital asset market has evolved into a multi-trillion-dollar ecosystem.
But unlike traditional markets, crypto operates 24/7, globally, and with high volatility — which means enormous opportunities and equally significant risks for traders.
In this guide, we’ll explore:
The fundamentals of blockchain technology
Types of blockchain assets
Trading styles, tools, and strategies for crypto
Risk management and psychology
The future outlook of blockchain-based markets
2. Understanding Blockchain Technology
2.1 What is Blockchain?
A blockchain is a distributed, immutable ledger that records transactions across multiple computers in a secure and transparent way. Instead of relying on a single authority like a bank, blockchains are decentralized — no single entity can control or alter the record without consensus.
Key features:
Decentralization – No central authority; control is distributed.
Transparency – Anyone can verify transactions.
Immutability – Once recorded, data can’t be altered without consensus.
Security – Cryptographic encryption ensures safety.
2.2 Types of Blockchains
Public Blockchains – Fully decentralized, open to anyone (e.g., Bitcoin, Ethereum).
Private Blockchains – Restricted access, controlled by a single entity (used in enterprises).
Consortium Blockchains – Controlled by a group of organizations (e.g., supply chain consortia).
Hybrid Blockchains – Combine public transparency with private access controls.
2.3 How Blockchain Enables Crypto Assets
Every blockchain asset — from Bitcoin to NFTs — is essentially a tokenized record on the blockchain. Ownership is proved via private keys (digital signatures) and transactions are verified by consensus mechanisms like:
Proof of Work (PoW) – Mining for Bitcoin.
Proof of Stake (PoS) – Validators stake coins to secure networks (e.g., Ethereum after the Merge).
Delegated Proof of Stake (DPoS) – Voting-based validator system.
3. Types of Blockchain Assets
Blockchain assets fall into several categories, each with unique characteristics:
3.1 Cryptocurrencies
These are digital currencies designed as mediums of exchange.
Examples: Bitcoin (BTC), Litecoin (LTC), Monero (XMR)
Use cases: Payments, remittances, store of value.
3.2 Utility Tokens
Tokens that provide access to a blockchain-based product or service.
Examples: Ethereum (ETH) for gas fees, Chainlink (LINK) for oracle services.
Use cases: Network participation, voting rights, service payments.
3.3 Security Tokens
Blockchain versions of traditional securities like stocks or bonds.
Examples: Tokenized equity shares.
Use cases: Investment with regulatory oversight.
3.4 Stablecoins
Cryptocurrencies pegged to fiat currencies or commodities.
Examples: USDT (Tether), USDC, DAI.
Use cases: Price stability for trading, cross-border transfers.
3.5 NFTs (Non-Fungible Tokens)
Unique digital assets that represent ownership of a specific item.
Examples: Bored Ape Yacht Club, CryptoPunks.
Use cases: Digital art, gaming, collectibles, tokenized property.
3.6 Tokenized Real-World Assets (RWA)
Physical assets represented on blockchain.
Examples: Tokenized gold (PAXG), tokenized real estate.
Use cases: Fractional ownership, liquidity for traditionally illiquid assets.
4. Crypto Trading Basics
4.1 How Crypto Markets Differ from Traditional Markets
24/7 Trading – No closing bell; markets are always active.
High Volatility – Double-digit daily price swings are common.
Global Participation – No national barriers; traders from anywhere can join.
No Central Exchange – Assets can be traded on centralized exchanges (CEXs) or decentralized exchanges (DEXs).
4.2 Major Crypto Exchanges
Centralized (CEX): Binance, Coinbase, Kraken, Bybit.
Decentralized (DEX): Uniswap, PancakeSwap, Curve Finance.
4.3 Crypto Trading Pairs
Assets are traded in pairs:
Crypto-to-Crypto: BTC/ETH, ETH/SOL
Crypto-to-Fiat: BTC/USD, ETH/USDT
5. Types of Crypto Trading
5.1 Spot Trading
Buying and selling actual crypto assets with immediate settlement.
5.2 Margin Trading
Borrowing funds to increase position size. Increases both profit potential and risk.
5.3 Futures & Perpetual Contracts
Betting on price movement without owning the asset. Allows leverage and short selling.
5.4 Options Trading
Trading contracts that give the right, but not the obligation, to buy/sell crypto.
5.5 Arbitrage Trading
Exploiting price differences between exchanges.
5.6 Algorithmic & Bot Trading
Using automated scripts to trade based on set rules.
6. Crypto Trading Strategies
6.1 Day Trading
Short-term trades executed within the same day, exploiting volatility.
6.2 Swing Trading
Holding positions for days or weeks to capture intermediate trends.
6.3 Scalping
Making dozens of trades per day for small profits.
6.4 Trend Following
Riding long-term upward or downward price movements.
6.5 Breakout Trading
Entering trades when price breaks a significant support or resistance level.
6.6 Mean Reversion
Betting that prices will return to historical averages.
7. Technical Analysis for Crypto
7.1 Popular Indicators
Moving Averages (MA)
Relative Strength Index (RSI)
MACD
Bollinger Bands
Fibonacci Retracements
Volume Profile
7.2 Chart Patterns
Bullish: Cup & Handle, Ascending Triangle
Bearish: Head & Shoulders, Descending Triangle
Continuation: Flags, Pennants
8. Fundamental Analysis for Blockchain Assets
8.1 Key Metrics
Market Cap
Circulating Supply
Tokenomics
Development Activity
Adoption & Partnerships
On-chain Metrics – Wallet addresses, transaction count, TVL in DeFi.
8.2 Events Impacting Prices
Protocol upgrades (Ethereum Merge, Bitcoin Halving)
Regulatory announcements
Exchange listings
Partnership news
9. Risk Management in Crypto Trading
9.1 Position Sizing
Risk only 1–2% of your portfolio per trade.
9.2 Stop Loss & Take Profit
Pre-define exit points to avoid emotional decisions.
9.3 Diversification
Spread investments across multiple coins and sectors.
9.4 Avoid Overleveraging
Leverage amplifies both gains and losses.
10. Trading Psychology in Crypto
Discipline over Emotion
Patience in Volatile Markets
Avoiding FOMO and Panic Selling
Sticking to Your Plan
Conclusion
Crypto trading and blockchain assets represent a paradigm shift in finance, offering unmatched transparency, security, and accessibility. For traders, the opportunities are massive — but so are the risks. Success in this space requires knowledge, discipline, and adaptability.
The market will continue to evolve, blending traditional finance with decentralized innovations, and traders who master both the technology and trading discipline will thrive.

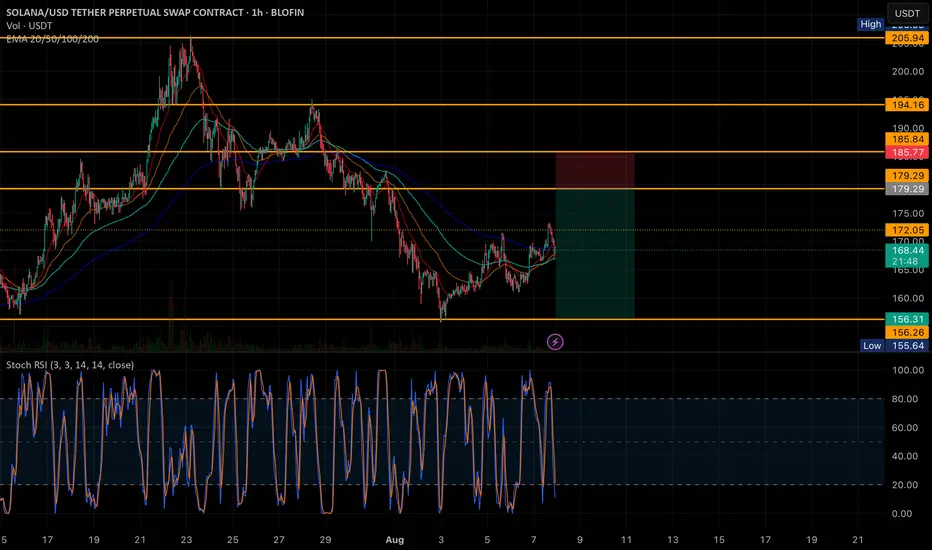
Sol short chartExpecting some upside move on Sol if holds this level.
But Sol need to break first 172 level
I will dca this trade from 172
Technical Analysis vs Fundamental AnalysisIntroduction
In the world of trading and investing, two dominant schools of thought guide decision-making: technical analysis and fundamental analysis. Both methodologies aim to forecast future price movements, but they differ significantly in philosophy, approach, tools, and time horizons.
This detailed article offers a side-by-side comparison of technical and fundamental analysis, exploring their foundations, tools, advantages, limitations, and how modern traders often use a hybrid approach to gain an edge in the markets.
1. Definition and Core Philosophy
Technical Analysis (TA)
Definition: Technical analysis is the study of past market data—primarily price and volume—to forecast future price movements.
Philosophy:
All known information is already reflected in the price.
Prices move in trends.
History tends to repeat itself.
TA focuses on identifying patterns and signals within charts and market data to predict price action, independent of the company’s fundamentals.
Fundamental Analysis (FA)
Definition: Fundamental analysis involves evaluating a security's intrinsic value by examining related economic, financial, and qualitative factors.
Philosophy:
Every asset has an inherent (fair) value.
Market prices may deviate from intrinsic value in the short term but will eventually correct.
Long-term returns are driven by the health and performance of the underlying asset.
FA dives into financial statements, management quality, industry dynamics, macroeconomic factors, and more to decide if a security is overvalued or undervalued.
2. Key Objectives
Aspect Technical Analysis Fundamental Analysis
Primary Goal Predict short-to-medium term price moves Assess long-term value and growth potential
Trader Focus Entry and exit timing Business quality, profitability
Time Horizon Short-term (minutes to weeks) Medium to long-term (months to years)
3. Tools and Techniques
Technical Analysis Tools
Price Charts: Line, bar, and candlestick charts
Indicators & Oscillators:
Moving Averages (MA)
Relative Strength Index (RSI)
MACD (Moving Average Convergence Divergence)
Bollinger Bands
Stochastic Oscillator
Chart Patterns:
Head and Shoulders
Double Top/Bottom
Triangles (ascending, descending)
Flags and Pennants
Volume Analysis: Analyzing the strength of price movements
Support and Resistance Levels
Trend Lines and Channels
Price Action & Candlestick Patterns:
Doji
Hammer
Engulfing patterns
Fundamental Analysis Tools
Financial Statements:
Income Statement
Balance Sheet
Cash Flow Statement
Financial Ratios:
P/E (Price to Earnings)
P/B (Price to Book)
ROE (Return on Equity)
Current Ratio
Debt to Equity
Earnings Reports
Economic Indicators:
GDP growth
Inflation
Interest rates
Employment data
Industry & Competitive Analysis
Management Evaluation
Valuation Models:
Discounted Cash Flow (DCF)
Dividend Discount Model (DDM)
Residual Income Model
4. Approach to Market Behavior
Technical Analysts Believe:
Market psychology drives price patterns.
Prices reflect supply and demand, fear and greed.
“The trend is your friend.”
Fundamental Analysts Believe:
Markets are inefficient in the short run.
Understanding business fundamentals offers a long-term edge.
“Buy undervalued assets and wait for the market to realize their value.”
5. Advantages and Strengths
Advantages of Technical Analysis:
Effective for short-term trading.
Useful across all markets: stocks, forex, crypto, commodities.
Provides clear entry/exit points.
Applicable even when fundamental data is limited or irrelevant (e.g., cryptocurrencies).
Can be automated (quant systems, bots, algo-trading).
Advantages of Fundamental Analysis:
Helps identify long-term investment opportunities.
Backed by real data and financial metrics.
Focus on intrinsic value, reducing speculative risk.
Allows understanding of economic cycles, company health, and competitive advantage.
Strong foundation for value investing and dividend strategies.
6. Limitations and Criticisms
Limitations of Technical Analysis:
Can produce false signals in choppy markets.
Heavily reliant on pattern recognition, which can be subjective.
Assumes past price behavior repeats, which may not always hold.
May lead to overtrading.
Less effective in fundamentally driven markets (e.g., news-based volatility).
Limitations of Fundamental Analysis:
Time-consuming and data-intensive.
Less effective for timing entries/exits.
Assumptions in valuation models can be inaccurate.
Markets can remain irrational longer than a trader can remain solvent.
Difficult to apply in short-term trading scenarios.
7. Use in Different Market Conditions
Market Condition Technical Analysis Fundamental Analysis
Trending Market Very effective (trend following) May be slow to react
Sideways Market Can be misleading (whipsaws) Waits for fundamental triggers
News-Driven Volatilit Less reliable; news invalidates patterns Analyzes long-term implications of the news
Earnings Season High volatility useful for trades Critical time to revalue investments
8. Real-World Examples
Technical Analysis Example:
A trader observes a bullish flag on Reliance Industries’ chart. They enter a long trade expecting a breakout with a defined stop loss below the flag's support. No attention is paid to quarterly results or business updates.
Fundamental Analysis Example:
An investor evaluates Infosys’ fundamentals. Despite a recent dip in price due to market panic, the investor buys after analyzing strong balance sheets, healthy cash flow, and consistent dividends.
9. Types of Traders and Investors
Type Likely to Use
Scalper Purely technical analysis
Day Trader Mostly technical analysis
Swing Trader Technical with some fundamental awareness
Position Trader Blend of both
Investor Mostly fundamental analysis
Quant Trader TA-based systems, machine learning models
10. Integration: The Hybrid Approach
In the modern market landscape, many traders and investors adopt a hybrid approach, combining the strengths of both TA and FA. This dual strategy provides:
Better timing for fundamentally driven trades.
Deeper conviction in technically identified setups.
Risk reduction by filtering out weak stocks fundamentally.
Example: A swing trader scans for technically strong patterns in fundamentally sound stocks. They avoid penny stocks or overly leveraged companies, no matter how bullish the chart looks.
Crypto Trading1. Introduction to Crypto Trading
Cryptocurrency trading has revolutionized financial markets. With Bitcoin's debut in 2009 and the rise of altcoins like Ethereum, Solana, and hundreds more, crypto trading has evolved into a multi-trillion-dollar global ecosystem. Unlike traditional stock markets, crypto operates 24/7, offers high volatility, and is accessible to anyone with an internet connection.
Crypto trading involves buying and selling digital currencies via exchanges or decentralized protocols, either to profit from price movements or to hedge other investments. Traders employ a mix of strategies, from scalping and swing trading to arbitrage and algorithmic trading.
2. Understanding Cryptocurrency
Before trading, it's essential to understand what you’re dealing with. A cryptocurrency is a decentralized digital asset that uses cryptography for security and operates on a blockchain — a distributed ledger maintained by a network of computers (nodes).
Types of Crypto Assets
Coins: Native to their blockchain (e.g., Bitcoin, Ethereum).
Tokens: Built on existing blockchains (e.g., Uniswap on Ethereum).
Stablecoins: Pegged to fiat (e.g., USDT, USDC).
Utility Tokens: Used within ecosystems (e.g., BNB on Binance).
Governance Tokens: Give voting rights in decentralized protocols (e.g., AAVE).
NFTs: Non-fungible tokens representing ownership of unique digital items.
3. Centralized vs. Decentralized Exchanges (CEX vs DEX)
Centralized Exchanges (CEX)
These are platforms like Binance, Coinbase, and Kraken where a third party manages funds. They offer:
High liquidity
Advanced tools
Fiat support
Faster trades
Decentralized Exchanges (DEX)
These operate without intermediaries, using smart contracts. Examples: Uniswap, PancakeSwap.
Full user control
No KYC
Permissionless listings
Often lower liquidity
4. Trading Styles in Crypto
Different traders adopt different approaches based on time, capital, and risk tolerance.
Day Trading
Involves entering and exiting trades within the same day.
Requires technical analysis, speed, and discipline.
Swing Trading
Focuses on catching "swings" in price over days or weeks.
Mix of technical and fundamental analysis.
Scalping
High-frequency trades aiming for small profits.
Needs high-volume and low-fee platforms.
Position Trading
Long-term strategy, often lasting months or years.
Driven by fundamentals and macro trends.
Arbitrage Trading
Profit from price discrepancies between platforms or countries.
Algorithmic Trading
Use of bots and scripts to automate strategies.
5. Fundamental Analysis (FA) in Crypto
FA involves evaluating the intrinsic value of a coin or token.
Key FA Metrics
Whitepaper: Project’s mission, technology, use case.
Team: Founders, developers, advisors.
Tokenomics: Supply, emission, burning, utility.
Partnerships: Collaborations with firms or protocols.
On-chain Data: Wallet activity, transaction volume, holder count.
Community: Social presence, developer activity.
6. Technical Analysis (TA) in Crypto
TA involves studying historical price charts and patterns.
Common Tools and Indicators
Support and Resistance: Key price levels where buyers/sellers step in.
Moving Averages (MA): Smooths out price data (e.g., 50MA, 200MA).
RSI (Relative Strength Index): Measures overbought/oversold conditions.
MACD (Moving Average Convergence Divergence): Trend strength and reversals.
Fibonacci Retracement: Identifies retracement levels.
Volume Profile: Shows traded volume at each price level.
7. Popular Cryptocurrencies for Trading
Bitcoin (BTC) – Market leader, most liquid.
Ethereum (ETH) – Smart contract leader.
Binance Coin (BNB) – Utility token for Binance ecosystem.
Solana (SOL) – High-speed blockchain.
Ripple (XRP) – Focused on cross-border payments.
Polygon (MATIC) – Ethereum scaling solution.
Chainlink (LINK) – Oracle service for smart contracts.
Shiba Inu/Dogecoin (SHIB/DOGE) – Meme coins with volatility.
8. Key Platforms and Tools
Exchanges
Binance: Largest global exchange.
Coinbase: Easy for beginners, regulated.
Bybit/OKX/KUCOIN: Derivatives-focused exchanges.
Wallets
Hardware: Ledger, Trezor (cold storage).
Software: MetaMask, Trust Wallet.
Tools
TradingView: Charting and TA.
CoinGecko/CoinMarketCap: Market data.
Glassnode/Santiment: On-chain analysis.
DeFiLlama: TVL and protocol data.
Dextools: For DEX trading insights.
9. Risks in Crypto Trading
Crypto is volatile, and profits aren’t guaranteed. Understanding risk is crucial.
Volatility Risk
Prices can change 10–30% within hours.
Liquidity Risk
Some tokens have low trading volume, causing slippage.
Security Risk
Exchange hacks, phishing, and smart contract exploits.
Regulatory Risk
Lack of regulation means potential bans or changes in law.
Leverage Risk
Using borrowed funds increases gains but magnifies losses.
10. Risk Management Strategies
Position Sizing
Don’t allocate too much to a single trade. Use fixed percentages (e.g., 1–2% of total capital).
Stop-Loss & Take-Profit
Set exit points to manage risk and lock in profits.
Diversification
Spread investments across different coins, sectors, and strategies.
Avoid Emotional Trading
Stick to plans. Don’t FOMO (Fear of Missing Out) or panic sell.
Conclusion
Crypto trading is a high-risk, high-reward arena. It offers unmatched opportunity, but demands discipline, education, and risk control. Whether you're scalping Bitcoin or holding altcoins for long-term gains, success lies in understanding the market, mastering your emotions, and having a structured plan.
The market evolves quickly. Stay informed, test strategies, manage risk, and you can thrive in this dynamic space.
IPO & SME IPO Trading Strategies1. Understanding IPOs and SME IPOs
A. What is an IPO?
An Initial Public Offering (IPO) is when a private company issues shares to the public for the first time. This transitions the company from being privately held to publicly traded on stock exchanges such as NSE or BSE.
Objectives of IPO:
Raise capital for expansion, debt repayment, or R&D.
Provide liquidity to existing shareholders.
Enhance brand visibility and corporate governance.
B. What is an SME IPO?
SME IPOs are IPOs issued by Small and Medium Enterprises under a special platform like NSE Emerge or BSE SME. They have:
Lower capital requirements (₹1 crore to ₹25 crore).
Minimum application size of ₹1-2 lakh.
Limited liquidity post-listing due to low float and trading volume.
SME IPO Characteristics:
Typically involve regional businesses, startups, or family-run enterprises.
Volatile listings; both massive upmoves and severe falls.
HNI & Retail driven subscriptions.
2. IPO Trading vs Investing
There are two main approaches to IPO participation:
Type Objective Horizon Focus
IPO Trading Capture listing gains Short-Term Sentiment, Subscription, Grey Market Premium
IPO Investing Long-term wealth creation 1–3+ years Fundamentals, Business Model, Financials
Smart traders often mix both: aim for short-term gains in hyped IPOs and long-term holds in quality businesses like DMart, Nykaa, or Syrma SGS (for SME IPOs).
3. Key Pre-IPO Metrics to Track
A. Grey Market Premium (GMP)
Unofficial trading before the listing. High GMP indicates strong sentiment but can be manipulated.
B. Subscription Data
Track QIB, HNI, and Retail bids:
QIB-heavy IPOs → Institutional confidence.
HNI oversubscription → High leveraged bets.
Retail overbooking → Mass interest.
C. Anchor Book Participation
High-quality anchors (like mutual funds, FPIs) validate the IPO’s credibility.
D. Valuation Comparison
Compare PE, EV/EBITDA, and Market Cap/Sales with listed peers to spot under/over-valuation.
E. Financial Strength
Growth consistency, debt levels, margins, and cash flows are critical for long-term investing.
4. IPO Trading Strategies
A. Strategy 1: Grey Market Sentiment Play
Objective: Capture listing gains based on GMP trend and subscription buzz.
Steps:
Track GMP daily before listing (via IPO forums/Telegram).
Apply in IPOs where GMP is rising + oversubscription >10x overall.
Exit on listing day—especially in frothy market conditions.
Example: IPO of Ideaforge, Cyient DLM saw over 50% listing gains using this sentiment-led approach.
Risk: GMP can be manipulated; exit if listing falls below issue price.
B. Strategy 2: QIB-Focused Play
Objective: Follow institutional money to ride solid listings.
Steps:
Check final day subscription numbers:
QIB > 20x: High confidence
Retail < 3x: Less crowded
Apply via multiple demat accounts (family/friends).
Hold 1–5 days post listing if the stock consolidates above issue price.
Example: LIC IPO had poor QIB response → poor listing. In contrast, Mankind Pharma had solid QIB backing → stable listing + rally.
C. Strategy 3: Volatility Breakout Listing Day Trade
Objective: Trade listing day volatility using price action.
Steps:
Wait for 15–20 mins after listing.
Use 5-minute candles to identify breakout/breakdown.
Trade the direction with volume confirmation.
Tools:
VWAP as intraday trend indicator.
RSI divergence for reversal points.
SL near listing price or day’s low/high.
Ideal For: Fast traders using terminals like Zerodha, Upstox, or Angel One.
D. Strategy 4: IPO Allotment to Listing Arbitrage
Objective: Profit between allotment date and listing date when GMP rises.
Steps:
Apply in SME or hot IPOs via ASBA.
If allotted, and GMP rises 2–3x, sell pre-listing via grey market (via IPO dealers).
No market risk on listing day.
Note: SME IPOs have active grey markets.
Example: SME IPOs like Zeal Global or Droneacharya had pre-listing buyouts at massive premiums.
E. Strategy 5: Post-Listing Re-Entry on Dip
Objective: Re-enter quality IPOs after listing correction.
Steps:
If IPO lists flat or down due to weak market, wait for panic selling.
Re-enter when price approaches IPO issue price or support zones.
Use fundamentals + volume profile for entry.
Example: Zomato, Paytm corrected 30–50% post-listing, then rebounded on improved sentiment.
5. SME IPO Specific Strategies
A. Strategy 6: Low-Float Listing Momentum
Objective: Capture momentum due to low float and limited sellers.
Steps:
Identify SME IPOs with issue size < ₹25 crore and float < 10%.
Strong HNI + retail over-subscription + no QIB dilution.
Hold 2–3 days post listing; ride circuit filters.
Warning: Exit when volumes dry up or promoter pledges shares.
B. Strategy 7: SME IPO Fundamental Bet
Objective: Identify potential multi-baggers from new economy SMEs.
Checklist:
Niche business model (EV, automation, D2C, defence).
Revenue CAGR >20% YoY.
EBITDA Margin >10%.
Clean auditor + experienced management.
Example: SME stocks like Syrma SGS, Droneacharya, Concord Biotech became multi-baggers.
Hold Duration: 1–2 years with regular results tracking.
6. IPO & SME IPO Risk Management
A. Avoid Bubble IPOs
Stay away from IPOs with:
Unrealistic GMP vs fundamentals.
Massive dilution by promoters.
Peer valuations show overpricing.
B. Avoid Leverage in SME IPOs
Leverage via NBFC funding in SME IPOs can lead to forced selling.
C. Exit When GMP Crashes Pre-Listing
Sudden GMP collapse = bad sentiment/news. Exit if listing turns risky.
D. Avoid Penny SME IPOs
New SEBI rules aim to stop manipulation, but penny stocks still see pump-and-dump schemes. Check:
Past promoter frauds.
Unrealistic financials.
Low auditor credibility.
Conclusion
IPO and SME IPO trading isn’t just about luck or hype—it’s about data-driven decisions, sentiment analysis, technical timing, and smart risk control. With the right strategies, traders can enjoy quick gains, while long-term investors can spot future market leaders early.
Key Takeaways:
For short-term listing gains, focus on GMP, subscription trends, and QIB interest.
For long-term wealth, choose fundamentally strong IPOs with scalability.
In SME IPOs, look for low-float momentum or niche growth companies.
Always apply with discipline, avoid chasing every IPO.
Part11 Trading MasterclassKey Players in the Options Market
Option Buyers (Holders): Pay premium, have rights.
Option Sellers (Writers): Receive premium, have obligations.
Retail Traders: Use options for speculation or hedging.
Institutions: Use advanced strategies for income or risk management.
Option Pricing: The Greeks
Option pricing is influenced by various factors known as Greeks:
Delta: Measures how much the option price changes for a ₹1 move in the underlying.
Gamma: Measures how much Delta changes for a ₹1 move.
Theta: Measures time decay — how much the option loses value each day.
Vega: Measures sensitivity to volatility.
Rho: Measures sensitivity to interest rates.
Time decay and volatility are crucial. OTM options lose value faster as expiry nears.
