Part4 Institution Trading Types of Options
American vs. European Options
American Options: Can be exercised anytime before expiry.
European Options: Can only be exercised at expiry.
Index Options vs. Stock Options
Stock Options: Based on individual stocks (e.g., Reliance, Infosys).
Index Options: Based on indices (e.g., Nifty, Bank Nifty).
Weekly vs. Monthly Options
Weekly Options: Expire every Thursday (India).
Monthly Options: Expire on the last Thursday of the month.
Cryptomarket

Sector Rotation & Thematic TradingIntroduction
In the dynamic world of stock markets, not all sectors perform equally at all times. Market leadership often shifts as economic conditions change. This shift is known as sector rotation, and when paired with thematic trading—investing based on macro-level ideas or societal trends—it becomes a powerful strategy. Together, these approaches help traders anticipate where capital might flow next, allowing them to align their portfolios accordingly.
This guide explores the foundations, strategies, tools, and risks associated with Sector Rotation and Thematic Trading, especially from the perspective of an active Indian retail or institutional trader.
1. Understanding Sector Rotation
What is Sector Rotation?
Sector rotation is a strategy that involves shifting investments among different sectors of the economy based on the current phase of the business cycle. Each sector behaves differently under various economic conditions, and recognizing these shifts can help maximize returns.
The Four Phases of the Business Cycle:
Expansion: Economy grows, GDP rises, unemployment falls.
Strong Sectors: Industrials, Technology, Consumer Discretionary
Peak: Growth slows, inflation rises.
Strong Sectors: Energy, Materials, Utilities
Contraction (Recession): GDP falls, unemployment rises.
Strong Sectors: Consumer Staples, Healthcare
Trough (Recovery): Economy bottoms out, early growth.
Strong Sectors: Financials, Industrials, Technology
Why Does Sector Rotation Work?
Institutional flow: Big funds adjust their portfolios depending on economic forecasts.
Macroeconomic sensitivity: Some sectors are more interest-rate sensitive, others more dependent on consumer confidence.
Cyclical vs Defensive Sectors: Cyclical sectors move with the economy; defensive sectors offer stability during downturns.
2. Sector Rotation in Practice
Real-Life Example: Post-COVID Recovery
2020-21: Pharma, Tech (work-from-home, vaccines)
2021-22: Commodities, Real Estate (stimulus, demand revival)
2023 onwards: Industrials, Capital Goods (infrastructure push, global reshoring)
Indian Market Examples:
Banking & Financials: Surge when RBI eases interest rates or during credit booms.
FMCG & Healthcare: Outperform during inflation or slowdowns.
Auto Sector: Grows with consumer confidence and disposable income.
Infra & PSU Stocks: Outperform during budget season or government CapEx pushes.
Tracking Sector Rotation: Tools & Indicators
Relative Strength Index (RSI) comparisons between sectors.
Sector-wise ETFs or Index tracking: Nifty Bank, Nifty IT, Nifty FMCG, etc.
FII/DII Flow Analysis sector-wise.
Economic data correlation: IIP, Inflation, GDP data.
3. Thematic Trading Explained
What is Thematic Trading?
Thematic trading focuses on investing in long-term structural trends rather than short-term economic cycles. It’s about identifying a big idea and aligning with it over time, often across multiple sectors.
Key Differences vs Sector Rotation
Feature Sector Rotation Thematic Trading
Focus Economic cycles Societal or tech trends
Duration Medium-term (months) Long-term (years)
Scope Sector-based Cross-sector or multi-sector
Tools Macro indicators, ETFs Trend analysis, qualitative research
4. Popular Themes in Indian & Global Markets
a. Green Energy & Sustainability
Stocks: Adani Green, Tata Power, IREDA
Theme: ESG investing, net-zero targets, solar & wind energy
b. Digital India & Fintech
Stocks: CAMS, Paytm, Zomato, Nykaa
Theme: UPI adoption, e-governance, cashless economy
c. EV & Battery Revolution
Stocks: Tata Motors, Exide, Amara Raja, M&M
Theme: Electric mobility, lithium-ion battery, vehicle electrification
d. Infrastructure & CapEx Cycle
Stocks: L&T, IRFC, NCC, RVNL, BEL
Theme: Government spending, Budget CapEx push, Atmanirbhar Bharat
e. Manufacturing & China+1
Stocks: Dixon, Amber, Syrma SGS, Tata Elxsi
Theme: Global supply chain diversification, PLI schemes
f. AI & Tech Transformation
Stocks: TCS, Infosys, Happiest Minds
Theme: Cloud computing, automation, generative AI
g. Rural India & Agri-Tech
Stocks: PI Industries, Dhanuka, Escorts
Theme: Digital farming, Kisan drones, government subsidies
5. How to Implement Sector Rotation & Thematic Trading
Step-by-Step Framework
Macro Analysis:
Understand current phase of the economy.
Follow RBI policy, inflation, IIP, interest rate cycles.
Identify Sector Leaders:
Use Relative Strength (RS) comparison.
Look for outperforming indices or sector ETFs.
Stock Screening:
Pick stocks within strong sectors using volume, trend, and fundamentals.
Focus on high-beta stocks during sector rallies.
Thematic Mapping:
Overlay ongoing themes with sector strengths.
For example: In CapEx cycle (sector), Infra (theme), pick RVNL, L&T, NBCC.
Entry Timing:
Look for sector breakout on charts (weekly/monthly).
Confirm using sector rotation tools like RRG charts.
Exit/Rotate:
Monitor sector fatigue and capital rotation signals.
Shift to next sector as per business cycle or theme exhaustion.
Final Thoughts
Sector Rotation and Thematic Trading are no longer just institutional tools—they are critical for any modern trader or investor looking to outperform in both short-term and long-term markets. With macro awareness, charting skills, and access to quality data, traders can dynamically shift capital, aligning with both economic cycles and thematic tailwinds.
The trick is to stay informed, agile, and selective—rotating not just sectors, but your mindset as market conditions evolve.

Part5 Institution Trading Stratergy1. Introduction to Options Trading
Options trading is a powerful financial strategy that allows traders to speculate on or hedge against the future price movements of assets such as stocks, indices, or commodities. Unlike traditional investing, where you buy or sell the asset itself, options give you the right, but not the obligation, to buy or sell the asset at a specific price before a specified date.
Options are widely used by retail traders, institutional investors, and hedge funds for various purposes—ranging from hedging risk, generating income, or leveraging small amounts of capital for high returns.
2. Basics of Options
What is an Option?
An option is a derivative contract whose value is based on the price of an underlying asset. It comes in two forms:
Call Option: Gives the holder the right to buy the underlying asset.
Put Option: Gives the holder the right to sell the underlying asset.
Key Terms
Strike Price: The price at which the option can be exercised.
Premium: The price paid to buy the option.
Expiry Date: The last date the option can be exercised.
In-the-Money (ITM): Option has intrinsic value.
Out-of-the-Money (OTM): Option has no intrinsic value.
At-the-Money (ATM): Strike price is equal or close to the current market price.

Super Cycle in Trading (2025–2030 Outlook)Introduction: What is a Super Cycle in Trading?
A super cycle in trading refers to a long-term, secular trend that drives asset prices higher (or lower) across years—sometimes even decades. These macroeconomic cycles often result from structural shifts such as technological revolutions, global demographic trends, monetary policy changes, or supply-demand imbalances in key markets like commodities, equities, or currencies.
Historically, super cycles have influenced not just asset prices but global economies, wealth distribution, and geopolitical dynamics. For instance, the commodity super cycle of the early 2000s—driven by China's industrialization—triggered a worldwide surge in raw material prices. The tech super cycle in the 2010s saw exponential gains in the valuation of Silicon Valley and digital-first companies.
As we enter the second half of the 2020s, traders and investors are keenly watching for the 2025–2030 super cycle—which sectors will dominate, what risks lie ahead, and how to position themselves for maximum advantage.
Section 1: Characteristics of a Super Cycle
Understanding a super cycle involves recognizing its unique characteristics:
Extended Duration – Lasts 5–20 years.
Broad Market Impact – Affects multiple asset classes, not just isolated sectors.
Macro-Driven – Tied to global shifts in technology, demographics, or policy.
Momentum-Heavy – Once in motion, trends tend to self-reinforce.
High Volatility Phases – Though generally upward (or downward), corrections within the cycle can be sharp.
Section 2: Historical Super Cycles & Lessons Learned
To understand future super cycles, we must look at past ones:
1. Post-War Industrial Boom (1945–1965)
Driven by U.S. manufacturing and European reconstruction.
Equities soared while gold remained fixed under Bretton Woods.
2. Oil Shock & Stagflation (1970s)
Energy-driven cycle where oil-producing nations gained power.
Gold and commodities surged; equities stagnated.
3. Tech Bubble (1990s–2000)
Dot-com boom powered by internet expansion.
Unprecedented IPO mania followed by the 2001 crash.
4. China-Driven Commodity Cycle (2002–2011)
Massive demand for metals, energy, and raw goods.
Benefited countries like Australia, Brazil, and Russia.
5. Post-GFC Liquidity Super Cycle (2009–2021)
Central bank stimulus led to asset inflation.
Tech, real estate, and passive investing dominated.
Key Takeaway: Super cycles are driven by unique, structural themes. They reward early movers and punish late entrants who chase overheated trends.
Section 3: Super Cycle Themes Likely to Dominate 2025–2030
Here are the major themes expected to power the next super cycle:
1. Artificial Intelligence and Automation
Why? Generative AI (like ChatGPT), robotics, and LLMs are transforming productivity, disrupting white-collar jobs, and creating new digital business models.
Market Implications:
Long-term growth in AI chipmakers, cloud infra, and data platforms.
Emergence of “AI-first” companies replacing legacy tech.
ETFs and thematic funds based on AI and robotics to outperform.
Trading Tip: Watch for mid-cap tech breakouts and AI service enablers in emerging markets.
2. Green Energy & Climate Tech
Why? Energy transition is no longer optional—climate policy, regulation, and ESG demand are forcing real capital shifts.
Market Implications:
Massive investment in solar, wind, EVs, hydrogen, and battery storage.
Decline in legacy oil demand by late 2020s, despite short-term spikes.
New carbon trading platforms and climate hedge instruments.
Trading Tip: Focus on battery metals like lithium, cobalt, and rare earth ETFs.
3. De-Dollarization & Multi-Currency Trade Systems
Why? BRICS+ countries are pushing for alternative trade systems, reducing dependency on USD.
Market Implications:
Volatility in forex markets, with rising prominence of gold, yuan, and digital currencies.
Pressure on U.S. Treasury yields and broader financial dominance.
Trading Tip: Keep an eye on emerging market currencies, sovereign digital currency rollouts, and gold-based ETFs.
4. Demographic Super Cycle
Why? Aging populations in the West vs. youth booms in South Asia & Africa.
Market Implications:
Long-term bullishness on India, Vietnam, Indonesia due to labor and consumption booms.
Bearish tilt on EU and Japan due to declining productivity.
Trading Tip: Sectoral rotation into consumer stocks, fintech, and healthcare in these high-growth regions.
5. Decentralized Finance & Blockchain Integration
Why? Post-crypto winter, serious institutional adoption of DeFi is happening under regulated models.
Market Implications:
Ethereum and newer chains like Solana could see super cycle price surges.
Traditional finance will start integrating blockchain infrastructure (e.g., tokenized bonds, real estate).
Trading Tip: Long horizon positions in select Web3 tokens, DeFi apps, and stablecoin rails.
Section 4: Risks That Could Disrupt the Super Cycle
Super cycles aren’t guaranteed. Several factors can derail or delay them:
Geopolitical Tensions – Taiwan Strait, Middle East, Russia-Ukraine could fracture global trade.
Inflation Persistence – Sticky inflation may force central banks to tighten longer.
Tech Bubble 2.0 – Overhyped AI or green tech stocks could deflate.
Debt Crisis – Soaring global debt levels could trigger defaults or banking stress.
Climate Black Swans – Extreme weather events might upend agriculture, insurance, or energy markets.
Mitigation Strategy for Traders: Use options hedging, sector rotation, and diversified portfolio allocations. Follow global macro signals religiously.
Section 5: Trading Strategies to Ride the 2025–2030 Super Cycle
1. Thematic ETFs & Sectoral Allocation
Invest in AI, green energy, EM consumption, blockchain infrastructure via sector-focused ETFs.
2. Momentum & Breakout Trading
Super cycles create strong trend-following environments. Use weekly/monthly breakout setups for swing trades.
3. Options Writing with Super Cycle Bias
Sell puts on long-term bullish assets to accumulate at lower prices.
Use vertical spreads to capture trend-based price movement.
4. Position Trading in Commodities
Long metals and energy on dips; stay alert to seasonal and geopolitical triggers.
Super cycles often start in commodity inflation before equity re-ratings.
5. SME IPO Participation
India's SME boom is part of its structural super cycle. High-risk, high-reward territory for traders.
Use strict due diligence, avoid hype-based entries.
6. Macro Event Calendar Trading
Plan around key policy events: U.S. Fed meets, BRICS summits, G20, COP summits, Indian Budget, etc.
These can signal inflection points within super cycles.
Conclusion: Prepare, Don’t Predict
The 2025–2030 super cycle is forming amidst rapid technological shifts, rising geopolitical complexity, climate urgency, and generational demographic changes. Traders who align their strategies with these megatrends—rather than chasing short-term narratives—stand to benefit the most.
Use this cycle not just to profit, but to learn, adapt, and evolve as a market participant.
Options Trading Strategies (Weekly/Monthly Expiry)Introduction
Options trading is a powerful tool that offers flexibility, leverage, and hedging opportunities to traders. While buying and selling options is accessible, mastering strategies tailored for weekly and monthly expiries can significantly improve your chances of success. These expiry-based strategies are designed to take advantage of time decay (Theta), volatility (Vega), direction (Delta), and price range (Gamma).
This guide will deeply explore how traders approach weekly vs monthly expiry, key option strategies, risk-reward setups, and market conditions under which they’re best applied. It’s designed in simple, human-friendly language, ideal for both beginners and experienced traders.
Part 1: Understanding Expiry Types
Weekly Expiry Options
Expiry Day: Every Thursday (for NIFTY, BANKNIFTY) or the last Thursday of the week if Friday is a holiday.
Time Horizon: 1–7 days
Used by: Intraday and short-term positional traders
Purpose: Quick premium decay (theta decay is faster), suitable for short-duration strategies.
Monthly Expiry Options
Expiry Day: Last Thursday of every month
Time Horizon: 20–30 days
Used by: Positional traders, hedgers, and institutions
Purpose: Manage risk, longer setups, or swing trades; smoother premium decay compared to weeklies.
Part 2: Key Greeks in Expiry-Based Strategies
Understanding how Greeks behave around expiry is crucial:
Theta: Time decay accelerates in the final days (especially for weekly options).
Delta: Determines direction sensitivity; weekly options are more delta-sensitive near expiry.
Vega: Volatility effect; monthly options are more exposed to volatility changes.
Gamma: High near expiry, especially in ATM (At-the-Money) options — can lead to quick losses/gains.
Part 3: Weekly Expiry Strategies
1. Intraday Short Straddle (High Theta Play)
Setup: Sell ATM Call and Put of current week’s expiry.
Objective: Capture premium decay as the price stays around a range.
Best Time: Expiry day (Thursday), typically after 9:45 AM when direction becomes clearer.
Example (NIFTY at 22,000):
Sell 22000 CE and 22000 PE for ₹60 each.
Conditions:
Low India VIX
Expected range-bound movement
No major news or global event
Risks:
Sudden movement (delta risk)
Need for proper stop-loss or delta hedging
2. Short Iron Condor (Neutral)
Setup: Sell OTM Call and Put; Buy further OTM Call and Put for protection.
Risk-defined strategy, ideal for weekly expiry when you expect low movement.
Example:
Sell 22100 CE and 21900 PE
Buy 22200 CE and 21800 PE
Benefit:
Controlled loss
Decent return if the index stays in range
When to Use:
Mid-week when implied volatility is high
Event expected to cool off
3. Long Straddle (Directional Volatility)
Setup: Buy ATM Call and Put of the same strike.
Best for: Sudden movement expected — news, results, RBI event.
Example (Bank Nifty at 48,000):
Buy 48000 CE and 48000 PE
Break-even:
Needs large move to be profitable (due to premium paid on both sides)
Risk:
Premium loss if market remains flat
4. Directional Option Buying (Momentum)
Setup: Buy CE or PE depending on market trend.
Ideal for: Trending days (Tuesday to Thursday)
Time decay: High risk in weekly expiry. Must be quick in entries and exits.
Example:
Bank Nifty bullish -> Buy 48000 CE when price breaks above a resistance.
Tips:
Use support/resistance, volume, and OI data
Avoid buying deep OTM options
5. Option Scalping on Expiry Day
Method: Trade ATM options in 5-minute or 15-minute chart using price action.
Goal: Capture small moves multiple times — 10 to 20 points in NIFTY or BANKNIFTY
Works Best:
Thursday (expiry)
Volatile days with good volumes
Tools:
VWAP, OI buildup, Breakout strategy, Moving Averages
Part 4: Monthly Expiry Strategies
1. Covered Call (Long-Term Positioning)
Setup: Buy stocks (or futures), sell OTM call options
Goal: Earn premium while holding stocks
Example:
Buy Reliance stock at ₹2800
Sell 2900 CE monthly option for ₹50
Best For:
Investors with long-term holdings
Stable stocks with limited upside
2. Calendar Spread (Volatility Strategy)
Setup: Sell near expiry (weekly), buy far expiry (monthly)
Example:
Sell 22000 CE (weekly)
Buy 22000 CE (monthly)
Goal:
Earn premium from weekly decay, protect via long monthly
Best Time:
When volatility is expected to rise
Ahead of big events like elections, RBI meet
3. Bull Call Spread (Directional)
Setup: Buy ATM Call, Sell OTM Call
Risk-defined bullish strategy
Example:
Buy 22000 CE, Sell 22200 CE (monthly)
Payoff:
Limited profit, limited risk
Better risk-reward than naked option buying
Use When:
Monthly expiry in bullish trend
Budget rallies, earnings momentum
4. Bear Put Spread (Downside Protection)
Setup: Buy ATM Put, Sell OTM Put
Use for: Bearish view with limited loss
Example:
Buy 22000 PE, Sell 21800 PE (monthly)
Ideal For:
Volatile times with expected downside
FII outflows, global corrections
5. Ratio Spread (Moderately Bullish or Bearish)
Setup: Buy 1 ATM Option, Sell 2 OTM Options
Warning: Can cause unlimited loss if trade goes against you
Example (Bullish Ratio Call Spread):
Buy 22000 CE, Sell 2x 22200 CE
Conditions:
Monthly expiry
Expect mild upward move but not aggressive rally
Conclusion
Trading weekly and monthly expiry options offers unique opportunities and risks. Weekly options give fast profits but demand sharp timing and discipline. Monthly options offer more flexibility for directional, volatility, and income-based strategies.
Whether you’re a scalper, trend trader, or risk-averse investor, there’s a strategy suited for your style — but success depends on combining the right strategy with sound analysis, proper risk control, and emotional discipline.
GIFT Nifty & Global Index Correlations1. Introduction
The Indian financial ecosystem has undergone a significant transformation with the emergence of GIFT Nifty, a rebranded and relocated avatar of the former SGX Nifty. As India sharpens its global financial ambitions through GIFT City (Gujarat International Finance Tec-City), the GIFT Nifty has become a key component of the country’s market-linked globalization strategy.
But how does GIFT Nifty correlate with global indices like the Dow Jones, NASDAQ, FTSE 100, Nikkei 225, Hang Seng, and others? What signals can traders extract from global market trends before the Indian markets open?
This article explores in detail the correlation dynamics, strategic trading implications, and macroeconomic interlinkages between GIFT Nifty and major global indices.
2. Understanding GIFT Nifty
2.1 What is GIFT Nifty?
GIFT Nifty is the derivative contract representing the Nifty 50 index, now traded on the NSE International Exchange (NSE IX), based in GIFT City, Gujarat. It replaced SGX Nifty, which was earlier traded on the Singapore Exchange.
2.2 Trading Timings (as of 2025)
GIFT Nifty offers nearly 21 hours of trading, split into:
Session 1: 06:30 AM to 03:40 PM IST
Break: 03:40 PM to 04:35 PM IST
Session 2: 04:35 PM to 02:45 AM IST (next day)
This extended timing gives Indian and global investors the chance to react to major international events before the NSE opens.
3. Why GIFT Nifty Matters in Global Context
3.1 Price Discovery
Previously, SGX Nifty was used globally to gauge early cues on Indian markets. Now, GIFT Nifty fulfills that role and is even more significant because it's regulated by Indian authorities.
3.2 Liquidity Bridge
Foreign investors prefer GIFT Nifty because of:
Tax neutrality (IFSC jurisdiction)
Global accessibility
Ease of hedging and arbitrage opportunities
3.3 Strategic Global Position
Being open almost all day, GIFT Nifty trades during:
Asian trading hours
European sessions
Part of US session
This makes it a strategic derivative bridge between Indian equity markets and global macro flows.
4. Global Indices Overview: Benchmarks that Influence
Index Country Nature
Dow Jones USA Blue-chip, Industrial
NASDAQ USA Tech-heavy, Growth
S&P 500 USA Broad-market gauge
FTSE 100 UK Multinational, Export-led
DAX Germany Industrial + Auto-heavy
Nikkei 225 Japan Export, Tech-heavy
Hang Seng Hong Kong/China China proxy
Kospi South Korea Semiconductors & Auto
ASX 200 Australia Commodities & Finance
5. Key Correlation Patterns: GIFT Nifty & Global Indices
5.1 US Markets (Dow, NASDAQ, S&P 500)
Time Lag Advantage:
GIFT Nifty's evening session overlaps with the US market opening hours, making it sensitive to Dow/NASDAQ moves.
Risk-On/Risk-Off Trends:
If the NASDAQ or S&P 500 is sharply rising or falling due to earnings, inflation data, or Fed policy, GIFT Nifty reacts instantly.
Example:
Fed raises interest rates → US markets drop → GIFT Nifty falls in Session 2 → Nifty 50 opens gap-down next day.
Correlation Type:
Short-term positive correlation, especially during high-volatility events like CPI data or FOMC meetings.
5.2 European Markets (FTSE 100, DAX, CAC 40)
Mid-Day Influence:
European indices open in the afternoon IST, during GIFT Nifty’s Session 1. Their influence is moderate, often acting as early signals.
Macroeconomic Impact:
German or UK GDP data, ECB policy, or political issues (e.g., Brexit) affect GIFT Nifty during Session 1.
Example:
Weak PMI in Europe → FTSE falls → Risk aversion spreads → GIFT Nifty may drift lower.
Correlation Type:
Indirect correlation; significant during global crises or common central bank themes (e.g., inflation).
5.3 Asian Markets (Nikkei 225, Hang Seng, Kospi, ASX 200)
Morning Cue Providers:
Asian indices open before or along with GIFT Nifty’s Session 1, providing the first directional hint for Indian markets.
China Sentiment Impact:
Hang Seng and Shanghai Composite are highly sensitive to China policy. Their movements impact EM sentiment, which includes India.
Example:
Weak China export data → Hang Seng crashes → GIFT Nifty opens weak → Nifty follows suit.
Correlation Type:
Early session leading indicators, often showing short-term correlation due to regional capital flow sentiments.
6. Real Market Scenarios (Case Studies)
6.1 Fed Rate Hike Day – March 2025
US Market:
Dow fell 500 points post-Fed hawkish tone.
GIFT Nifty Reaction:
Dropped 120 points in the 2nd session.
Next Day NSE Open:
Nifty 50 gapped down by 110 points.
Inference:
Strong US market correlation, with GIFT Nifty acting as a real-time risk indicator for Indian markets.
6.2 China Lockdown News – July 2024
Asian Markets:
Hang Seng fell 4% due to Beijing lockdown.
GIFT Nifty Session 1:
Opened weak and stayed under pressure.
European Markets:
Added to risk-off mood.
Inference:
GIFT Nifty reflected immediate EM sentiment decline, even before Indian equities opened.
7. Correlation Statistics (Indicative)
Index Average Correlation Coefficient (6-Month Daily Returns)*
S&P 500 +0.55 (moderate positive)
NASDAQ +0.47 (tech-led directional link)
Dow Jones +0.52 (risk sentiment)
Nikkei 225 +0.41 (Asian correlation)
Hang Seng +0.48 (China-linked flows)
FTSE 100 +0.35 (weak to moderate)
Note: Correlation coefficients range from -1 (inverse) to +1 (perfect positive). Above +0.4 shows moderate correlation.
8. Correlation Factors: What Drives Interlinkage
8.1 Global Risk Sentiment
Markets move together when there is either extreme fear (e.g., war, recession) or exuberance (e.g., tech rally, global rate cuts).
8.2 Dollar Index (DXY) & US Bond Yields
When the Dollar rises, emerging markets like India often see outflows, affecting GIFT Nifty.
8.3 Crude Oil
India imports >80% of its oil. Rising crude → inflation risk → negative for Indian markets → reflected in GIFT Nifty.
8.4 Institutional Flows
Foreign Institutional Investors (FIIs) hedge positions through GIFT Nifty based on global triggers like Fed policy or earnings in the US.
8.5 Tech & IT Linkage
Indian IT stocks (Infosys, TCS) are correlated with NASDAQ performance due to global outsourcing demand.
Conclusion
The GIFT Nifty’s correlation with global indices is not just statistical—it’s strategic. It acts as a real-time risk barometer for Indian markets, influenced by global capital flows, geopolitical risks, tech trends, and central bank moves. While the correlations vary across geographies, they offer a powerful predictive framework for active traders and investors alike.
By mastering how GIFT Nifty reflects or diverges from global benchmarks like the Dow Jones, NASDAQ, Nikkei, or FTSE, traders can make more informed entry-exit decisions, especially during pre-market and overnight sessions.
Gold, Silver & Commodity Trading (MCX)What is MCX (Multi Commodity Exchange)?
The Multi Commodity Exchange of India Ltd. (MCX) is a government-regulated commodity derivatives exchange, launched in 2003. It is regulated by SEBI (Securities and Exchange Board of India) and allows traders to buy and sell commodity futures contracts across various categories like:
Bullion: Gold, Silver
Energy: Crude oil, Natural gas
Base Metals: Copper, Zinc, Lead, Aluminum, Nickel
Agricultural commodities: Cotton, Cardamom, Mentha Oil
MCX operates similarly to stock exchanges like NSE or BSE but deals in commodity contracts rather than equities.
Factors That Influence Gold & Silver Prices
Understanding price drivers helps traders anticipate market movement:
🏦 1. Global Economic Conditions
Inflation
Recession fears
GDP data
🪙 2. Currency Movements
Gold is priced in USD globally. The USD-INR exchange rate significantly impacts domestic prices.
📉 3. Interest Rates
Rising interest rates make non-yielding assets like gold less attractive, pushing prices lower, and vice versa.
💥 4. Geopolitical Tensions
War, political instability, or crisis (Middle East conflict, Ukraine war, etc.) often boost gold/silver prices.
🛢️ 5. Crude Oil Prices
High oil prices can lead to inflation, making gold more attractive as a hedge.
💼 6. Central Bank Policies
Actions by RBI or Federal Reserve (US) in terms of gold reserves, rate hikes, or monetary policy changes affect sentiment.
"BTC’s Liquidity Grab: Is the Bull Ready to Charge?"🧠 Key Observations:
Break of Structure (BOS):
Multiple BOS levels confirm shifts in market structure from bullish to bearish and back.
The latest BOS near the support zone suggests a possible shift from bearish to bullish trend.
Support & Resistance Zones:
Resistance marked near the 120,241 level, which is also the target zone.
Support is clearly respected around the 114,898 level with price reacting strongly near the equal lows.
Liquidity Hunt:
Price swept the sell-side liquidity below the equal lows around 114,000 and bounced.
This indicates smart money might have collected liquidity before pushing the price higher.
Bearish FVG (Fair Value Gap):
A bearish imbalance around the 117,000 zone acted as a resistance during the previous rally.
Price might revisit this area for a mitigation before continuation to the upside.
Volume Profile (left side):
High volume nodes indicate significant trading interest in that region, confirming key price acceptance zones.
🎯 Expected Move:
If price sustains above the support zone and confirms bullish intent with higher highs, we may see a move towards the target at 119,637 – 120,241 zone.
📌 Conclusion:
Market has potentially formed a liquidity grab and BOS, signaling a bullish reversal. If this structure holds, BTCUSD could target the resistance area. However, if the price breaks below 114,000 again, it might invalidate this bullish setup.

BTCUSD-Eyes 120000 after Liquidity Sweep & Support RetestPrice action on the 15-min chart shows Bitcoin forming a potential bullish continuation after a liquidity sweep below short-term support. Here’s what stands out:
🔹 Triple Tap Support: Price respected a key zone multiple times, hinting at strong buyer interest.
🔹 Post-Sweep Reaction: Sharp recovery followed by consolidation suggests demand re-entered the market.
🔹 SignalPro Context: Leola Lens™ SignalPro highlighted key zones (yellow + orange), offering caution and trend context.
🔹 Projected Path: With price stabilizing above the reclaimed zone, potential upside target aligns with the 120000 region.
📌 Educational Note:
This setup highlights how liquidity collection below support and subsequent recovery can offer clues to short-term directional intent. Always manage risk based on volatility and session context.

Institutional Intraday option Trading High Volume Trades: Institutions trade in huge lots, often influencing Open Interest.
Data-Driven Strategy: Backed by proprietary models, AI, and sentiment analysis.
Smart Order Flow: Institutions use algorithms to hide their positions using Iceberg Orders, Delta Neutral Strategies, and Volatility Skew.
⚙️ Tools & Indicators Used:
Option Chain Analysis
Open Interest (OI) & OI%
Put Call Ratio (PCR)
Implied Volatility (IV)
Max Pain Theory
Gamma Exposure (GEX)
🧠 Common Institutional Strategies:
Covered Calls – Generate income on large stock holdings.
Protective Puts – Hedge downside risk.
Iron Condor / Butterfly Spread – Capture premium with neutral view.
Long Straddle/Strangle – Expecting big move post-news.
Synthetic Longs/Shorts – Replicating stock exposure using options.

Rise of Algorithmic & Momentum-Based Strategy Innovation🧠 Introduction
The world of trading has changed drastically in recent years. Gone are the days when investors made decisions based on gut feeling, tips from friends, or simply following news headlines. Today, technology and data dominate the markets. A big part of this transformation is due to two fast-evolving areas of strategy:
Algorithmic Trading (Algo Trading)
Momentum-Based Trading Strategies
Together, these innovations are not just making trading faster—they're making it smarter, more scalable, and, in some cases, more profitable. Let’s explore this rise of strategy-driven trading in simple, relatable terms.
⚙️ What Is Algorithmic Trading?
Algorithmic trading (or "algo trading") refers to using pre-programmed computer code to buy and sell stocks or other financial assets. These programs follow specific sets of rules and conditions like:
Price movements
Volume changes
Timing of the trade
Technical indicators
News sentiment (in advanced models)
Instead of a human watching charts all day, the algorithm scans multiple assets simultaneously and executes trades at lightning speed when conditions are met.
🔍 Why Is It Popular?
Speed: Algos react in milliseconds.
Accuracy: Reduces human errors.
Discipline: Emotions like fear or greed don’t interfere.
Scalability: Can track hundreds of instruments at once.
⚡ What Is Momentum-Based Trading?
Momentum trading is based on a simple principle:
"What is going up will likely keep going up (at least for a while), and what is going down will keep going down."
Momentum traders try to ride these price trends. They don’t care much about why something is moving—they care that it is moving.
A momentum-based strategy focuses on:
Relative Strength Index (RSI)
Moving Averages
Breakouts above previous highs
Volume surges
In today’s digital world, most momentum strategies are now executed through algorithms, bringing us to the heart of this innovation wave.
💡 Why Is Strategy Innovation Booming in 2025?
1. Availability of Real-Time Data
In the past, getting real-time stock prices or volume data was expensive or difficult. Today, thanks to modern brokers and APIs, anyone can access tick-by-tick data in real time. This has democratized trading innovation.
2. Cloud Computing & Machine Learning
Cloud platforms like AWS, GCP, and Azure now allow even small traders to run complex models. Add machine learning to the mix, and you can build:
Predictive price models
Auto-optimizing strategies
Real-time anomaly detectors
This tech stack is fueling rapid innovation in custom algos and momentum-based systems.
3. Rise of API Brokers
Brokers like Zerodha (via Kite Connect), Upstox, and Dhan offer APIs that allow traders to:
Place trades programmatically
Access order books
Monitor positions via code
This has opened the doors for retail coders and quant enthusiasts to create strategies from their bedrooms—something only institutions could do a decade ago.
4. Market Volatility & Liquidity
Modern markets, especially post-COVID and now with geopolitical unrest, are fast-moving and noisy. Traditional long-term investing sometimes feels too slow. This has created fertile ground for short-term strategies like intraday momentum and algo scalping.
🧬 Types of Momentum-Based Algo Strategies Gaining Popularity
1. Breakout Algos
Entry: When price breaks above a resistance level or 52-week high.
Exit: After achieving target return or on breakdown.
2. Mean Reversion Momentum
Belief: Stocks that over-extend eventually revert back to mean.
Algo buys on dips and sells on peaks, based on Bollinger Bands or Moving Average deviations.
3. Relative Momentum Rotation
Focus: Switch between sectors/stocks showing strongest momentum.
Example: If Auto sector shows higher returns than Pharma over 4 weeks, the algo reallocates capital into Auto.
4. High-Frequency Momentum
Based on volume spikes, price speed, and Level-2 data.
Needs co-location or ultra-low latency to profit from small tick movements.
📊 Real-World Examples (2025 Trends)
Nifty and Bank Nifty Momentum Bots
Retail algo traders now use trend-following strategies on Nifty weekly options, taking intraday calls when the index crosses VWAP + 2%.
SME IPO Listing Day Momentum Plays
Some traders have built algos that scan listing price action and jump in when a stock breaks opening highs with volume.
AI-Augmented Algos
AI-powered bots use NLP (Natural Language Processing) to analyze earnings calls, company announcements, and even tweets. If sentiment is strongly positive, they take long positions.
🧠 Benefits of These Innovations
✅ For Retail Traders:
Better access to tools once exclusive to hedge funds.
Ability to automate their edge.
Save time watching screens all day.
✅ For Institutions:
Lower execution costs.
Scalable strategies across global markets.
Statistical models reduce dependence on human traders.
🧱 Challenges and Limitations
❌ Overfitting in Backtests
Just because a strategy worked in the past doesn't guarantee future success. Many algos “look perfect” in backtests but fail in live trading.
❌ API Latency and Downtime
Retail infrastructure is not as reliable as institutional setups. Brokers may experience order delays or API failures.
❌ Regulation Risk
SEBI and global regulators are watching algo trading closely. Flash crashes or manipulative algos can bring scrutiny and even bans.
❌ Emotional Disengagement
Too much automation can make traders disconnected from market context. Sometimes, manual intervention is needed.
🧭 What’s the Future of These Strategies?
🔮 1. AI + Algo = Self-Learning Bots
The next wave of bots may not follow fixed rules. They may adapt automatically by learning from market behavior—almost like an evolving trader.
🔮 2. Regulation Around Algo Trading
Expect more regulation in 2025–2026 to ensure fairness and stability. SEBI may require audits or sandbox testing before public deployment.
🔮 3. Community-Based Innovation
Open-source algo trading platforms (like Blueshift, QuantConnect, etc.) are becoming collaborative hubs where traders share and upgrade each other's strategies.
🔄 How Can a Retail Trader Start?
✅ Step 1: Learn Python or Use No-Code Platforms
Python is the language of algo trading. If you can’t code, use platforms like AlgoTest, Tradetron, or Streak.
✅ Step 2: Start Small
Begin with paper trading or small capital. Don’t go all-in until you have confidence and historical data.
✅ Step 3: Choose a Clean Strategy
Start with something simple—like RSI + Moving Average crossover, and backtest on Nifty.
✅ Step 4: Track Metrics
Measure win ratio, drawdown, average profit per trade. Good algo traders analyze more than they trade.
✍️ Final Words
The rise of algorithmic and momentum-based strategy innovation is reshaping India’s trading landscape. It’s making the game smarter, faster, and more competitive. But like every tool, it depends on how you use it. These strategies aren’t magic bullets—they're systems that require patience, research, and constant optimization.
For traders willing to invest in knowledge and tools, the opportunities are exciting. For those hoping to “copy-paste” quick riches, the market may prove costly.
In 2025 and beyond, the best traders may not be those with the sharpest eyes—but those with the smartest code.
DOGE Long Swing Setup – Institutional Narrative Heating UpThe Dogecoin narrative is back in focus! Bit Origin ( NASDAQ:BTOG ) is raising $500M to build one of the world’s largest DOGE treasuries—becoming the first U.S.-listed company to treat CRYPTOCAP:DOGE as a core asset. With institutional interest rising, DOGE could see renewed momentum. Our last trade surged 50%—here’s the next entry:
📌 Trade Setup:
• Entry Zone: $0.20 – $0.21
• Take Profit Targets:
o 🥇 $0.23 – $0.24
o 🥈 $0.27 – $0.28
• Stop Loss: Daily close below $0.18
#crypto #DOGE #BTOG

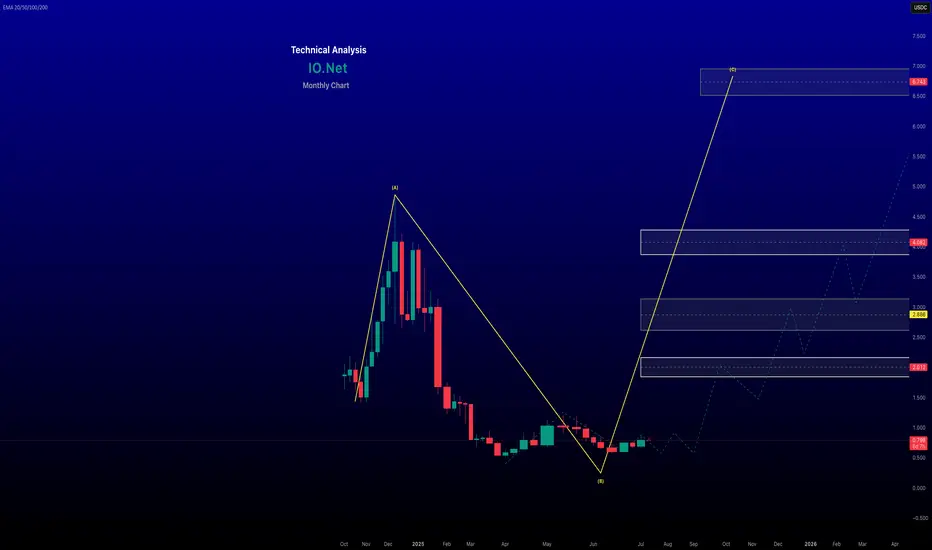
renderwithme | IO.Net Technical Chart for the Next Six Months
Price Prediction for next six Months 2025
Price Range: Based on various forecasts, IO.Net is expected to trade between approximately $0.500 and $1.3 in August 2025. The minimum price could be around $0.400, with a potential peak of $2.
Bullish Scenario: If bullish momentum continues, driven by factors like institutional inflows or positive developments, IO.Net could test the $1 –$2 range or even approach $3 by late August. A breakout and close above $2.200 could trigger a rally toward $3 – $3.8.
Please refer the chart
~~ Disclaimer ~~
This analysis is based on recent technical data and market sentiment from web sources. It is for informational \ educational purposes only and not financial advice. Trading involves high risks, and past performance does not guarantee future results. Always conduct your own research or consult a SEBI-registered advisor before trading.
# Boost and comment will be highly appreciated.
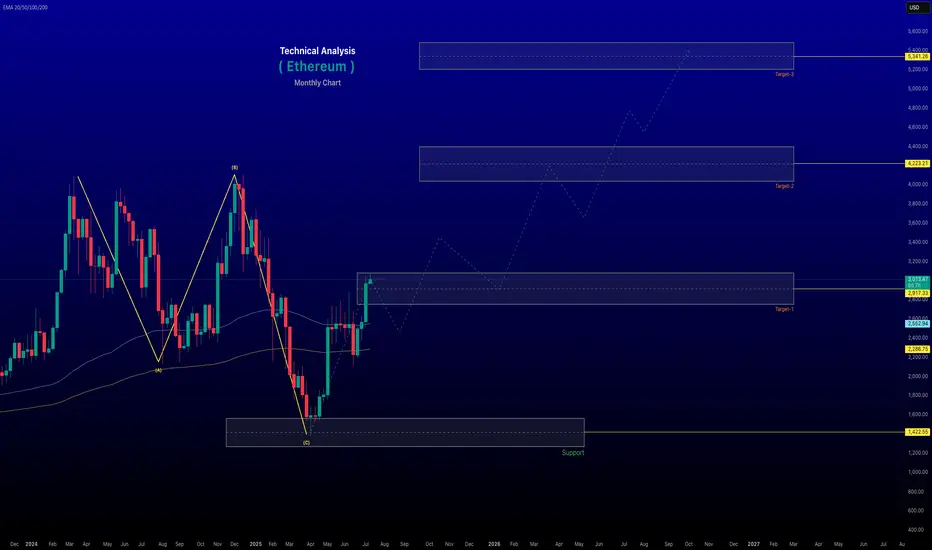
renderwithme | ETH Price Prediction for next six Months 2025
Price Prediction for next six Months 2025
Price Range: Based on various forecasts, Ethereum (ETH) is expected to trade between approximately $2,500 and $3,360 in August 2025. The minimum price could be around $2,519.80, with a potential peak of $3,360.36. The average trading price is projected to be around $2,800–$3,100.
Bullish Scenario: If bullish momentum continues, driven by factors like institutional inflows or positive network developments, ETH could test the $3,150–$3,300 range or even approach $3,500 by late August. A breakout and close above $3,100 could trigger a rally toward $3,550–$3,800.
Bearish Scenario: If market sentiment turns negative, due to macroeconomic uncertainties or regulatory pressures, ETH could dip to $2,470–$2,500, with a potential further decline to $2,400 if support levels fail.
~~ Disclaimer ~~
This analysis is based on recent technical data and market sentiment from web sources. It is for informational \ educational purposes only and not financial advice. Trading involves high risks, and past performance does not guarantee future results. Always conduct your own research or consult a SEBI-registered advisor before trading.
# Boost and comment will be highly appreciated.
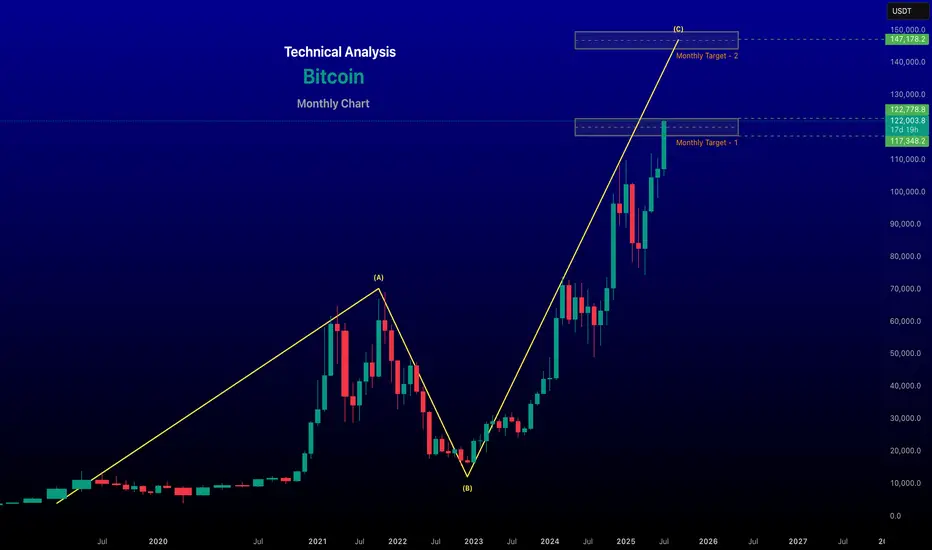
There is some steam still left in BTC!!BTC might still try again to push the levels to complete its sister waves. Whether it will sustain in the future is still yet to be answered.
**This is an educational market outlook, not investment advice. Please consult a SEBI-registered advisor before taking any investment decisions.**
Option TradingInvesting Approach by Institutions
✅ Investment Philosophy:
Long-term horizon
Focus on fundamentals (P/E, ROE, growth)
Sector rotation and macro trends
✅ Allocation Strategies:
Strategic Asset Allocation (SAA)
Tactical Asset Allocation (TAA)
Smart Beta and Factor Investing
Trading Strategies by Institutions
🔹 High-Frequency Trading (HFT)
Executes thousands of trades in milliseconds
Relies on arbitrage, price inefficiencies
🔹 Statistical Arbitrage
Mean-reversion strategies using historical patterns
🔹 Swing & Trend Trading
Use technical indicators like MACD, Moving Averages, RSI

Advance Option Trading Why Institutions Prefer Options
Leverage – Control large positions with small capital
Risk Management – Protect portfolios
Cash Flow – Earn premium income
Volatility Play – Earn from IV rise/fall
Customization – Tailored exposure using exotic options
Core Strategies Used by Institutions
1. Protective Puts
Buy puts to insure large stock holdings against downside risk.
2. Covered Calls
Earn premium income on long-term stock holdings.
3. Calendar Spreads
Take advantage of time decay and volatility differences.
4. Straddles & Strangles
Bet on volatility movement, not direction.
Tools Used by Institutional Option Traders
Bloomberg Terminal – Real-time data, pricing models
Quantitative Models – Black-Scholes, Binomial Trees
Algo Execution – Smart order routing
Risk Management Software – VaR, Greeks analysis
Option Analytics Platforms – Orats, Trade Alert

Option Trading Part-1 What Is Institutional Option Trading?
Institutional Option Trading involves using derivatives (Options) for:
Hedging big equity portfolios
Speculating on volatility or price movement
Arbitrage opportunities
🔹 Key Techniques:
Volatility Arbitrage
Delta-Neutral Hedging
Covered Calls
Protective Puts
Iron Condors & Spreads
How Institutions Use Options Differently
✅ Retail Focus:
Naked calls/puts
Directional trades
Limited capital
✅ Institutional Focus:
Portfolio insurance
Complex multi-leg strategies
Implied Volatility arbitrage
Event-based hedging (like earnings or Fed news)

Option TradingInstitutional Trading – The Backbone of Markets
✅ Who Are Institutional Traders?
They are big market participants such as:
Pension Funds
Insurance Companies
Hedge Funds
Mutual Funds
Foreign Institutional Investors (FIIs)
✅ Why Are They Important?
Provide liquidity in markets
Trade with large volumes
Influence market trends

Institution Option Trading What Is Trading?
Trading refers to buying and selling financial instruments (stocks, options, futures) in financial markets for profit. It can be:
Retail Trading – Done by individual investors.
Institutional Trading – Conducted by large organizations like banks, mutual funds, hedge funds.
What Is Investing?
Investing involves allocating capital with the expectation of long-term wealth generation. It focuses on:
Value appreciation
Dividends or returns over time
Longer holding periods

renderwithme | Bitcoin Technical Analysis for August 2025 # Price Trends: Bitcoin is trading above key exponential moving averages (EMAs) on daily charts (20-day: $108,285; 50-day: $105,843; 100-day: $101,952; 200-day: $95,985), signaling sustained bullish momentum.
# Support and Resistance:Support: $110,000–$111,909 is a critical support zone. A drop below could test $105,000 or $101,000.
# Resistance: $125,724–$126,000 is the next hurdle. A breakout above could target $145,000–$150,000
Chart for your reference
~~ Disclaimer --
This analysis is based on recent technical data and market sentiment from web sources. It is for informational \ educational purposes only and not financial advice. Trading involves high risks, and past performance does not guarantee future results. Always conduct your own research or consult a SEBI-registered advisor before trading.
#Boost and comment will be highly appreciated
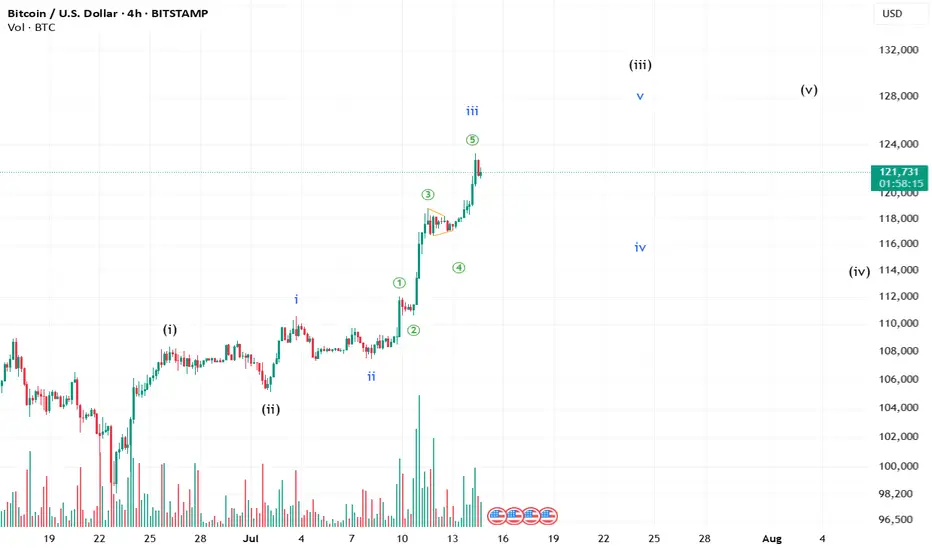
Best Possible Elliott Wave Counts: ETHUSDHello friends,
Welcome RK_Chaarts.
Today we're attempting to analyze Ethereum's chart from an Elliott Wave perspective. Looking at the monthly timeframe chart, we can see that from the beginning, around 2015-2016, when data is available, to the top in 2021 we have a Super Cycle degree Wave (I) marked in blue, which has completed.
Next, June 2022 we have a bottom around $874, marking the end of Super Cycle Wave (II) in blue.
We are now unfolding Wave (III), which should have five sub-divisions. Within this, the red Cycle degree Wave I and Wave II have completed, and we have possibly started the third of third wave.
Monthly:
Moving to a lower timeframe (Weekly) where we observed the completion of blue Wave (II) and the start of Wave (III), we notice that within this, the red Cycle degree Wave I and Wave II have completed, and we've possibly started Wave III of cycle degree marked in Red.
Furthermore, friends, within this third wave, we've marked the black Primary degree Waves ((1)) and ((2)), which we've labeled as Rounded ((1)) and Rounded ((2)). We're assuming these are complete, and Wave ((3)) has started, which is our current working hypothesis.
Weekly:
Now, if we move to a lower timeframe, such as the daily chart, we can see that the Cycle degree Wave II, which ended at 1385.70, has been followed by a Primary degree black Wave ((1)) in Black & Wave ((2)) has pulled back, completing Waves ((1)) and ((2)), and now Primary degree Wave ((3)) has started.
Possible wave counts on Daily
Within Wave ((3)), we expect five Intermediate degree waves. We've marked the first Intermediate degree Wave (1) in blue, which is currently unfolding. If we move to an even lower timeframe, such as the 4-hour chart, we can see that within the Intermediate degree blue Wave (1), there are five Minor degree sub-divisions marked in red. Waves 1 and 2 are complete, and Wave 3 is nearing completion.
Possible wave counts on 4 Hours:
Once Wave 3 is complete, we expect Waves 4 and 5 to follow, completing the Intermediate degree blue Wave (1). After that, we may see a dip in the form of Wave (2), followed by a continuation of the bullish trend as blue Wave (3).
Possible wave counts on 60 Min:
Friends, based on our multi-timeframe analysis, the overall wave structure appears bullish. We've provided snapshots of each timeframe, and you can see the nearest invalidation level marked with a red line.
In this study, we're using Elliott Wave theory and structure, which involves multiple possibilities. The scenario we're presenting seems plausible because it's aligned across multiple timeframes and adheres to Elliott Wave principles. However, please remember that this analysis can be wrong, and you should consult with a financial advisor before making any investment decisions.
This post is shared purely for educational purposes, to illustrate possible Elliott Waves.
I am not Sebi registered analyst.
My studies are for educational purpose only.
Please Consult your financial advisor before trading or investing.
I am not responsible for any kinds of your profits and your losses.
Most investors treat trading as a hobby because they have a full-time job doing something else.
However, If you treat trading like a business, it will pay you like a business.
If you treat like a hobby, hobbies don't pay, they cost you...!
Hope this post is helpful to community
Thanks
RK💕
Disclaimer and Risk Warning.
The analysis and discussion provided on in.tradingview.com/u/RK_Chaarts/ is intended for educational purposes only and should not be relied upon for trading decisions. RK_Chaarts is not an investment adviser and the information provided here should not be taken as professional investment advice. Before buying or selling any investments, securities, or precious metals, it is recommended that you conduct your own due diligence. RK_Chaarts does not share in your profits and will not take responsibility for any losses you may incur. So Please Consult your financial advisor before trading or investing.

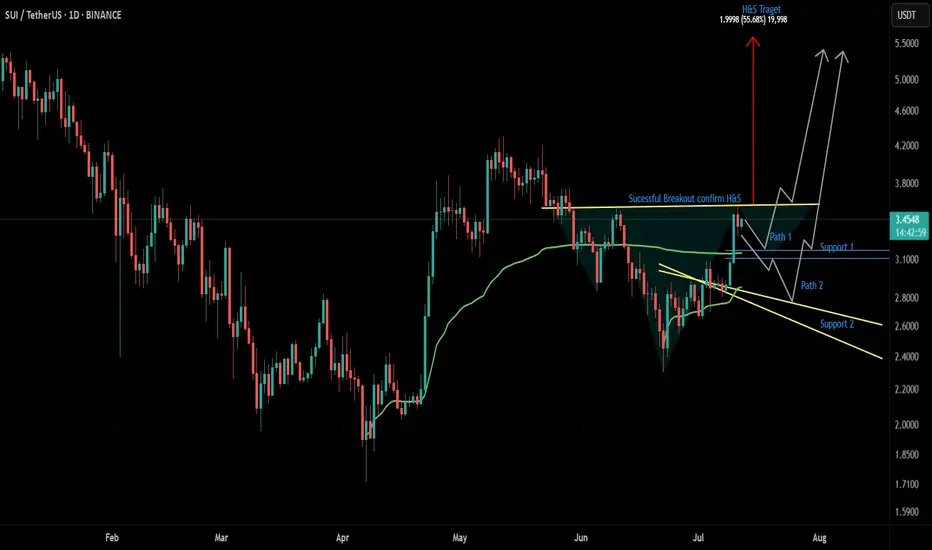
$SUI Inverse H&S FormingA large inverse Head & Shoulders pattern appears to be forming on $SUI. The $3.1758 zone looks like a solid area to long — potentially marking the bottom of the second shoulder. If a deeper correction occurs, I'm also watching the $2.7473 level for another possible long entry.
My plan is to pre-position by longing near the second shoulder. Once $3.5902 breaks and we get a successful retest, the pattern would be confirmed. From there, a 50% move up toward the neckline target of $5.6252 could follow.
This is not financial advice. Trade at your own risk.