Option TradingInstitutional Trading – The Backbone of Markets
✅ Who Are Institutional Traders?
They are big market participants such as:
Pension Funds
Insurance Companies
Hedge Funds
Mutual Funds
Foreign Institutional Investors (FIIs)
✅ Why Are They Important?
Provide liquidity in markets
Trade with large volumes
Influence market trends
Cryptomarket

Institution Option Trading What Is Trading?
Trading refers to buying and selling financial instruments (stocks, options, futures) in financial markets for profit. It can be:
Retail Trading – Done by individual investors.
Institutional Trading – Conducted by large organizations like banks, mutual funds, hedge funds.
What Is Investing?
Investing involves allocating capital with the expectation of long-term wealth generation. It focuses on:
Value appreciation
Dividends or returns over time
Longer holding periods

renderwithme | Bitcoin Technical Analysis for August 2025 # Price Trends: Bitcoin is trading above key exponential moving averages (EMAs) on daily charts (20-day: $108,285; 50-day: $105,843; 100-day: $101,952; 200-day: $95,985), signaling sustained bullish momentum.
# Support and Resistance:Support: $110,000–$111,909 is a critical support zone. A drop below could test $105,000 or $101,000.
# Resistance: $125,724–$126,000 is the next hurdle. A breakout above could target $145,000–$150,000
Chart for your reference
~~ Disclaimer --
This analysis is based on recent technical data and market sentiment from web sources. It is for informational \ educational purposes only and not financial advice. Trading involves high risks, and past performance does not guarantee future results. Always conduct your own research or consult a SEBI-registered advisor before trading.
#Boost and comment will be highly appreciated
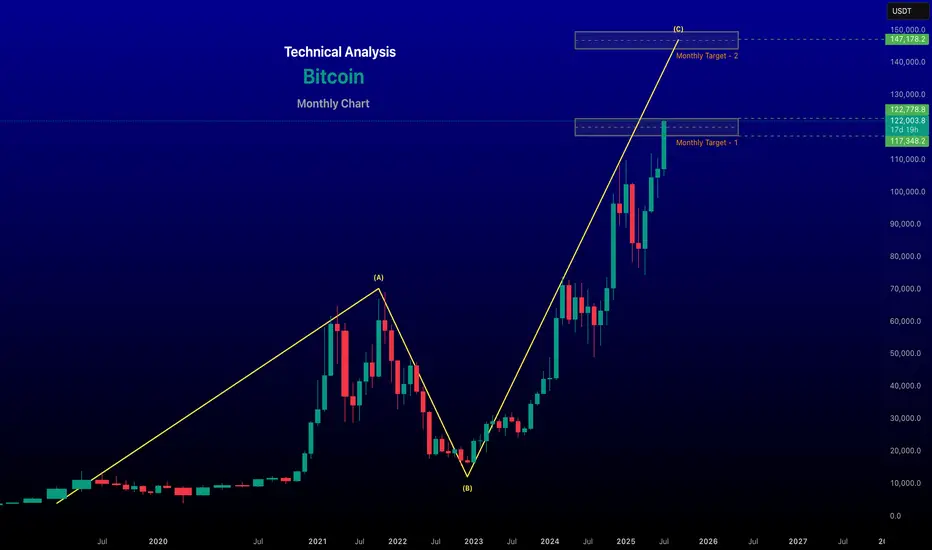
Best Possible Elliott Wave Counts: ETHUSDHello friends,
Welcome RK_Chaarts.
Today we're attempting to analyze Ethereum's chart from an Elliott Wave perspective. Looking at the monthly timeframe chart, we can see that from the beginning, around 2015-2016, when data is available, to the top in 2021 we have a Super Cycle degree Wave (I) marked in blue, which has completed.
Next, June 2022 we have a bottom around $874, marking the end of Super Cycle Wave (II) in blue.
We are now unfolding Wave (III), which should have five sub-divisions. Within this, the red Cycle degree Wave I and Wave II have completed, and we have possibly started the third of third wave.
Monthly:
Moving to a lower timeframe (Weekly) where we observed the completion of blue Wave (II) and the start of Wave (III), we notice that within this, the red Cycle degree Wave I and Wave II have completed, and we've possibly started Wave III of cycle degree marked in Red.
Furthermore, friends, within this third wave, we've marked the black Primary degree Waves ((1)) and ((2)), which we've labeled as Rounded ((1)) and Rounded ((2)). We're assuming these are complete, and Wave ((3)) has started, which is our current working hypothesis.
Weekly:
Now, if we move to a lower timeframe, such as the daily chart, we can see that the Cycle degree Wave II, which ended at 1385.70, has been followed by a Primary degree black Wave ((1)) in Black & Wave ((2)) has pulled back, completing Waves ((1)) and ((2)), and now Primary degree Wave ((3)) has started.
Possible wave counts on Daily
Within Wave ((3)), we expect five Intermediate degree waves. We've marked the first Intermediate degree Wave (1) in blue, which is currently unfolding. If we move to an even lower timeframe, such as the 4-hour chart, we can see that within the Intermediate degree blue Wave (1), there are five Minor degree sub-divisions marked in red. Waves 1 and 2 are complete, and Wave 3 is nearing completion.
Possible wave counts on 4 Hours:
Once Wave 3 is complete, we expect Waves 4 and 5 to follow, completing the Intermediate degree blue Wave (1). After that, we may see a dip in the form of Wave (2), followed by a continuation of the bullish trend as blue Wave (3).
Possible wave counts on 60 Min:
Friends, based on our multi-timeframe analysis, the overall wave structure appears bullish. We've provided snapshots of each timeframe, and you can see the nearest invalidation level marked with a red line.
In this study, we're using Elliott Wave theory and structure, which involves multiple possibilities. The scenario we're presenting seems plausible because it's aligned across multiple timeframes and adheres to Elliott Wave principles. However, please remember that this analysis can be wrong, and you should consult with a financial advisor before making any investment decisions.
This post is shared purely for educational purposes, to illustrate possible Elliott Waves.
I am not Sebi registered analyst.
My studies are for educational purpose only.
Please Consult your financial advisor before trading or investing.
I am not responsible for any kinds of your profits and your losses.
Most investors treat trading as a hobby because they have a full-time job doing something else.
However, If you treat trading like a business, it will pay you like a business.
If you treat like a hobby, hobbies don't pay, they cost you...!
Hope this post is helpful to community
Thanks
RK💕
Disclaimer and Risk Warning.
The analysis and discussion provided on in.tradingview.com/u/RK_Chaarts/ is intended for educational purposes only and should not be relied upon for trading decisions. RK_Chaarts is not an investment adviser and the information provided here should not be taken as professional investment advice. Before buying or selling any investments, securities, or precious metals, it is recommended that you conduct your own due diligence. RK_Chaarts does not share in your profits and will not take responsibility for any losses you may incur. So Please Consult your financial advisor before trading or investing.

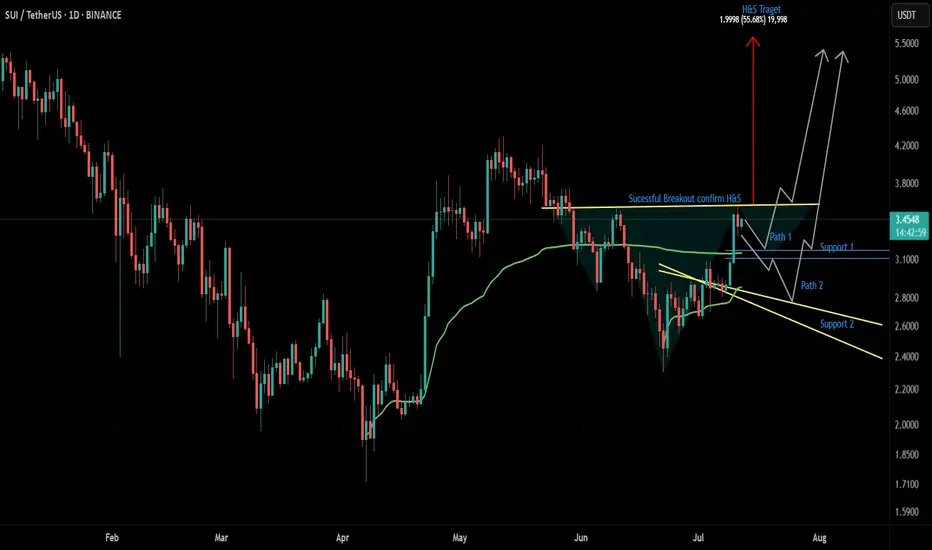
$SUI Inverse H&S FormingA large inverse Head & Shoulders pattern appears to be forming on $SUI. The $3.1758 zone looks like a solid area to long — potentially marking the bottom of the second shoulder. If a deeper correction occurs, I'm also watching the $2.7473 level for another possible long entry.
My plan is to pre-position by longing near the second shoulder. Once $3.5902 breaks and we get a successful retest, the pattern would be confirmed. From there, a 50% move up toward the neckline target of $5.6252 could follow.
This is not financial advice. Trade at your own risk.
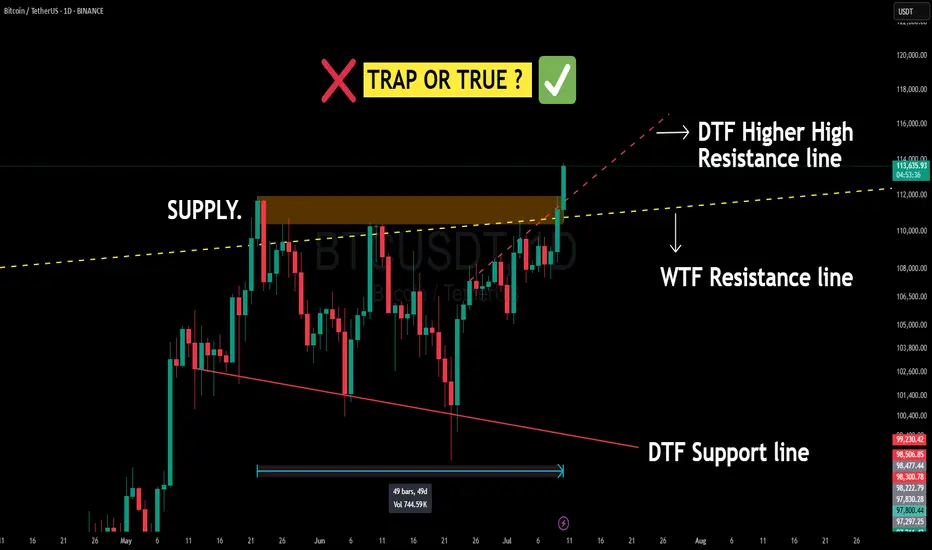
BITCOIN Just Smashed a 50-Day Supply Wall — Breakout or Fakeout Bitcoin (BTC/USDT) on the Daily & Weekly Timeframe just pulled off something BIG:
✅ Broke out of a 50-day consolidation range
✅ Closed above a strong Daily supply zone
✅ Cracked both DTF & WTF resistance lines (including a higher-high dynamic DTF resistance)
✅ Volume confirmation with a strong green candle
📌 This is an extremely bullish structure for short-term scalping ideas.
But Wait — What’s Happening Technically?
Supply Zone: This orange box is where BTC got sold off multiple times before. Breaking above this = strong bullish intent.
⚠️ Caution: Bitcoin is the King of Fakeouts 👑🐍
BTC has a notorious nature for false breakouts, trapping both bulls and bears. That’s why:
🧠 Best Strategy = Trap Trading OR
⏳ Wait for a pullback and retest of broken zones on higher timeframes . Plan your trade - trade your plan .
Don't chase — let price come to you.
💬 Drop your thoughts / doubts in comments.
📌 Not financial advice — just me and my Emotions
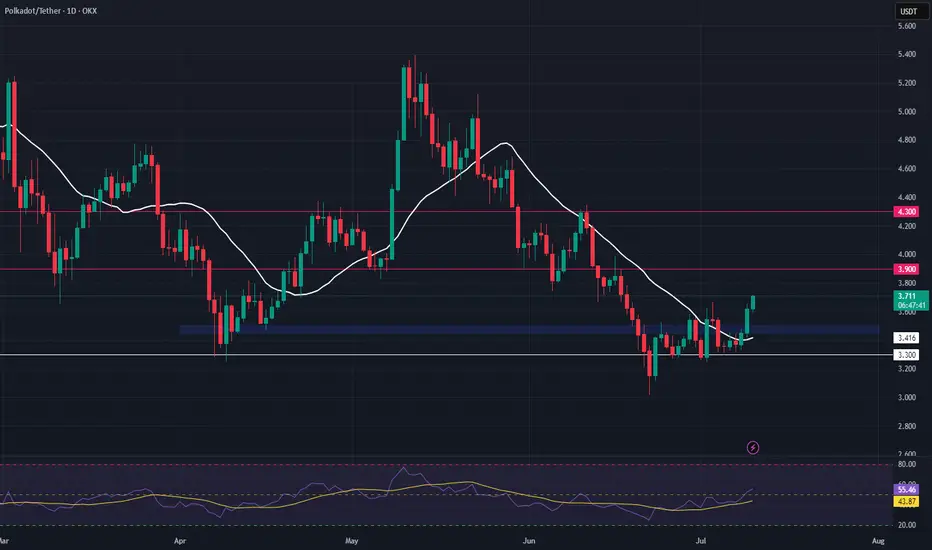
DOT Long Swing Setup – Structural Recovery with Support RetestDOT is showing early signs of recovery, reclaiming its 20-day SMA and flipping key horizontal resistance into support. We’re now watching for a retest of the $3.45–$3.50 zone to confirm the level and trigger a long entry.
📌 Trade Setup:
• Entry Zone: $3.45 – $3.50
• Take Profit Targets:
o 🥇 $3.90
o 🥈 $4.30
• Stop Loss: Daily candle close below $3.33
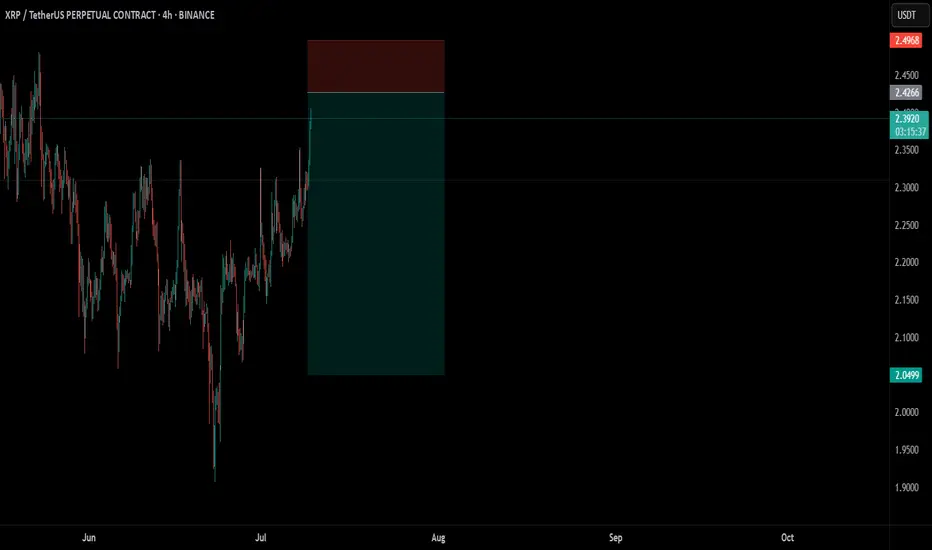
XRP Short OpprtunityThe $2.4261 level looks like an attractive entry point for a small CRYPTOCAP:XRP short position, as it aligns with a historical demand zone.
This is not financial advice. Always trade at your own risk.
ETH Long Setup: Key Support Zone at $2,453.72The $2,453.72 zone on CRYPTOCAP:ETH looks promising for our next potential long setup.
It’s a key support level and holds significant liquidity—definitely a zone worth watching.
This is not financial advice. Always trade at your own risk.

$BTC Potential Longing OpportunityWe’ve successfully opened our previous long position at $105,398.80.
What’s next?
I’m currently eyeing the $106,335.70 – $106,716.90 range as a potential zone for the next long entry. Price may retest this area before continuing its move to the upside.
This is not financial advice. Always trade at your own risk.

Institutional Master classOption Trading Basics
Call vs Put Options Detailed
In-the-Money (ITM), At-the-Money (ATM), Out-of-the-Money (OTM)
Options Greeks: Delta, Gamma, Theta, Vega, Rho – controlling price sensitivity.
Understanding Option Premium Breakup
Option Strategies
Single-Leg Strategies: Buying Calls, Buying Puts
Multi-Leg Strategies:
Bull Call Spread
Bear Put Spread
Iron Condor
Straddle and Strangle
Hedging Techniques: How institutions and traders use options to hedge positions.
Option Chain Analysis
Reading Option Chain Data
Open Interest (OI) & Change in OI
IV (Implied Volatility) Impact
PCR (Put-Call Ratio) Analysis for Market Sentiment

Option Trading ClassThe Institutional Trading Process is highly strategic and complex, combining deep research, advanced technology, and strict compliance. Institutions leverage their size and tools to execute efficiently without heavily impacting the market.
Introduction to Option Trading
What are Options?
Options are contracts giving the right, but not the obligation, to buy (Call) or sell (Put) an underlying asset at a predetermined price within a specific time.
Types of Options:
Call Option: Right to buy
Put Option: Right to sell
Key Terms:
Strike Price, Premium, Expiry Date, Lot Size, Intrinsic Value, Time Value

Trading Master ClassPost-Trade Processing
Clearing and Settlement: Trades are cleared by clearing houses and settled typically on T+1 or T+2 basis.
Regulatory Reporting: All trades must be reported for transparency and compliance.
Performance Review and Compliance
Evaluation: Execution quality, cost efficiency, and market impact are reviewed.
Audit Trails: Maintain detailed records for regulatory bodies like SEBI, SEC, etc.
Continuous Improvement: Algorithms and strategies are refined based on trade performance.
Key Components in Institutional Trading
Liquidity Management: Large trades need sufficient liquidity to avoid market disruption.
Algorithmic Support: Automated systems manage trade slicing and timing.
Risk Control: Continuous monitoring of exposure, slippage, and adverse market moves.

Institutional Trading 1. Investment Idea Generation
How it Starts: Analysts, portfolio managers, or quantitative teams identify potential trades based on in-depth research, financial models, or market events.
Key Drivers: Economic indicators, earnings reports, sector performance, geopolitical news, or algorithmic signals.
2. Pre-Trade Analysis and Risk Assessment
Objective: Assess liquidity, volatility, and execution risks.
Tools Used: Option chains, order books, volume profiles, VWAP (Volume Weighted Average Price), and market depth analysis.
Risk Teams: Ensure the trade aligns with the fund’s risk appetite and regulatory requirements.

Option Trading Order Strategy Design
Execution Planning: Institutions cannot place large orders directly; they split trades into smaller lots to avoid price impact.
Techniques:
Algorithmic Trading (TWAP, VWAP, Iceberg orders)
Dark Pool Execution
Block Trades via Brokers
Trade Execution
Methods: Trades are routed through brokers, electronic communication networks (ECNs), or proprietary trading desks.
Real-Time Monitoring: Institutions monitor slippage, transaction costs, and market reaction continuously.

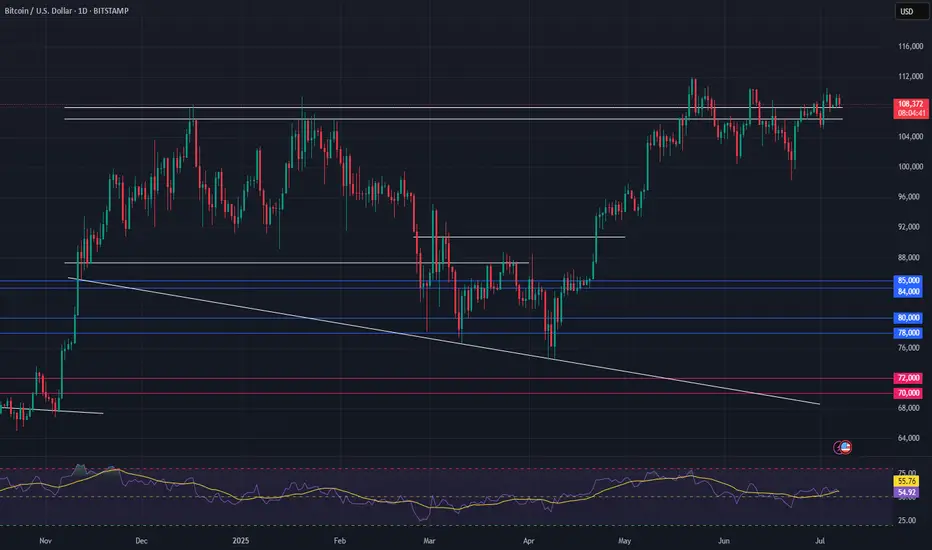
Bitcoin Eyes Breakout — Bullish Setup Gathers StrengthConsolidation Above Key Support:
Bitcoin continues to hold firmly above the $100,000–$105,000 support zone, a critical area that acted as major resistance earlier in 2025. This sustained price action reinforces the prevailing bullish momentum and signals strength beneath the surface.
Wedge Formation Nearing Resolution:
The prolonged wedge pattern now taking shape suggests a substantial move is imminent. The structure supports a breakout scenario, with an initial target of $130,000–$135,000 in play.
Uptrend Intact, No Signs of Exhaustion:
Despite recent weeks of sideways action, Bitcoin continues to consolidate near its highs—a pattern that historically favors continuation, not reversal. The broader trend remains upward and firmly intact.
Focus & Opportunity:
Bitcoin's technical setup justifies close attention in the days ahead. At the same time, traders and investors should keep an eye on select altcoins, which could offer amplified upside as capital rotation picks up momentum.
#Bitcoin #BTC #Crypto #TechnicalAnalysis #BullishSetup #WedgeBreakout #PriceAction #Altcoins #CryptoMarket #MarketUpdate #AllTimeHigh
Institutional Trading ProcessInstitutional Trading Process
1. Research and Strategy Development
Extensive quantitative research.
Backtesting models.
Scenario analysis using risk management software.
2. Trade Execution
Executing trades via dark pools to prevent market impact.
Using smart order routers for best price execution.
3. Risk Management
Continuous monitoring of positions.
Real-time adjustments using delta-hedging.
Portfolio diversification to spread risk.
4. Reporting and Compliance
Institutional trades are heavily regulated.
Detailed reporting to regulatory bodies like SEBI, SEC, etc.

Institutional Objectives in Options TradingInstitutional Objectives in Options Trading
1. Hedging
Institutions use options to protect large portfolios from adverse price movements.
Example: A fund holding a large stock position may buy put options as insurance.
2. Speculation
Institutions speculate on short-term market movements with directional bets using options.
Example: Buying call options in anticipation of a stock rally.
3. Arbitrage
Institutions exploit pricing inefficiencies in the options market for risk-free profit.
Example: Engaging in index arbitrage or dividend arbitrage strategies.
4. Income Generation
By selling options, institutions generate consistent premium income.
Example: Writing covered calls on long equity positions.
Tools and Techniques Used by Institutions
1. Advanced Option Strategies
Spreads: Vertical, horizontal, and diagonal spreads to limit risk.
Straddles and Strangles: To profit from high volatility.
Iron Condors and Butterflies: To capture premium in low volatility.
2. Option Greeks Management
Institutional traders rely heavily on managing option Greeks:
Delta: Sensitivity to price changes in the underlying asset.
Gamma: Rate of change of Delta.
Theta: Time decay impact.
Vega: Sensitivity to volatility changes.
Rho: Sensitivity to interest rate changes.
3. Technology and Algorithms
Institutions employ high-frequency trading (HFT) systems and algorithmic strategies to execute options trades efficiently and capitalize on minute price movements.
4. Implied Volatility and Open Interest Analysis
Institutions use implied volatility (IV) and open interest (OI) as key indicators to gauge market sentiment and structure complex multi-leg strategies accordingly.

Institution Option TradingInstitutional options trading refers to the large-scale use of options by financial institutions such as hedge funds, mutual funds, pension funds, banks, insurance companies, and proprietary trading firms. Unlike retail traders, institutional participants possess significant capital, advanced technology, and deep market insight, enabling them to deploy complex options strategies for hedging, speculation, and arbitrage purposes.
Institutional options trading plays a crucial role in shaping market dynamics. These large entities can influence volatility, liquidity, and price movements due to the size and frequency of their trades. Understanding how institutional traders operate provides retail traders with key insights to align their strategies effectively.
The Foundation of Options Trading
1. Understanding Options
Options are derivative contracts that give the buyer the right, but not the obligation, to buy or sell an underlying asset at a predetermined price (strike price) within a specified time frame.
Types of Options:
Call Options: Provide the right to buy.
Put Options: Provide the right to sell.
2. Key Option Terminologies
Premium: Price paid to buy the option.
Strike Price: Predetermined price to buy/sell the underlying asset.
Expiration Date: Last date the option can be exercised.
In-the-Money (ITM): Option with intrinsic value.
Out-of-the-Money (OTM): Option with no intrinsic value.

Technical ClassCandlestick patterns are essential tools in technical analysis that help traders predict potential market movements based on price action. Each candlestick represents four key data points: Open, High, Low, and Close prices within a specific time frame.
Types of Candlestick Patterns:
1. Single Candlestick Patterns
Doji: Market indecision (Open ≈ Close)
Hammer: Bullish reversal, long lower wick
Shooting Star: Bearish reversal, long upper wick
Spinning Top: Market indecision, small body
2. Double Candlestick Patterns
Bullish Engulfing: Strong bullish reversal
Bearish Engulfing: Strong bearish reversal
Tweezer Bottom/Top: Reversal signals
3. Triple Candlestick Patterns
Morning Star: Bullish reversal (3 candles)
Evening Star: Bearish reversal (3 candles)
Three White Soldiers: Strong bullish continuation
Three Black Crows: Strong bearish continuation
✅ Importance in Trading:
Predict Trend Reversals
Identify Continuation Patterns
Spot Market Sentiment Early

Trading with Professionalsnvesting Basics
Investing involves allocating money into assets with the expectation of generating income or profit over time. Unlike trading, investing usually focuses on long-term wealth building.
Investment Vehicles:
Stocks: Equity ownership in companies.
Bonds: Fixed-income securities.
Mutual Funds: Pooled investments managed by professionals.
ETFs: Funds that track indices and can be traded like stocks.
Real Estate: Property investments.
Investment Strategies:
Value Investing: Buying undervalued stocks.
Growth Investing: Investing in companies with high growth potential.
Dividend Investing: Focusing on stocks that provide regular income.
Risk Management in Investing:
Diversification across sectors and asset classes.
Regular portfolio rebalancing.
Long-term focus to absorb short-term volatility

Institutional TradingDivergence Trading
Divergence trading is a technical strategy based on the observation that asset prices and their related indicators (like RSI, MACD, etc.) sometimes move in opposite directions.
Types of Divergence:
Regular Divergence: Predicts potential trend reversals.
Hidden Divergence: Suggests trend continuation.
Tools Used:
Relative Strength Index (RSI)
Moving Average Convergence Divergence (MACD)
Stochastic Oscillator
How Divergence Works:
If prices are making new highs but the indicator isn’t, it signals weakening momentum and a possible reversal.
If prices are making new lows but the indicator isn’t, it could indicate that selling pressure is fading.
Benefits:
Early identification of potential trend changes.
Effective in volatile markets.
Risks:
False signals can occur, leading to premature trade entries.

Master Institutional TradingBenefits of Option Trading:
Leverage with less capital.
Hedging against market risks.
Income generation through premium collection.
Risks of Option Trading:
Complex pricing structures.
Potential for significant losses if not properly managed.
Divergence Trading
Divergence trading is a technical strategy based on the observation that asset prices and their related indicators (like RSI, MACD, etc.) sometimes move in opposite directions.
