ETHUSD 45-Min Chart — Counter-Trend Long From Demand After Major
Chart Analysis:
Market Structure:
Ethereum broke decisively below the 2,855 resistance zone, confirming a bearish structure shift. The move down was impulsive, followed by weak consolidation — classic distribution → continuation behavior.
Support / Demand Zone:
Price is reacting around 2,485–2,520, a highlighted demand area. This zone aligns with the first strong base formed after the sell-off, making it a high-interest reaction level.
Current Price Action:
ETH is printing long lower wicks into support, suggesting seller exhaustion and early dip-buying. However, structure is still bearish until a reclaim occurs.
Entry Logic:
The marked entry near ~2,490–2,510 assumes:
Support holds
A short-term higher low forms
Momentum flips on lower timeframes
Upside Targets:
TP1: ~2,690 (range equilibrium / liquidity grab)
TP2: ~2,740 (previous consolidation + minor resistance)
Final Target: ~2,855 major resistance (breakdown origin)
Invalidation:
A clean breakdown and close below 2,480 invalidates the long bias and opens continuation toward lower liquidity.
Bias Summary:
Trade Type: Counter-trend bounce
Risk Profile: Higher risk, higher R:R
Trend Context: Bearish until 2,855 is reclaimed
Cryptomarketcap

Introduction to Cryptocurrency and Digital AssetsBlockchain Technology: The Backbone
At the heart of cryptocurrencies is blockchain technology, a distributed ledger system that records all transactions across a network of computers. A blockchain consists of a chain of blocks, each containing transaction data, timestamp, and a cryptographic hash of the previous block. This design ensures:
Transparency: All transactions are visible to network participants.
Security: Cryptographic algorithms protect against fraud and unauthorized alterations.
Decentralization: No single entity controls the ledger, reducing the risk of manipulation.
Immutability: Once recorded, transactions cannot be changed or deleted.
Beyond just financial transactions, blockchain enables smart contracts—self-executing agreements coded into the blockchain—which expand the utility of digital assets into areas like decentralized finance (DeFi), supply chain management, and digital identity verification.
Types of Cryptocurrencies and Digital Assets
1. Cryptocurrencies:
Cryptocurrencies are digital currencies designed to work as a medium of exchange. They include:
Bitcoin (BTC): The first and most well-known cryptocurrency, used as a store of value and medium of exchange.
Ethereum (ETH): A platform cryptocurrency that enables smart contracts and decentralized applications (dApps).
Stablecoins: Cryptocurrencies pegged to fiat currencies like USD (e.g., USDT, USDC), designed to reduce volatility.
Altcoins: Alternative cryptocurrencies with varied purposes, such as Ripple (XRP) for cross-border payments or Cardano (ADA) for sustainable blockchain operations.
2. Digital Tokens:
These are blockchain-based units that can represent a variety of assets:
Utility Tokens: Provide access to a platform or service, like Binance Coin (BNB) for exchange fee reductions.
Security Tokens: Represent ownership of real-world assets such as shares, bonds, or real estate, regulated under securities laws.
Non-Fungible Tokens (NFTs): Unique tokens representing ownership of digital or physical items like art, music, or collectibles.
3. Tokenized Assets:
Blockchain allows real-world assets—stocks, real estate, commodities—to be converted into digital form, making them easier to trade, fractionalize, and secure.
Use Cases of Cryptocurrencies and Digital Assets
Financial Transactions and Remittances:
Cryptocurrencies enable peer-to-peer payments without intermediaries, reducing fees and transaction times for international transfers.
Decentralized Finance (DeFi):
DeFi platforms use smart contracts to offer banking services like lending, borrowing, and yield farming without traditional banks.
Digital Ownership and NFTs:
NFTs revolutionize digital ownership, allowing artists, gamers, and content creators to monetize their digital creations and maintain provable ownership.
Investment and Speculation:
Cryptocurrencies and digital assets are increasingly seen as investment vehicles, attracting both retail and institutional investors seeking diversification and high returns.
Cross-Border Payments and Financial Inclusion:
Cryptocurrencies provide access to financial systems for unbanked populations, offering secure and cost-effective cross-border transactions.
Supply Chain and Identity Verification:
Blockchain’s transparency ensures traceability of goods, anti-counterfeiting measures, and secure digital identities.
Advantages of Cryptocurrencies and Digital Assets
Decentralization reduces reliance on central banks and financial institutions.
Transparency and security make financial operations more trustworthy.
Efficiency in cross-border transactions and settlements.
Innovation potential with smart contracts and tokenization.
Financial inclusion, particularly in regions with limited access to banking.
Challenges and Risks
Despite their promise, cryptocurrencies and digital assets face significant challenges:
Volatility: Prices can fluctuate wildly, making them risky for investors and unstable as currencies.
Regulatory Uncertainty: Governments vary in their approach to regulation, ranging from outright bans to active adoption.
Security Concerns: Hacks, scams, and loss of private keys pose risks to users.
Scalability Issues: Popular networks like Ethereum have faced congestion and high transaction fees.
Environmental Impact: Proof-of-work-based cryptocurrencies, such as Bitcoin, consume enormous amounts of energy.
Adoption Barriers: Limited understanding, technological literacy, and infrastructure issues slow mainstream adoption.
Regulation and Legal Landscape
Governments worldwide are exploring how to regulate cryptocurrencies and digital assets to prevent fraud, money laundering, and market manipulation while enabling innovation. Regulatory approaches include:
Licensing cryptocurrency exchanges.
Taxation on transactions and holdings.
Oversight of stablecoins and digital banking platforms.
Creating central bank digital currencies (CBDCs) as regulated alternatives.
Countries like Japan and Switzerland have embraced crypto-friendly regulations, whereas others like China have restricted trading and mining activities.
Future of Cryptocurrencies and Digital Assets
The future of digital assets is promising but uncertain. Key trends include:
Integration with traditional finance: Banks and financial institutions are increasingly exploring crypto custody, trading, and payment systems.
Expansion of DeFi: More financial services may migrate to decentralized networks.
Tokenization of assets: Ownership of real-world assets will become more flexible, liquid, and transparent.
CBDCs and hybrid models: Central banks are exploring digital currencies that combine regulation with blockchain efficiency.
Greater mainstream adoption: Merchants, consumers, and enterprises may increasingly accept cryptocurrencies for payments and investments.
The evolution of cryptocurrency and digital assets could redefine how value is stored, transferred, and created globally, challenging traditional financial systems while opening new opportunities for innovation, inclusion, and efficiency.
Conclusion
Cryptocurrencies and digital assets represent a revolutionary shift in the way people perceive and interact with money, ownership, and digital ecosystems. While they bring enormous opportunities for financial innovation, inclusion, and efficiency, they also carry inherent risks related to volatility, security, and regulation. The continued development of blockchain technology, smart contracts, tokenization, and decentralized finance is likely to shape the future of global finance, making it more transparent, accessible, and efficient. As adoption grows, understanding the fundamentals, potential, and pitfalls of cryptocurrencies and digital assets is essential for investors, policymakers, and the general public alike.
BTC 1H: Rejection at Supply, Bearish Continuation RiskChart Analysis (1H BTC/USD):
Major Supply Zone (~90,000–90,200):
Price was strongly rejected from this area, confirming it as a key overhead resistance. Sellers remain active here.
Fair Value Gap (FVG) / Mid Resistance (~89,000–89,500):
The red FVG zone above current price acts as a likely pullback target, but also a strong sell zone if revisited.
Current Structure:
After the rejection, BTC broke down and is consolidating below short-term EMAs, indicating bearish momentum on the 1H timeframe.
Key Support Zones:
Near-term demand: ~86,700
Major downside target: ~84,600
Loss of the 86.7k support increases probability of a deeper move toward 84.6k.
Projected Path:
The dotted projection suggests a possible pullback into resistance (87.8k–89k) followed by continuation lower, unless price reclaims and holds above the FVG.
Bias:
Below 89k: Bearish / sell rallies
Above 90.2k: Bearish bias invalidated, trend may shift bullish

ETH 1H Outlook: Key Support Retest With Potential Downside RiskKey observations:
1. Support Level Under Pressure
ETH is retesting this support multiple times.
The annotation suggests: “SUPPORT IF BREAKS THEN WE CAN SEE MORE DOWNWORD” — meaning a breakdown could trigger further selling.
2. Downside Targets
If the current support fails, the next liquidity zones highlighted are:
FVG (Fair Value Gap) around $2,950–$2,900
Extreme POI zone around $2,880–$2,850
Major support at $2,787 (marked as “next support”).
3. Upside Scenario
If support holds, ETH could bounce toward:
$3,078
$3,134
High resistance around $3,225
4. Market Structure
Several CHoCH and BOS labels indicate mixed structure, showing recent weakness but with potential for rebound if buyers defend support strongly.

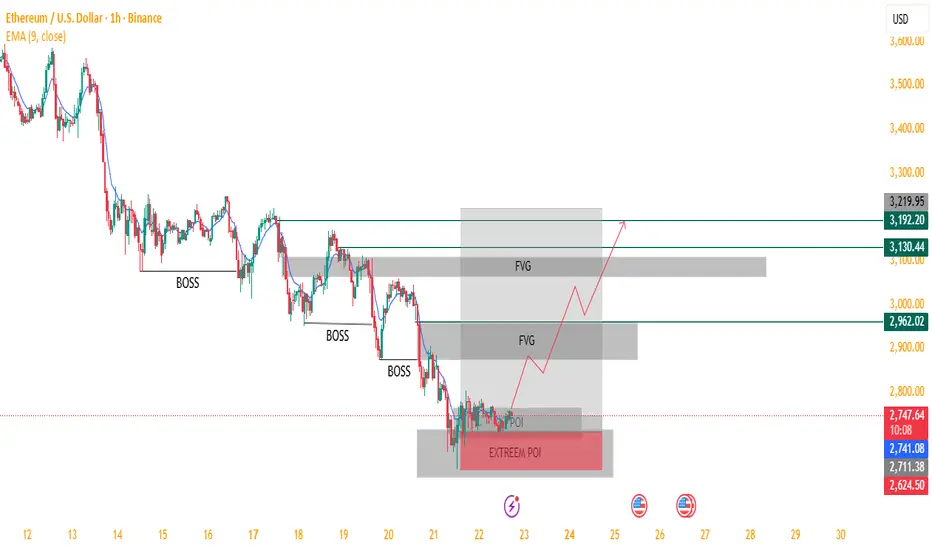
ETH/USD – Potential Bullish Reversal from Extreme POI !Analysis:
The chart suggests Ethereum is currently trading inside a strong Extreme Point of Interest (POI) after a series of Breaks of Structure (BOSS) to the downside. Price has entered a demand zone that may trigger a bullish reversal.
Key observations:
Downtrend Structure: Multiple BOSS confirmations show sustained bearish momentum leading into the Extreme POI.
Extreme POI (Demand Zone): Price is consolidating inside a deep demand area marked in red, indicating potential accumulation by buyers.
POI Reaction Expected: If price maintains support here, a bullish reversal is likely.
Fair Value Gaps (FVG):
Two major FVGs above act as logical bullish targets for price inefficiency fill.
Projected Price Path:
The drawn projection suggests:
Short-term bounce from POI
Breakout structure upward
Continuation toward higher FVG fills around $2,962, $3,130, and possibly $3,192 – $3,220.
Bias:
▶ Bullish, as long as price remains above the Extreme POI.
A breakdown below would invalidate the setup and continue the downtrend.
This is a strong smart-money style setup with a clean narrative:
Demand → Break of structure → FVG fill → Higher targets.
Crypto Trading Guide1. Introduction to Crypto Trading
Cryptocurrency trading involves buying, selling, and exchanging digital assets in order to profit from price fluctuations. Unlike traditional markets, crypto trading operates 24/7 due to the decentralized nature of blockchain technology. The crypto market is highly volatile, which presents both opportunities and risks for traders. Popular cryptocurrencies include Bitcoin (BTC), Ethereum (ETH), Ripple (XRP), Cardano (ADA), and many more altcoins.
Crypto trading is divided into two main categories:
Spot Trading: Buying and selling cryptocurrencies for immediate settlement.
Derivatives Trading: Using financial contracts like futures and options to speculate on price movements without owning the underlying asset.
2. Understanding the Crypto Market
2.1 Market Structure
The crypto market is unique in its decentralized, borderless structure. Unlike traditional markets with centralized exchanges, crypto operates via:
Centralized Exchanges (CEX): Platforms like Binance, Coinbase, and Kraken. These offer high liquidity but require trust in the platform.
Decentralized Exchanges (DEX): Platforms like Uniswap and SushiSwap. These run on smart contracts and allow peer-to-peer trading.
2.2 Market Participants
Crypto market participants include:
Retail Traders: Individual traders buying or selling for personal gain.
Institutional Traders: Hedge funds, banks, and large investors.
Market Makers: Entities that provide liquidity by simultaneously placing buy and sell orders.
2.3 Market Hours
Unlike stock markets, crypto markets operate 24/7, which allows traders to react to news and events instantly. However, this also increases the risk of impulsive decisions.
3. Types of Crypto Trading
3.1 Spot Trading
Spot trading is the simplest form of crypto trading where traders buy crypto at current market prices. Key considerations include:
Order Types: Market orders (buy/sell immediately), limit orders (buy/sell at a specific price), and stop-loss orders (automated exit at a set loss level).
Portfolio Diversification: Spreading investments across multiple assets reduces risk.
Risk Management: Setting strict entry and exit rules is critical due to high volatility.
3.2 Margin Trading
Margin trading allows traders to borrow funds to increase exposure. For example, with 10x leverage, a $100 trade controls $1000 worth of assets.
Risks: Margin trading amplifies both profits and losses. Liquidation occurs if losses exceed collateral.
3.3 Futures and Options Trading
Derivatives trading enables speculation on price movements:
Futures Contracts: Agreements to buy or sell an asset at a future date at a predetermined price.
Options Contracts: Rights (but not obligations) to buy or sell at a fixed price within a certain time.
Perpetual Contracts: Futures with no expiry, commonly used in crypto derivatives markets.
3.4 Algorithmic and Bot Trading
Automated trading uses algorithms to execute trades based on predefined strategies:
Trend-following bots: Buy in uptrends, sell in downtrends.
Arbitrage bots: Exploit price differences between exchanges.
Market-making bots: Provide liquidity while capturing spreads.
4. Fundamental Analysis (FA) in Crypto
FA evaluates a cryptocurrency’s intrinsic value based on technology, adoption, and market dynamics. Key factors include:
Whitepapers: Technical documents explaining the coin’s purpose, roadmap, and use cases.
Development Activity: Active GitHub commits and project updates indicate sustainability.
Network Metrics: On-chain data like transaction volume, wallet addresses, and staking rates.
Regulatory Environment: Government policies can significantly affect prices.
5. Technical Analysis (TA) in Crypto
TA uses historical price data to predict future trends. Key tools and concepts include:
5.1 Chart Patterns
Triangles, Head & Shoulders, Double Tops/Bottoms: Patterns indicate potential reversals or continuations.
Support and Resistance Levels: Price points where buying or selling pressure is strong.
5.2 Indicators and Oscillators
Moving Averages (MA): SMA, EMA help identify trends.
Relative Strength Index (RSI): Measures overbought or oversold conditions.
MACD (Moving Average Convergence Divergence): Trend and momentum indicator.
Bollinger Bands: Measure volatility and potential breakout points.
5.3 Volume Analysis
High trading volume confirms price trends, while low volume may indicate weak moves.
6. Risk Management
Effective risk management is crucial in crypto due to volatility:
Position Sizing: Risk only a small percentage (1–3%) of your capital per trade.
Stop-loss Orders: Limit potential losses automatically.
Diversification: Spread investments across multiple coins and strategies.
Avoid Overleveraging: Using excessive leverage increases the chance of liquidation.
7. Trading Strategies
7.1 Day Trading
Traders buy and sell within the same day to profit from short-term price movements. Requires constant monitoring.
7.2 Swing Trading
Holding positions for days or weeks to capture medium-term trends. Combines TA and FA.
7.3 Scalping
Quick trades lasting seconds to minutes. Focuses on small price changes with high frequency.
7.4 HODLing
Long-term strategy where traders hold assets regardless of market fluctuations. Common with Bitcoin and Ethereum.
8. Psychology of Crypto Trading
Emotional discipline separates successful traders from losers:
Avoid FOMO (Fear of Missing Out): Impulsive buying during rapid price surges can lead to losses.
Control Greed: Exiting trades too late can reverse profits.
Patience and Discipline: Following a strategy consistently is more important than predicting the market perfectly.
9. Security and Safety
Crypto security is critical due to hacks and scams:
Wallets:
Hot Wallets: Online wallets for active trading; convenient but vulnerable.
Cold Wallets: Offline storage; highly secure for long-term holdings.
Two-Factor Authentication (2FA): Adds an extra security layer.
Exchange Reputation: Use reputable exchanges with insurance and strong security protocols.
10. Taxes and Regulations
Crypto trading is subject to tax in most countries. Regulations vary widely:
Taxable Events: Selling crypto, converting to fiat, or trading one coin for another.
Reporting Requirements: Maintain transaction records for audits.
Regulatory Compliance: Know your country’s laws to avoid legal issues.
11. Tools and Resources
Traders rely on tools for research, trading, and risk management:
Trading Platforms: Binance, Coinbase, Kraken.
Charting Tools: TradingView, Coinigy.
News Sources: CoinDesk, CoinTelegraph, CryptoSlate.
Portfolio Trackers: Blockfolio, Delta App.
12. Common Mistakes to Avoid
Ignoring risk management rules.
Overtrading or excessive leverage.
Falling for pump-and-dump schemes.
Neglecting security practices.
Blindly following social media tips.
13. Emerging Trends in Crypto Trading
DeFi (Decentralized Finance): Lending, borrowing, and yield farming.
NFTs (Non-Fungible Tokens): Digital collectibles and gaming assets.
Layer 2 Solutions: Faster, cheaper transactions on Ethereum (e.g., Polygon).
AI-Powered Trading: Leveraging artificial intelligence for predictive analytics.
14. Conclusion
Crypto trading offers immense profit potential but comes with high risk. Success requires a combination of:
Strong technical and fundamental analysis skills.
Effective risk and money management.
Psychological discipline and patience.
Staying updated with market trends, news, and regulatory changes.
By developing a systematic trading plan, diversifying strategies, and prioritizing security, traders can navigate the volatile crypto markets more confidently.
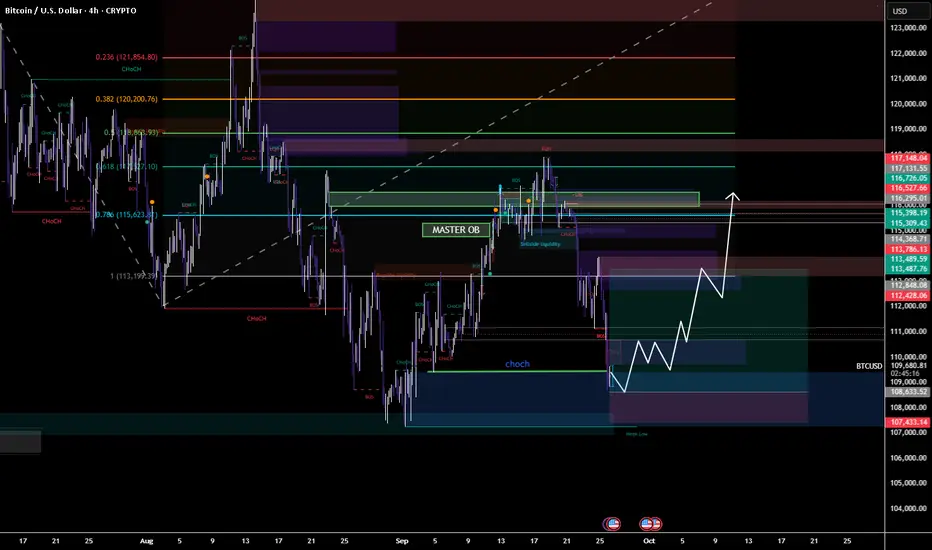
BTC Bulls Eyeing a Reversal From Liquidity SweepBTC Bulls Eyeing a Reversal from Liquidity Sweep”
📌 Description:
Bitcoin swept downside liquidity near 108k, tapping into a demand zone. If this level holds, expect a strong recovery toward the 113.5k–116.5k supply zones, with the Master OB acting as a key magnet for price.
📈 Trade Plan (4H BTCUSD)
🔹 Entry Zone (Long):
108.0k – 109.0k (liquidity sweep + demand zone).
🔹 Stop Loss (SL):
Below 107.0k (weak low / invalidation).
🔹 Take Profit (TP):
TP1: 112.4k (minor FVG close)
TP2: 113.8k – 114k (OB retest zone)
TP3: 115.5k – 116.2k (major supply / Master OB)
🎯 Risk-to-Reward (approx):
Entry: 108.5k
SL: 107k (≈ -1.5k / -1.3%)
TP1: 112.4k (≈ +3.9k / +3.6%) → RR ≈ 1:2.7
TP2: 114k (≈ +5.5k / +5%) → RR ≈ 1:3.8
TP3: 116.2k (≈ +7.7k / +7.1%) → RR ≈ 1:5.2
⚡ Clean long setup: liquidity sweep → bullish CHoCH → push into OB/supply above.
BTCUSD – Short-term Down Channel...BTCUSD – Short-term Down Channel, Accumulation Before a Potential Rally
Hello traders,
On the H4 timeframe, BTC is currently moving within a short-term descending channel. After touching a strong support level, selling pressure has started to weaken. However, the 107.4k zone has not yet been retested, and it is quite likely that price will revisit this area once more.
Technical View
During the past week, BTC traded in a very “technical” manner – with clear ranges, precise reversal points, and a consistent descending channel structure.
Key Support: around 107.4k, aligning with the Long Entry Zone.
Short-term Resistance: 110k – 111k, where price tends to react during recovery moves.
Fundamental View
From a fundamental perspective, there are not many factors suggesting that BTC will continue a deeper decline. Moreover, historical data shows that October is often a period when BTC and the broader crypto market tend to recover. This strengthens the probability of a strong rebound once support has been fully tested.
Trading Scenarios
Short towards support
Entry: 110.3k
SL: 110.8k
TP: 109k – 107.6k
Long at strong support
Entry: 107.4k
SL: 106.8k
TP: If price reacts strongly: hold the position, move SL to breakeven, and target higher levels in line with the broader uptrend.
If price reaction is weak: book profits around 109k for a short-term gain.
Conclusion
Short-term: priority remains to look for short opportunities around 110.3k back towards support.
Medium-term: plan to go long near 107.4k to capture the expected rebound, with the view that BTC could re-enter a bullish phase in October.
Risk Management
Always respect stop-loss levels, especially for long positions at support, as this is the key level that will decide BTC’s next direction.
This is my personal outlook on BTC for the weekend. Use it as a reference and adapt it to your own trading system.
👉 Follow me for shared scenarios and the quickest updates whenever price structure changes.

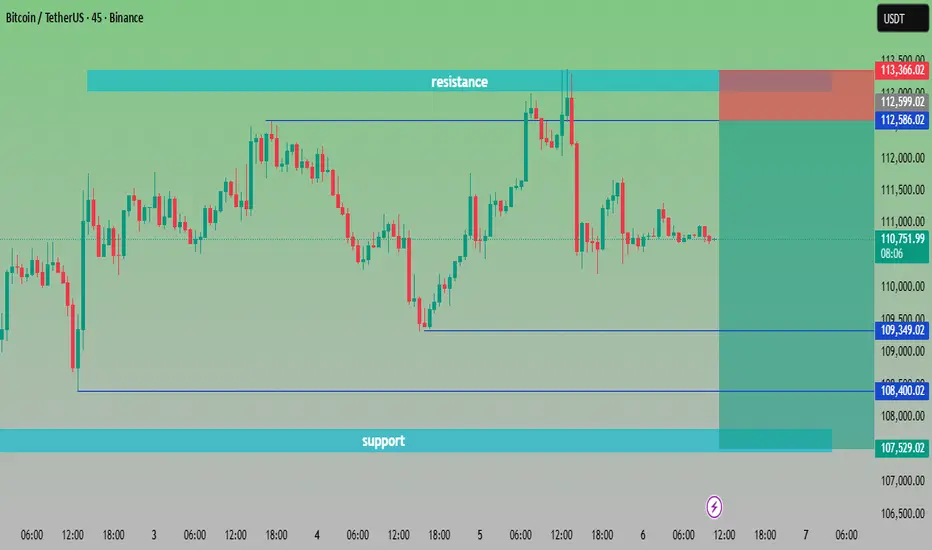
“BTC/USDT at Crossroads | Key Levels to Watch🔎 Chart Analysis – BTC/USDT (45m)
Resistance Zone: Around 112,586 – 113,200 USDT. Price has tested this area multiple times but failed to break out, confirming strong selling pressure.
Support Zone: Around 107,529 – 108,400 USDT. Buyers have consistently defended this zone, making it a key demand area.
Current Price: 110,720 USDT, sitting in the middle of support and resistance.
📌 Scenarios:
Bullish Case 🟢🚀 – If BTC breaks above 112,586 USDT, momentum could push toward 113,500+ USDT.
Bearish Case 🔴📉 – If BTC fails to hold 109,349 USDT, price may retest the deeper support around 107,500 USDT.
⚖️ Trading Plan Idea:
Long Entry: Above 112,600 breakout ✅
Short Entry: Below 109,300 breakdown ❌
Target Zones:
Upside 🎯 → 113,500+
Downside 🎯 → 107,500
"Bitcoin Eyes $100K Re-Entry: Retest, Support Zone, Then Push ?Chart Analysis
1. Price Structure & Trendlines
The chart displays a former upward trendline that has been broken, leading to a corrective pullback.
Following that, price is perched within a “retest zone” (the red-shaded rectangle), which aligns with both historical horizontal resistance—now turning into support—and an area of previous consolidation. This is a classic setup: price often retests key breakout levels before resuming its move.
2. Support Levels
The main support is clearly drawn around the $100K zone, highlighted by a grey bar below the retest zone. This is a psychological and structural area to watch for potential strong buying.
Immediate support appears near $110K–$112K, as noted by the lower edge of the red retest area—this zone has shown to catch corrections before in technical analysis and news reports
AInvest
Mudrex
Barron's
.
3. Resistance & Upside Targets
If the retest holds, the chart charts a potential bounce toward the upper rising trendline and beyond, potentially aiming for the $126K–$130K region, as marked by Fibonacci retracement levels.
This aligns with several external forecasts suggesting resistance or target zones in that range
AInvest
Mudrex
Barron's
.
4. Potential Price Path & Scenarios (Denoted by Red Arrows)
Bearish Scenario: Price may dip down into the retest zone, test support, and—if the breakdown occurs—continue lower toward $100K—a key area of interest.
Bullish Scenario: The support holds, leading to a V-shaped recovery that propels price back above $115K, potentially triggering a rally toward $122K–$130K.
Summary Table
Key Zone / Level Significance & Note
$110K–$112K Critical near-term support; breakdown risks move toward $100K
AInvest
Mudrex
Retest Zone (~$114K–$115K) Area combining horizontal support and trendline; serves as pivot for next move
Mudrex
AInvest
$120K–$123K Major resistance where a breakout could fuel continuation toward $127K–$130K
Mudrex
Barron's
Broader Context & Market Sentiment
Bitcoin is currently consolidating after setting new highs near $124K
MarketWatch
The Economic Times
Barron's
Cointribune
.
Analysts observe that sustaining above the $110K–$112K band is essential to the bullish case; falling below it could invite deeper downside
Barron's
Cointribune
AInvest
.
Conversely, a decisive move above $120K–$123K could validate continuation toward $127K–$130K, and even higher—some forecasts extend to $135K and beyond
Mudrex
Indiatimes
Barron's
CoinCodex
.
Final Thoughts
Your chart beautifully illustrates the classic “retest after breakout” dynamic:
Hold above the retest zone? Look for a rebound toward $120K+, with the potential for a full bullish revival aiming for $130K.
Break below $110K–$112K? Watch for a possible move toward $100K—a critical support level.
Stay alert to macro catalysts too—like Federal Reserve interest rate signals, institutional inflows (ETFs), and regulatory developments—which could steer the next leg substantially

TARS ready for STARSTARS Looking great on 4HR TF. Potential to rocket over 55%. Self-explanatory chart!!
Please Note: This is not a Buy/Sell Recommendation. DYOR Always!

PEPE USDT Technical Analysis- PEPE is currently trading at its all-time high
- Pepe can easily print another round of impulse once its above the FIB resistance
- PEPE is not trading at an accumulation zone so watch out
- PEPE has no utility and only try trading or investing on such tokens to scale up your portfolio

Crypto Total Market Cap Analysis- The next wave for crypto Total Marketcap is going to be huge and parabolic
- It will be very important to see how the market reacts from zone and whether it can hold the level of 2.1 Trillion or not
- New Highs for the total market cap is programmed anyways but its crucial to understand how the reaction will be from the current price action
- Altcoins are currently sitting at a very nice zone and I still think accumulating Alts here will be very profitable and helpful
- Make sure that you are accumulating good Altcoins, Bitcoin, and Ethereum in Spot.

Ape coin reversal patternApe coin is reversing really nice breakout from trendline and W pattern .
Its a good fundamental coin as bull run approaching this coin can give good returns in next few month’s

Crypto market cap analysis Total cap is at supply if gets rejected from can see some correction bt long term still bullish .. short term trader can book some profit here

Crypto Total Market Cap Update- The market is back above 1.5t$
- The structure looks solid and the range has been broken too
- I think we can surely see more infusion in the market very soon.
- BTC and all other alts can easily double triple or quadruple your whole Portfolio

Movement to the downside!Bitcoin is looking for short & expecting to reach at 27000 after forming ascending channel.

ETHUSD AnalysisConfirmation for this long trade:-
1: Market is taking pullback from support area
2: taking rejection from trendline

Crypto total M cap analysisAfter good downtrend , trend is switched in crypto total cap after choch , now we can long crypto on demand zone

ETH/USDT:- Bullish Momentum Building Towards 1760-1770 Levels ?In this technical analysis, we delve into the current market trends of the ETH/USDT trading pair. The Ethereum cryptocurrency has shown promising signs of bullish momentum, with key buying and selling levels identified for traders to consider.
Buying Area at 1760-1780 Levels:-
Ethereum's recent price action reveals a strong support zone between the 1760-1780 levels. Traders looking to establish long positions can consider accumulating Ethereum within this range, aiming to capitalize on potential price appreciation.
Price Targets at 1950-1960 Levels:-
The ETH/USDT pair is exhibiting a promising uptrend, with price targets set at the 1950-1960 levels. It is essential to monitor price movements closely, as a sustained breach above this range could trigger further gains.
Bullish Order Block Opportunity:-
An intriguing opportunity arises from the presence of a bullish order block at 1760-1770 levels. This block signifies a strong demand area, highlighting the potential for upward price movement. Additionally, if the market corrects itself and ETH/USDT retraces to the 1650-1680 levels, astute traders can consider this a "buy for bag" opportunity.
By staying informed about these key levels and potential opportunities, traders can position themselves for success in the dynamic world of cryptocurrency trading. Follow us on Trading View for real-time updates, in-depth analyses, and actionable insights to enhance your trading journey.

MATIC/USDT: Anticipating Bull Journey After a Corrective Phase ?In this technical analysis, we will examine the MATIC/USDT trading pair's recent price action and chart patterns.
1. Resistance Area - 0.8000-0.8150:
MATIC/USDT has been facing a significant resistance area around 0.8000-0.8150. Multiple attempts to break above this zone have resulted in pullbacks. Traders should closely monitor this level as a successful breakout could trigger a bullish rally. .
2. Expected Corrective Phase and Potential Buying Zone - 0.5500-0.6000:
Based on our analysis, we anticipate a corrective phase for MATIC/USDT in the near term. This retracement could find support around the 0.5500-0.6000 region, a crucial buying zone.
Traders looking to enter long positions may find this level attractive as it aligns with historical support and offers a favorable risk-to-reward ratio.
3. Continuation of Higher Lows Patterns and Liquidity Sweep:
Despite the resistance, MATIC/USDT has been forming higher lows, indicating potential bullish momentum. However, before resuming its upward trajectory, the price might perform a liquidity sweep towards the 0.5500-0.6000 support zone.
Such a move is a common occurrence in crypto markets and should not be mistaken for a trend reversal.
Conclusion:
In conclusion, MATIC/USDT presents an intriguing trading opportunity for followers of our Trading View ideas. The resistance area of 0.8000-0.8150 and the expected corrective phase towards 0.5500-0.6000 make for crucial decision points. Traders should exercise patience, wait for confirmation signals, and manage risk effectively for potential gains towards 0.9000 and beyond.

GALA/USDT Targets Buying Area with PotentialIn this technical analysis, we'll explore the GALA/USDT's Harmonic patterns suggest a rejection from the current market price, signaling a potential bounce opportunity.
Buying Area - 0.02375 - 0.02400:
Our analysis indicates that the GALA/USDT pair has a strong buying area ranging between 0.02375 and 0.02400.
Traders seeking an entry point should consider accumulating GALA within this range, as it presents a favorable risk-to-reward ratio.
Price Target - 0.02490:
Based on our technical analysis, we expect GALA/USDT to experience a potential bounce in the near term, with a target price of 0.02490.
Traders can anticipate potential profit-taking opportunities around this price level.
Harmonic Pattern and Price Rejection:
A harmonics pattern has emerged on the GALA/USDT chart, suggesting a possible rejection from the current market price of 0.02430. The pattern indicates a corrective move, leading the price towards the aforementioned buying area of 0.02375 - 0.02400.
In summary, the GALA/USDT trading pair presents an intriguing opportunity for traders. The identified buying area of 0.02375 - 0.02400 offers a favorable entry point, while the price target of 0.02490 signals a potential upside.

SUI/USDT Analysis: Buying Areas and probable Liquidity Sweep ?SUI/USDT Technical Analysis: Buying Opportunity, Anticipated Price Bounce, and Potential Liquidity Sweep
SUI/USDT presents a compelling buying opportunity within the range of 6300-6400. This price zone serves as an attractive area for market participants looking to accumulate positions. Timing is crucial to capture potential upside movements.
Based on our technical analysis, an expected price bounce in the near future is projected for SUI/USDT. Traders can target the range of 8400-8500 as potential profit-taking levels.
It is important to note that these levels may act as areas of resistance, attracting selling pressure.
A liquidity sweep at the 5100 level is a possibility to consider before SUI/USDT re-claims the buying area of 6300-6400.
By patiently waiting for the liquidity sweep and subsequent re-claim of the desired range, traders can optimize their entries, minimizing risk and maximizing potential gains.
In conclusion, SUI/USDT offers a buying opportunity within the range of 6300-6400. Traders should be alert to potential price bounces in the range of 8400-8500, while also considering the possibility of a liquidity sweep at the 5100 level.
#plan your trade,trade your plan.
