“BTC/USDT at Crossroads | Key Levels to Watch🔎 Chart Analysis – BTC/USDT (45m)
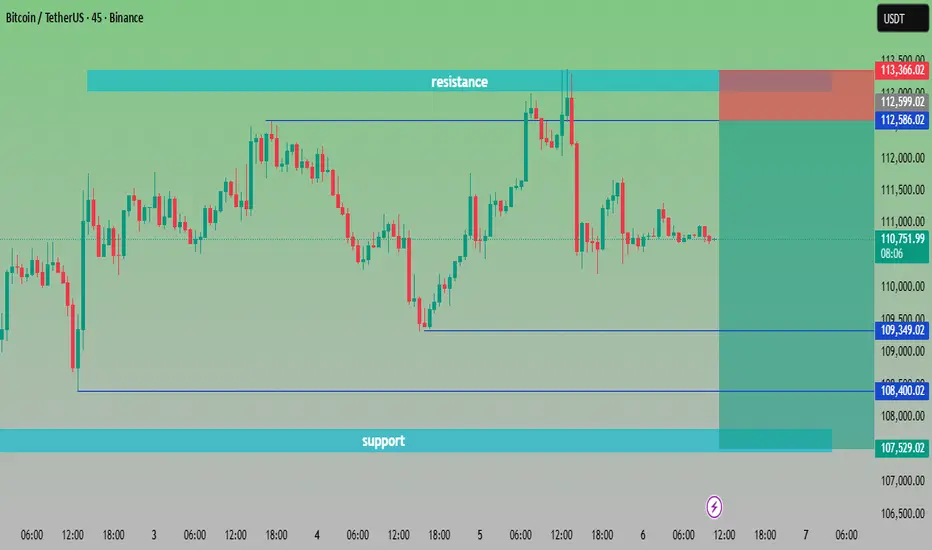
Resistance Zone: Around 112,586 – 113,200 USDT. Price has tested this area multiple times but failed to break out, confirming strong selling pressure.
Support Zone: Around 107,529 – 108,400 USDT. Buyers have consistently defended this zone, making it a key demand area.
Current Price: 110,720 USDT, sitting in the middle of support and resistance.
📌 Scenarios:
Bullish Case 🟢🚀 – If BTC breaks above 112,586 USDT, momentum could push toward 113,500+ USDT.
Bearish Case 🔴📉 – If BTC fails to hold 109,349 USDT, price may retest the deeper support around 107,500 USDT.
⚖️ Trading Plan Idea:
Long Entry: Above 112,600 breakout ✅
Short Entry: Below 109,300 breakdown ❌
Target Zones:
Upside 🎯 → 113,500+
Downside 🎯 → 107,500
Cryptoshort
JUST WAITING FOR IT TO BREAK ( ETH is all ready to bleed)from a long time I was waiting for a good entry in Ethereum
now I think we are close to good some really good short positions
the moment it breaks the trend line we will get more assurance regarding the same
I think it has a long way to go down so can get some really good profits
WAITING FOR IT TO CREATE A NEW LOW
THANK YOU
BINANCE:ETHUSDT

Shiba Inu good for a short trade - Intradaycryptocurrencies are in the correction phase for the last few trading sessions on a daily timeframe.
Shiba Inu has fallen with good volumes. The volume trend suggests that the selling pressure is high.
The price is trading below 20ema. RSI is weak. MACD on 15min. the timeframe is in negative territory and on 5min. the timeframe has crossed below the Signal line.
SL- Slightly above 20ema
Target, nearest swing low.
Risk reward is attractive at around 3.
