BTC/USD: 1H Breakout Attempt After Base FormationBitcoin has formed a temporary base after a strong sell-off, followed by a steady recovery. Price is now testing a well-defined supply zone, where market reaction will decide the next directional move.
🔍 What the Chart Is Showing
➤ Strong bearish impulse followed by a sharp downside expansion
➤ V-shaped recovery indicating aggressive dip buying
➤ Price now consolidating below a marked resistance / supply zone
➤ Structure shifting from impulsive to corrective on lower timeframe
📊 Price Action Insight
➤ Consolidation near resistance shows indecision between buyers and sellers
➤ Buyers are attempting acceptance above the zone, but follow-through is limited
➤ This area acts as a decision point for continuation or rejection
➤ Volume and candle closes near resistance are critical to watch
🎯 Key Scenarios to Watch
➤ Clean breakout & acceptance above the zone → continuation toward higher levels
➤ Rejection from supply → pullback into the previous range
➤ Extended consolidation → volatility expansion in next session
⚠ Execution & Risk Notes
➤ Avoid entries inside tight consolidation
➤ Wait for a clear breakout or rejection confirmation
➤ Manage risk carefully near key intraday zones
📌 This analysis focuses on pure price action and structure.
📚 No prediction — only reaction to market behavior.
⚠ Disclaimer (Use in All Publications)
Disclaimer:
This analysis is for educational and informational purposes only. It does not constitute financial advice or a trade recommendation. Cryptocurrency markets are highly volatile. Always do your own research and use proper risk management. The author is not responsible for any trading losses.
Cryptotrading

Gold Tests Patience and Crypto Tests Discipline Both exposes :((Hello Traders!
Gold and Crypto don’t test traders in the same way. That’s something the market teaches only after experience. On the surface, both move on charts, both create profits and losses, and both react to news. But psychologically, they attack very different weaknesses.
Gold tests how long you can wait.
Crypto tests how well you can control yourself.
And in the end, both expose the same thing, your mindset.
How Gold Tests a Trader’s Patience
Gold is slow, heavy, and deliberate. It spends long periods doing almost nothing. Price ranges, consolidates, and frustrates traders who want action.
Long sideways phases make traders doubt their bias
Small fake moves test emotional endurance
Real trends appear only after patience is exhausted
Gold doesn’t reward excitement.
It rewards those who can sit through boredom without forcing trades.
How Crypto Tests a Trader’s Discipline
Crypto is the opposite. It moves fast, violently, and without warning. Opportunities appear suddenly, and mistakes are punished instantly.
Sharp moves trigger greed and impulsive entries
Overtrading feels justified because volatility is high
Risk management gets ignored in the name of opportunity
Crypto doesn’t wait for you to think.
It waits for you to slip.
Why Both Markets Reveal the Same Weakness
Even though Gold and Crypto behave differently, they expose the same psychological flaws.
Impatience in Gold leads to forced entries
Lack of discipline in Crypto leads to reckless sizing
Emotional decisions damage both equally
Different markets.
Same trader psychology.
What This Taught Me Over Time
Trading both Gold and Crypto taught me that the market doesn’t need complexity to hurt traders. It only needs emotions.
Gold taught me how to wait without frustration
Crypto taught me how to act without ego
Both forced me to respect process over excitement
Once psychology improved, strategies started working more consistently.
Rahul’s Tip
If Gold is boring you, slow down.
If Crypto is exciting you, slow down even more.
Boredom and excitement are both emotional extremes. Profitable trading usually lives in the middle.
Final Thought
Gold tests patience.
Crypto tests discipline.
Fail either test, and psychology takes control.
Master both, and the market stops feeling chaotic, because the chaos was never on the chart. It was inside the trader.
If this comparison resonated with your experience, drop a like or share your thoughts in the comments.
More real psychology-based lessons coming.

BTCUSDT Technical Analysis (1H Timeframe)BTCUSDT is showing a bearish structure on the 1H timeframe, with price rejecting strongly from the 71,300–71,800 supply zone and forming lower highs. The recent upside move looks corrective, and price is failing to hold above previous demand, signaling weak bullish momentum.
The key area to watch is 68,888. A breakdown below this level confirms continuation to the downside, with liquidity resting below recent lows. The next major demand zone sits between 68,000 and 67,200, aligning with prior reactions and imbalance.
Trade Setup:
Sell below 68,888 | TP1: 68,000 | TP2: 67,222 | SL: 70,222
Bias remains bearish below 70,200; bullish control only above 71,800.
Disclaimer:
This analysis is for educational purposes only and does not constitute financial advice. Cryptocurrency trading involves significant risk, and losses may exceed your investment. Always do your own research and manage risk properly before entering any trade.

BREV/USDT Crypto Futures – Buy Stop SetupBREV/USDT, a Buy Stop order is recommended at 0.1433, anticipating upward momentum. The trade targets are set at 0.1457 for TP1 and 0.1479 for TP2, offering potential profit zones as the price moves higher. To manage risk, a stop-loss is placed at 0.1397, ensuring controlled exposure in case of a market reversal. This setup suggests a bullish bias, and traders should monitor price action closely to confirm the momentum before entry.
BREV/USDT
Buy Stop
Entry: 0.1433
Target 1 (TP1): 0.1457
Target 2 (TP2): 0.1479
Stop Loss (SL): 0.1397
Bias: Bullish – expecting upward momentum
⚠️ Disclaimer:
This trade setup is for educational and informational purposes only. Trading cryptocurrencies involves high risk, and past performance does not guarantee future results. Always do your own research (DYOR) and trade responsibly. Never invest money you cannot afford to lose.

BITCOIN at High-Timeframe Demand: Reaction Zone in Play!When I look at this chart, I’m not seeing fear or structural damage.
I’m seeing price doing exactly what it should do after a distribution phase , revisiting demand and slowing down.
Bitcoin has come back into a clearly marked high-timeframe demand / reaction zone . This is not a random level. This is an area where price has previously flipped structure and attracted strong participation.
What stands out to me on the chart:
Price is holding above a major high-timeframe support , not slicing through it. That tells me sellers are no longer aggressive at these levels.
The current zone is labeled as a planned accumulation area (not FOMO) . Price is reacting here instead of accelerating lower, that’s important.
Downside risk is clearly defined with a structure invalidation level below demand. As long as that level holds, structure remains intact.
Upside targets are logical and sequential , starting from a reaction high, followed by range expansion, and then higher-timeframe resistance.
The psychology behind this phase:
This is the part of the market where most people feel uncomfortable.
Price isn’t exciting. It’s not trending fast. It’s just… sitting.
But that’s usually how strong moves begin.
If Bitcoin were truly weak, it wouldn’t pause here, it would break cleanly below demand.
So far, it hasn’t.
That tells me the market is evaluating value , not panicking.
My approach here is simple:
I don’t chase price away from demand.
I don’t panic inside support.
I observe how price behaves at this zone and let the market show its hand.
As long as price holds above the demand zone, reactions from here remain valid.
Only a clean acceptance below the invalidation level would change this view.
Until then, this is a patience zone .
And patience, more often than prediction, is what gets paid in this market.
Disclaimer:
This analysis is for educational purposes only. Not financial advice. Always manage risk and trade according to your own plan.

Bitcoin Is Reacting, Not Breaking, Patience Before the Next MoveWhen I look at this chart, I don’t see panic or trend failure. I see price pulling back into a clearly defined demand area within a rising structure and responding from it. That matters. If sellers were truly in control, price wouldn’t pause here, it would slice through demand without hesitation. Instead, Bitcoin is holding above structure, absorbing selling pressure, and stabilising.
The repeated rejections from the upper supply zone show that resistance exists, but the key point is this: sellers are unable to push price into a breakdown. Momentum has cooled, volatility has compressed, and RSI has reset without price collapsing, all signs of balance, not weakness.
This phase feels slow and uncomfortable, especially for traders who expect constant movement, but historically this is where the market builds the base for its next decision. I’m not interested in chasing price near resistance, and I’m not interested in panic selling into demand. I want to observe how price behaves here, because reactions at structure tell the real story. As long as Bitcoin continues to respect this rising demand and doesn’t accept below it, the broader structure remains intact and upside expansion stays on the table. A clean break below structure would force me to rethink, until then, patience is the position. Sometimes the best trades don’t come from predicting the next candle. They come from waiting while price proves who is actually in control.
Disclaimer: This analysis is for educational purposes only and not financial advice. Always manage risk and trade according to your own plan.

BTC Compression Phase: Where Smart Money Builds Positions!Hey guy's, When I look at this chart, I’m not seeing fear or trend failure.
I’m seeing something far more important, controlled compression above demand .
Bitcoin has pulled back, swept liquidity, and is now holding above a clearly defined demand area while volatility keeps contracting.
This kind of behaviour rarely appears during panic.
It usually appears when the market is absorbing supply quietly .
What I’m seeing on the chart:
Price is still respecting the ascending demand structure , which tells me higher-timeframe buyers are active and defending key levels.
The recent move cleaned out weak hands below demand , but price did not accept lower, a classic liquidity sweep, not a breakdown.
Supply is visible above , which explains why price is compressing instead of expanding immediately. Sellers are present, but they are not overpowering buyers.
The range between ascending demand and overhead supply is tightening . This is where impatience builds, and where strong positioning usually happens.
The psychology part (this matters):
This phase feels uncomfortable.
Price isn’t doing much.
Both sides are frustrated.
And that’s usually a clue.
If Bitcoin wanted to break structure, it had a clean opportunity below demand.
It didn’t take it.
That tells me sellers are getting weaker, not stronger.
So my thinking stays simple:
I don’t want to chase upside after expansion.
I don’t want to panic into a sell-off that already swept liquidity.
I want to watch how price reacts around demand, because this is where real decisions are made.
As long as structure holds:
Pullbacks into the 88k–87k demand zone remain high-probability reaction areas.
Compression above demand keeps the door open for a mean-reversion move toward higher levels.
Only a clean breakdown and acceptance below ~84k would invalidate this structure.
Until then, I’m not trying to predict the next candle.
I’m trying to read behaviour .
Markets don’t move when everyone is excited.
They move when most people get bored, confused, or impatient.
Disclaimer:
This analysis is for educational purposes only. Not financial advice. Always manage risk and trade according to your own plan.

BNBUSDT.P – 1D | High RR Trend-Continuation SetupBNB is forming a higher-low structure after a prolonged correction and is now reacting from a key demand / flip zone aligned with the ascending trendline. Price acceptance above this level can lead to a strong upside expansion.
🔹 Market: BNBUSDT Perpetual (Bitget)
🔹 Timeframe: 1 Day
🔹 Bias: Bullish continuation
🔹 Entry Zone: Demand / Structure support
🔹 Stop Loss: Below invalidation level
🔹 Targets:
TP1: Previous supply / range high
TP2: Major resistance zone
TP3: Higher-timeframe liquidity area
📌 Confluence Factors:
Higher-low market structure
Trendline support
Previous resistance turned support
Clean risk-to-reward profile
📈 As long as price respects the marked demand zone and holds the trendline, upside continuation remains favorable.
⚠️ A daily close below support invalidates the setup.
💡 Trade with strict risk management. This chart reflects technical analysis, not financial advice.

Gold Rewards Timing, Not Activity🟡 Gold Rewards Timing, Not Activity ⏳✨
Gold is not a market that rewards constant action.
It rewards waiting, observation, and precise timing.
Many traders believe that trading more means earning more. In Gold, this mindset often leads to overtrading, emotional decisions, and unnecessary losses.
⏱️ 1. Gold Moves in Phases, Not Constant Trends
Gold spends a large amount of time in:
consolidation 🔄
slow accumulation 🧩
controlled ranges 📦
During these phases, price appears “boring,” but the market is actually preparing.
Trading aggressively in these conditions usually means trading noise, not opportunity.
🧠 2. Activity Feeds Emotions, Timing Controls Risk
High activity leads to:
impatience 😤
forced entries 🎯
emotional exits ❌
Good timing, on the other hand, comes from:
understanding context 🧭
waiting for price to show intent 📊
acting only when conditions align ✅
Gold punishes impatience faster than most markets.
🏦 3. Institutions Trade Less, But Trade Better
Large players do not chase every candle.
They wait for:
liquidity to build 💧
weak hands to exit 🧹
price to reach meaningful zones 📍
When timing is right, Gold often moves fast and decisively — leaving overactive traders behind.
⚡ 4. Big Gold Moves Come After Quiet Periods
Some of the strongest Gold expansions begin after:
low volatility 😴
reduced participation 📉
trader boredom 💤
This is why patience is not passive — it is strategic.
🧩 Key Insight
In Gold, doing less at the right time often outperforms doing more at the wrong time.
🎯 Final Takeaway
❌ More trades ≠ more profits
✅ Better timing = cleaner execution
🟡 Gold rewards discipline, context, and patience
Master timing, and activity will take care of itself.

BTC at Major Resistance | Short Opportunity Near 90K ZoneBitcoin (BTCUSD) is approaching a key resistance zone between 89,900 – 90,600, an area where price has a higher probability of facing selling pressure.
📌 Trade Idea (Short Setup):
Instrument: BTCUSD
Sell Zone: 89,900 – 90,600
Target Area: 88,500 – 88,000
This zone may act as a supply area, where bears could step in to defend higher prices. Rejection signals or weakness near resistance could offer a favorable risk-to-reward short opportunity.
⚠️ Always wait for confirmation and manage risk wisely.
📌 Disclaimer:
This analysis is for educational purposes only and is not financial advice. Always manage risk and follow your trading plan.
Your feedback drives our content and keeps everyone trading smarter. Let’s make those pips together! 🚀
Happy Trading,
– The InvestPro Team

BTC Technical Outlook – Cycle High WatchBitcoin is potentially entering the final push of the current cycle, with price action forming a Head & Shoulders (H&S) structure near the newly formed ATH. While this pattern is not confirmed yet, it does raise caution for a possible local top.
📈 Upside Scenario:
Our immediate focus remains on the $111,000 zone, which aligns with a potential liquidity grab area. A push into this region followed by strong rejection would strengthen the bearish case.
📉 Risk Zone to Monitor:
If rejection occurs near $111K, attention will shift to the neckline area, which will be crucial in confirming the H&S breakdown.
⚠️ Key Takeaway:
Bullish continuation remains valid until rejection is confirmed
$111K = key upside target & decision zone
Neckline break would confirm trend exhaustion
_Wait for confirmation. Trade the reaction, not the prediction._

Weekly Analysis of BTC with Buy/Sell scenarios...We analyzed three weeks back that BTC would be in range for some time before taking any further move, And BTC is following same analysis and trapped within a small range since then. BTC prediction of last week also worked perfectly well and market kept in consolidation mode itself. BTC is still in consolidation zone and may spend some more days. It may develop ABC pattern or reversal at identified daily FVG level, if price has to change its delivery and take turn from here. This zone is kind of make or break. If price is not able to sustain and breakdown, then it may witness ~65-70K levels as well.
We hope for reversal from this level as price is developing the pattern at higher time frame.
1. Price has taken liquidity or 82K and almost touched 80K.
2. It has inversed 1Day FVG and now price is consolidating in the range between EMAs.
3. We may expect price retracement till 1D iFVG and then reversal.
4. Before to that we may see sweep of 92900 (1D CISD) level and then a retracement short trade till 1D FVG
5. Most probably price will take liquidity of FVG/RDRB level and create MSS/CISD/TS/iFVG in LTF.
6. Price should show rejection/reversal in respective LTF (5m/15m) at FVG zone.
7. Take the trade only once clear entry model i.e. turtle soup. iFVG break, CDS or MSS happens on LTF
All these combinations are signaling a high probability and ~8R trade scenario.
Note – if you liked this analysis, please boost the idea so that other can also get benefit of it.
Also follow me for notification for incoming ideas.
Also Feel free to comment if you have any input to share.
Disclaimer: This analysis is for educational purposes only and does not constitute investment advice. Please do your own research (DYOR) and check with your financial advisor before making any trading decisions.

"ETH/USDT Forecast""ETH/USDT Forecast"
The market shows evidence of strong participation earlier, where price moved with speed and consistency, reflecting clear intent. That phase established direction and control without prolonged hesitation.
As price progressed, momentum began to ease. Movement slowed, reactions became more frequent, and volatility compressed. This change indicates a shift from active pressure to evaluation, where participants reduced aggression and allowed price to stabilize.
The subsequent recovery unfolded in a measured and uneven manner. Advances were short, overlapping, and lacked continuation, suggesting limited commitment behind higher prices. Opposing flow remained active, preventing expansion.
Currently, price behavior is defined by balance and compression. Activity reflects positioning rather than resolution. Until behavior shifts from overlap to decisive movement, the market remains in a waiting state, with continuation favored once imbalance returns.

BTC Market Update – FOMC Range ModeBitcoin is stuck in FOMC limbo — no clean pump, no dump, just tight consolidation as markets wait for Powell’s cue. Volatility is coiling, and a big move is loading.
Key Levels to Watch:
Support Zone: $92K–94K (must hold for bullish continuation)
Bullish Trigger: Break & hold above $94.6K
🎯 Next upside: $100K retest
Bearish Trigger: Break below $87.7K
🎯 Downside risk: Low $80Ks before a rebound attempt
Market View:
This is a classic decision range — expect sharp expansion once direction is chosen. Stay alert around FOMC headlines; volatility can spike fast.
Bias: ⚖️ Neutral → Breakout pending
Disclaimer:
For educational purposes only. This is not financial advice. Trading in Forex, Gold, Crypto, and markets involves high risk. Do your own research and trade at your own risk.

Why Bitcoin Hits Your Stop Loss Before the Real MoveWhy Bitcoin Hits Your Stop Loss Before the Real Move
Have you ever placed a Bitcoin trade and noticed this? 🤔
Your stop loss 😭💸 gets hit… just a few pips from your entry… then the price suddenly rockets 🚀💎 in the direction you were expecting!
This is not bad luck. It’s a Stop Loss Hunt 💥, used by smart money 🏦💰 to collect liquidity before the real trend begins.
1️⃣ Liquidity Pools Above Highs & Below Lows 📊💎
Retail traders place stop losses at obvious highs/lows 📈📉
These stops create liquidity zones 💧, which smart money targets 🔍
Price moves to these zones to collect liquidity → fuels the next trend 🚀
Example:
BTC trending upward 📈
Traders place buy stops above the previous high ⬆️
Smart money pushes price to trigger stops 💥 → collects liquidity 💎 → then moves the price in the real trend direction 🚀
2️⃣ Stop Loss Sweep 💥⚡
Price triggers retail stop losses 🛑
Retail traders get stopped out 😭💸
Institutions enter large positions with minimal resistance 💹
Key Insight:
Price needs liquidity 💧 to move strongly.
Without collecting stops, smart money cannot drive momentum efficiently ⚡
3️⃣ Fake Breakouts & Wicks 🌪️🔥
Watch for wick spikes or sudden breakouts 🕵️♂️
These are stop loss hunts
Many traders panic 😱 and exit positions
Smart money uses this to trap retail traders and continue the trend 🚀
4️⃣ The Real Move Begins 🚀🔥
After liquidity is collected 💎💧
The true trend resumes 📈
Traders who waited can enter safely 🧘♂️💹
Often, the move is stronger and faster ⚡ because institutions now control the market
5️⃣ Market Psychology Behind Stop Hunts 🧠💭
Retail traders panic when stops are triggered 😅💸
Fear is used to manipulate sentiment 🧲
Recognizing this psychological trap helps you stay calm 🧘♂️ and trade strategically 🏆
6️⃣ How to Trade Stop Loss Hunts 💡🧠
✅ Avoid stops at obvious highs/lows 🚫
✅ Wait for liquidity sweep ⏳💧
✅ Watch for wick spikes 🌟 — early signs of stop hunts
✅ Follow market structure 📊 (BOS/CHoCH)
✅ Trade after confirmation ⏱️
✅ Patience + discipline = profits 💎💹
7️⃣ Examples in Bitcoin Trading 🔍
Double top wicks above high → triggers stops 💥 → continues trend 🚀
Price dips below support → triggers stops 😭 → rebounds ⬆️
💡 Observation: Every wick tells a story 🌟 — learn to read it!
💬 Key Takeaways
Stop Loss Hunts = institutional footprints 👣
Price hunts liquidity 💧 — that’s why your SL is hit 💥
Understanding this helps you:
Trade smarter 💎
Avoid losses 😅💸
Spot trends before they happen 🚀

BCHUSD - The Squeeze is Tightening. Decision Imminent?BCH is providing a textbook example of Price Compression on the 4H timeframe.
When price gets squeezed between a rising trendline and horizontal levels, volatility usually follows. Currently, BCH is testing the validity of the trendline support.
Key Levels to Watch:
Support Defense: The bulls need to hold the $558 level to maintain the uptrend structure.
Invalidation: A breakdown of this trendline changes the market character from accumulation to potential distribution .
Trading Plan: Watch for volume on the reaction. A low-volume bounce might be a trap, while a high-volume rejection of the trendline confirms weakness.
Trade safe and manage your risk!

ETH/USDT Bullish Reversal SetupETH/USDT Bullish Reversal Setup
The chart shows a clear transition in ETH as price moves from a prolonged distribution-driven decline into a developing accumulation range. After weeks of consistent bearish structure, the market finally printed multiple upside shifts, signaling that sell-side pressure is weakening and liquidity behavior is changing.
The recent impulsive rally out of the discounted range confirms that buyers are actively defending lower levels. Price is now pulling back toward a short-term demand pocket formed during the breakout. This area represents the first meaningful accumulation zone after the market broke a series of internal swing points.
As long as price maintains stability within this demand block, the structure favors continuation toward the next major liquidity cluster above. The next upside draw is positioned around the 3,440–3,500 region, where previous inefficiencies and unmitigated zones converge. That region also holds resting buy-side liquidity, making it the logical target for a future expansion move.
The current market behavior suggests that ETH is in the early phase of a bullish repricing cycle. A controlled pullback into the highlighted zone—followed by a reaction—would confirm continuation and attract momentum buyers aiming for the higher liquidity magnet.
Overall, this chart reflects a shift in narrative: sellers are losing dominance, the market is building a fresh bullish structure, and the path of least resistance is gradually tilting upward as long as the demand zone remains protected.

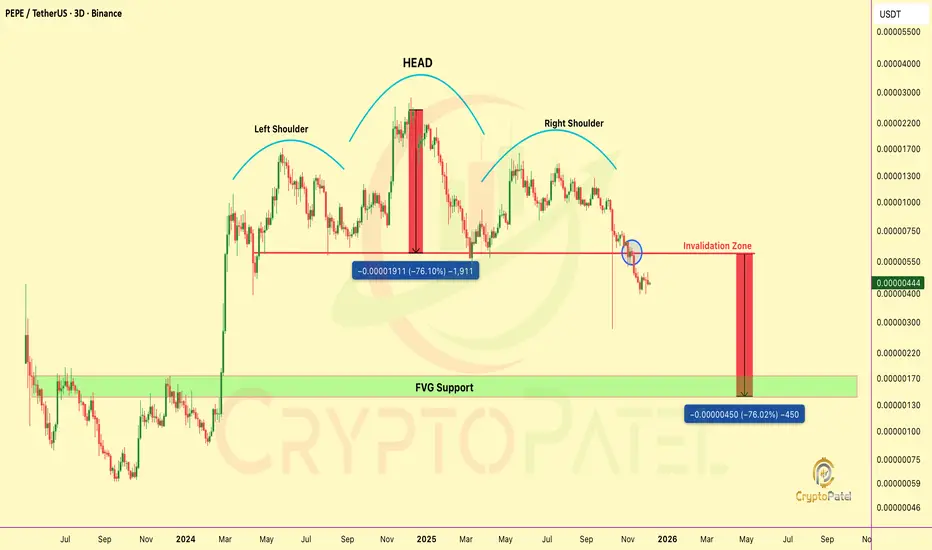
$PEPE TA Update: What PEPE Head & Shoulder Pattern Say?CRYPTOCAP:PEPE TA Update: What PEPE Head & Shoulder Pattern Say?
Head & Shoulders = Bearish
70% retracement possible ( Neck Line Support Broken )
Key Support $0.000006, Now Strong neckline support became strong resistance
Below NeckLine Support = 50-70% drop to $0.00000150
Hold & reclaim $0.000006 = bullish Reversal
NFA & DYOR
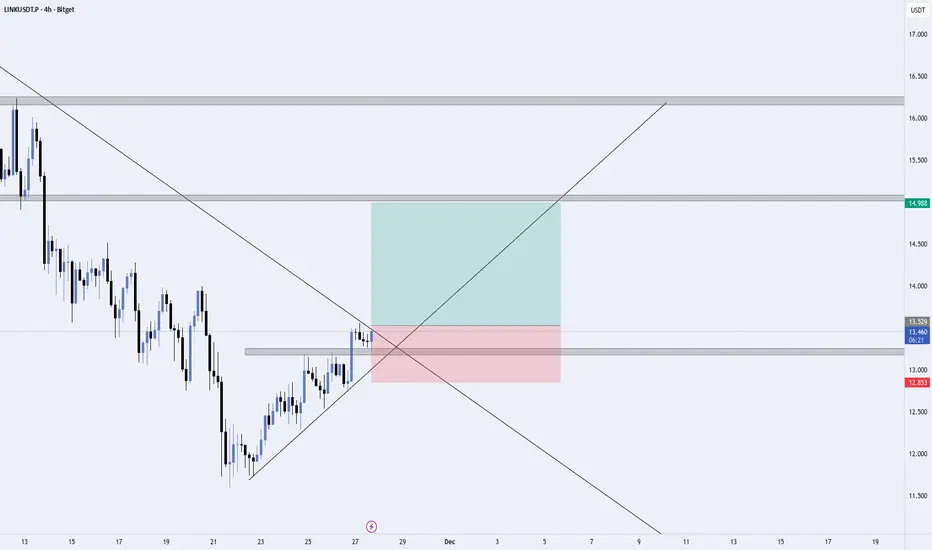
LINK/USDT – Breakout Retest Setup (4H Chart)LINK is showing a potential trend reversal after breaking its major descending trendline.
Price has also retested the previous resistance zone, which is now turning into support.
📌 What I'm Seeing
Strong bullish push from the recent lows
Break above the downtrend line (possible trend reversal)
Price retesting the grey resistance zone, holding as support
Higher-lows on the trendline showing buyers are in control
📈 Trade Plan
Entry: After retest of support (current zone)
Stop Loss: Below the grey zone + below the structure low
Target: The next major resistance around $14.98
This gives a clean Risk-to-Reward setup with structure-based stop and clear target.
🎯 Why This Setup Works
Trendline breakout = first sign of reversal
Retest confirmation shows buyers stepping back in
Market structure is shifting from lower-lows → higher-lows
Clean liquidity zone above, giving bulls room to push
⚠️ Risk Note
Wait for a clean bullish candle before entering.
Crypto is volatile — use proper risk management.
BTCUSD Liquidity Sweep Setup Before Bearish ContinuationBTCUSD Liquidity Sweep Setup Before Bearish Continuation
Overview
BTCUSD continues to display persistent downside pressure across the mid-term structure. Price action on the 3H timeframe shows a sequence of lower highs and lower lows, reflecting sustained bearish control. Despite short periods of stabilization, the overall market environment remains distribution-driven.
Market Structure
Recent price behavior confirms multiple break-of-structure (BOS) events, each reinforcing the broader downward momentum. Every attempt at upward expansion has been met with supply absorption, indicating that buyers are failing to regain initiative. The consolidation developing in the current region suggests an accumulation of short-term liquidity, but without structural evidence of reversal.
Supply & Liquidity Context
Price is positioned directly beneath a key supply zone highlighted on the chart. This zone remains unmitigated and acts as the primary area where counter-trend reactions are likely to be absorbed. The tightening range beneath this level indicates liquidity buildup, commonly preceding engineered sweeps by institutional players.
The current model suggests that the market may execute a short-term liquidity run above local highs before resuming its downward trajectory. Such a move would align with previous behavior in this trend cycle, where short-term rallies were primarily used to deliver liquidity into higher-timeframe supply.
Downside Expansion Risk
Should the market complete a liquidity sweep into the supply zone, the next phase of downside continuation becomes probable. The structural projection on the chart anticipates a revisiting of the lower demand region around 74,300 – 75,000, an area aligning with previous inefficiencies and untested demand.
This target supports the continuation of the broader bearish structure unless a significant shift in order flow emerges.
Summary
BTCUSD remains positioned within a well-defined bearish cycle, characterized by repeated structure breaks and unmitigated supply zones controlling price. Current compression suggests the market is preparing for another liquidity-driven move. Unless buyers regain structure above the key supply region, the market retains a high probability of extending toward lower demand zones.

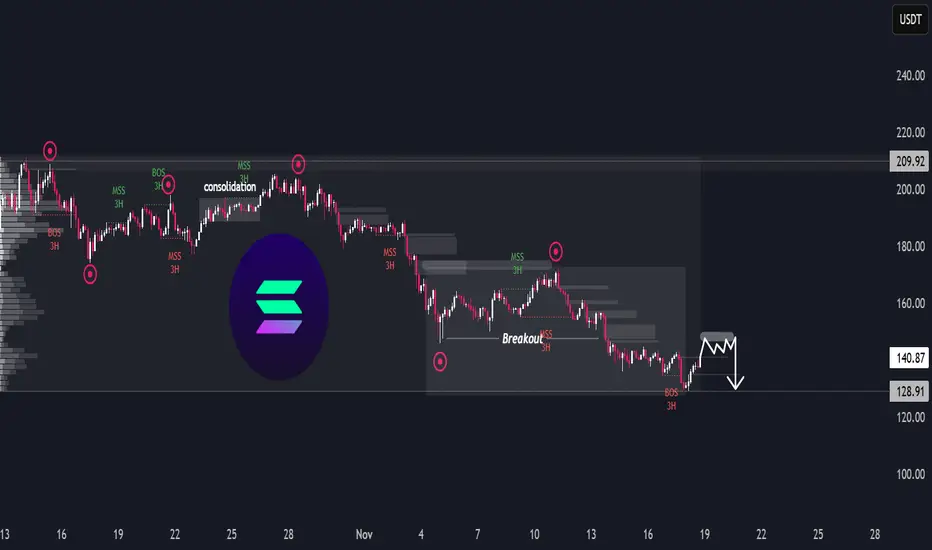
SOL/USDT – Downside LoadingSOL/USDT – Downside Loading
The chart shows a prolonged distribution phase followed by a steady macro decline, with multiple structure breaks confirming a persistent bearish flow. After the earlier consolidation in the upper range, each attempt to reclaim previous highs has been met with a shift in momentum, leading to progressive downside sequences.
The recent breakout from the lower range transitioned into continued weakness, indicating sellers remain in firm control. Despite short-term rebounds, the overall behaviour reflects a market that is unwinding previous demand zones rather than building new ones.
At the current level, SOL is forming a tight corrective pattern, suggesting price is building liquidity before the next directional move. Given the broader trend context, this type of compression typically precedes continuation rather than full reversal. The chart’s projection implies a potential liquidity sweep on the minor rally, followed by renewed downside pressure once short-term buyers are exhausted.
Overall, the environment still favours the bearish continuation scenario unless the market shows a decisive shift in character backed by sustained strength — something not yet present.
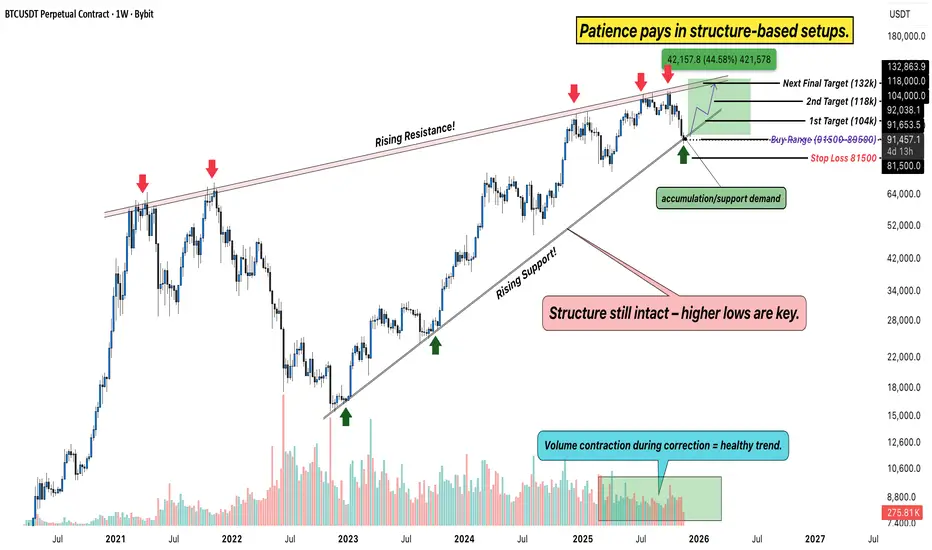
Bitcoin Weekly Chart – Structure Still Intact, Patience is PowerHello Everyone, i hope you all doing good, Lets discuss about bitcoin. After weeks of consolidation and volatility, Bitcoin is back at its rising support zone, where strong hands usually step in. The structure on the weekly chart continues to hold higher lows, a clear sign that the broader trend remains bullish despite short-term pullbacks.
Technical View
Rising Channel: BTC continues to move within a rising channel, with clear reactions from both support and resistance levels. The current price is testing the buy range between 81,600–89,500, an area that has historically acted as a high-probability reversal zone.
Resistance Levels: Key upside levels to watch are 104K, 118K, and the final target zone near 132K, the same rising resistance that rejected price multiple times in past cycles.
Support: As long as BTC stays above 81,500, the structure remains valid. A weekly close below this zone would invalidate the bullish bias.
Volume Behavior: Notice how each correction comes with lower volume, a healthy sign of accumulation, not distribution.
Big Picture
This phase often shakes out emotional traders while rewarding the ones who trust structure and time. If Bitcoin holds this zone and begins to bounce, it could mark the start of the next major wave, potentially aiming for a new cycle high in the coming months.
Rahul’s Insight: Big moves don’t start with hype, they start with quiet structure and strong conviction. The crowd reacts; the disciplined trader prepares.
Analysis By @TraderRahulPal | More analysis & educational content on my profile.
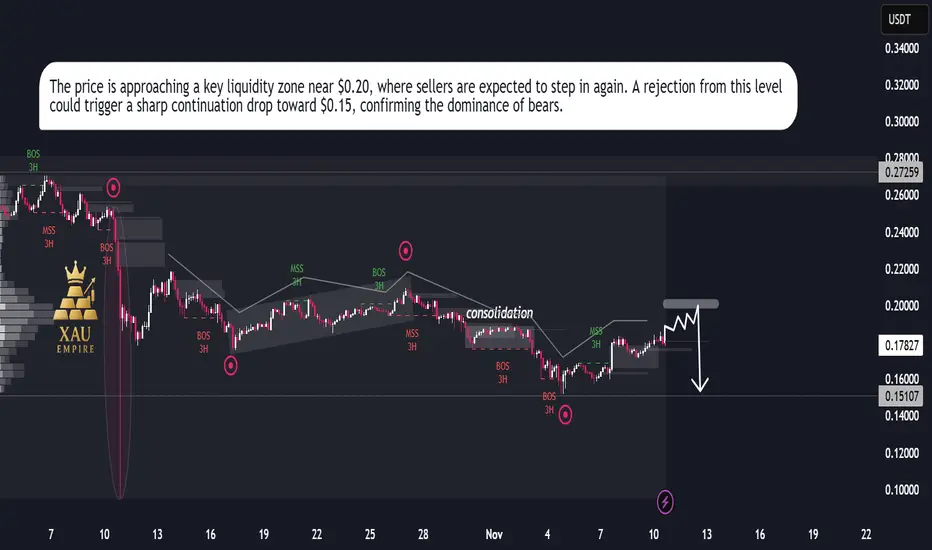
DOGEUSDT – Bearish Setup Toward $0.15DOGEUSDT – Bearish Setup Toward $0.15 📉
Dogecoin remains under strong bearish pressure, following multiple Breaks of Structure (BOS) and Market Structure Shifts (MSS) on the 3H timeframe. After a brief consolidation phase, price continues to respect the descending trend, indicating a lack of bullish strength.
Currently, DOGEUSDT is attempting a minor upward correction, likely to retest the $0.20 supply zone — a region that could act as a liquidity grab before the next major downside move. If price fails to hold above that zone, the market may trigger a sharp drop toward the $0.15 level, confirming continuation of the broader bearish trend.
Momentum remains weak, and sellers continue to dominate short-term rallies — suggesting further downside pressure in the coming sessions.