solana usdtsolana touching a major trendline of whole bearish market and a good reversal pattern is forming if brokeout can give a good move
Cryptotrading

Ldousdt breakoutLdousdt good coin to invest in spot
As a metaverse coin i am adding this in coin in this weekly breakout from a resisance
And il hold it till next bull run

$BTC Daily Update$BTC #BTC $23,479 key support held as expected, $24,690 resistance testing. $24,129 support remains untested yet. Bullish engulfing on last 1D close, requires follow up from today's close. Regaining $24,690 will bring $24,969 reattempt. Weekend is here with bullish engulfing👀👀

$BTC Daily Update$BTC #BTC last 1D closed bearish, $25,095 resistance rejected. Current support $23,713 testing, $23,479 key support as of now. $24,129 will resist.

$BTC Daily Update$BTC #BTC brokeout $24,129 resistance area, $24,969 resistance holding. Testing $24,690 support. DOJI played out with amazing follow up on 1D. Last 1D close hella bullish. $24,690 support yet to be gained if broke $24,129 could be test which will be crucial to hold as a support.

Hedera HashgraphOn-Chain Analysis
According to DefiLlama, the total value locked (TVL) of Hedera has grown by 88% since 1st Jan 2023 and currently stands at $44.2 million. This increase is driven by the sustained success of Saucerswap and launch of Heliswap and Bubbleswap, as per Messari report.
Technical Analysis
The two most important metrics in the analysis is price action and volume. Our aim is to trade with trend and trend direction is governed by momentum. When momentum decreases, there is a high probability of market moving sideways.
To determine momentum of trend, we will use price and volume.
1. When price crosses above 7-moving average price or breaks resistance with 7-moving average volume > 21-moving average volume, we can say there is high momentum and lesser probability of price breaking below that particular resistance.
2. When price crosses above 7-moving average price or breaks resistance with 7-moving average volume < 21-moving average volume, we can say there is low momentum and higher probability of price again moving below that particular resistance.
Support level: 0.847
Resistance level: 0.993
RSI: 70 (high momentum)
MACD> signal line
Note:
Note:
Please DYOR before trading/ investing.
Studies are for educational purposes only.
We will not be responsible for any kind of your Profits & Losses.

$BTC Daily Update$BTC #BTC Yes! Doji on 1D played out with follow up from last 1D close, $22,379 resistance rejected. $21,791 support yet to be tested. Requires to take $22,750 support to resume the climb.

$BTC Daily Update$BTC #BTC $21,452 retested, DOJI on last 1D close looks very good, requires follow up from current daily close. $21,791 resisting hard. Continue watching given S/R areas.

This time it is different or is it the same?The two graphs seem similar in nature.
The question is will BTC follow the same trajectory as that of 2019 before the major bull run of 2020-2021 ?
Let us know your views in the comment section...!!!

Oasis Network: Privacy focused smart contract platformROSE is the token of the Oasis Network Platform and is used for transaction fees, staking, and delegation. According to DefiLlama, total value locked ( TVL ) has increased by approx. $2m in 2023 and currently stands at $22.06m.
Technical Analysis
Price of ROSE has increased by 92% in 2023. In the daily timeframe , the token broke its resistance on 21st Jan 2023 and saw an upward momentum of 43%.
0.07244 level is currently acting as a resistance level and 0.06230 as a support level .
Teak Finance Watchlist: We provide a list of tokens based on our indicators on a daily basis.
Check out the list: in.tradingview.com
Note:
Please DYOR before trading/ investing.
Studies are for educational purposes only.
We will not be responsible for any kind of your Profits & Losses.

$BTC Daily update$BTC #BTC $22,379 support came in effect breaking key support at $22,750, initial resistance expected from $22.750. Last 4H close with bearish engulfing, Failed to follow thru on bullish engulfing on 1D. Continue watching given S/R

GLMR | UnforgettableThe price is too low and the trend has been broken. Resistance levels are shown on the chart. Once the resistances are passed, it will work as a support. Red boxes or lines are for daily tf.
The targets shown are for the short term.
Good Luck.

Will GRT continue the rally?GRT is the token of an indexing protocol, Graph. The token has gained over 132.9% in the month of February.
According to Dune Analytics, the total number of users of the protocol has increased by approximately 34% in the past year. The token saw 66% QoQ increase in revenue from query fees, as per Messari report. The increase in on-chain metrics strengthen the
Technical Analysis
Price moved above 0.1493 resistance with high volume, the level of 0.2067 is acting as resistance for the current price. If price moves above this level with high volume, we can further see the gain in price. 20-EMA can be used as a stop loss or entry point.
The Teak Finance screener had selected the coin and has seen a gain of approximately 50%. Have a look at the screener. The screener gets updated on a daily basis and provides a pool of tokens to trade in.
Screener: in.tradingview.com
Note:
Note:
Please DYOR before trading/ investing.
Studies are for educational purposes only.
We will not be responsible for any kind of your Profits & Losses.

$BTC Daily Update$BTC #BTC $23,197 regained and testing, last 4h close very bearish. Put bullish engulfing on yesterday's close, requires follow up today. $23,479 resistance in effect as expected, $23,713 support crucial to regain. Continue watching given S/R

Daily Screener: STXUSDTFrom a pool of thousands of tokens, selecting the right token for trading becomes difficult. Retail investors often invest / trade when the tokens are already up by 60-70%.
To resolve this, we have designed a screener to screen tokens gaining momentum.
Today's screener token: STXUSDT
Screener Logic:
Price (close) > Parabolic SAR
AND
MACD > MACD signal
AND
Supertrend gives buy signal
Timeframe: 1d
Reward to Risk Ratio : 2
Note:
The token selection is based on various technical indicators and there is always the risk of losing money while trading. Please DYOR before trading/ investing.
Studies are for educational purposes only.
We will not be responsible for any kind of your Profits & Losses.
Follow us for more updates.

$BTC Daily Update$BTC #BTC on $22,750 support, last 4H close not good, support testing. $23,479 resisting hard since weekend. $22,750 at risk with next support at $22,379, initial resistance from $23,197.

UNIUSDT CRYPTO crypto name : uniusdt
call type : positional
- crypto is sideways from last 300 days and forming a triangle pattern, currently crypto is breaking the channel
- forming lower high and lower high
- we can accumulate this crypto at current levels for target 10 $ , 12 $ and 18 $
Thanks


ATOM/USDT Double Top PatternDouble Pattern is seen in COMOS ATOM/USDT hourly chart.
Entry we can enter short trade after close of strong bearish candle at resistance zone.
Target will be the next support zone.
Stoploss will be above the resistance zone.
Please Like, and Follow me

BTCUSD - 45M PROJECTIONDISCLAIMER: The Company accepts no accountability or obligation for your trading and speculation results, and you consent to hold the Company innocuous for any such outcomes or misfortunes. We are not financial advisers or account managers; We are Forex traders. The recordings on this channel are rigorously for educational and amusement purposes. Trading Forex implies dangers, and you can lose all your venture ; consequently, you exclusively must take a chance.

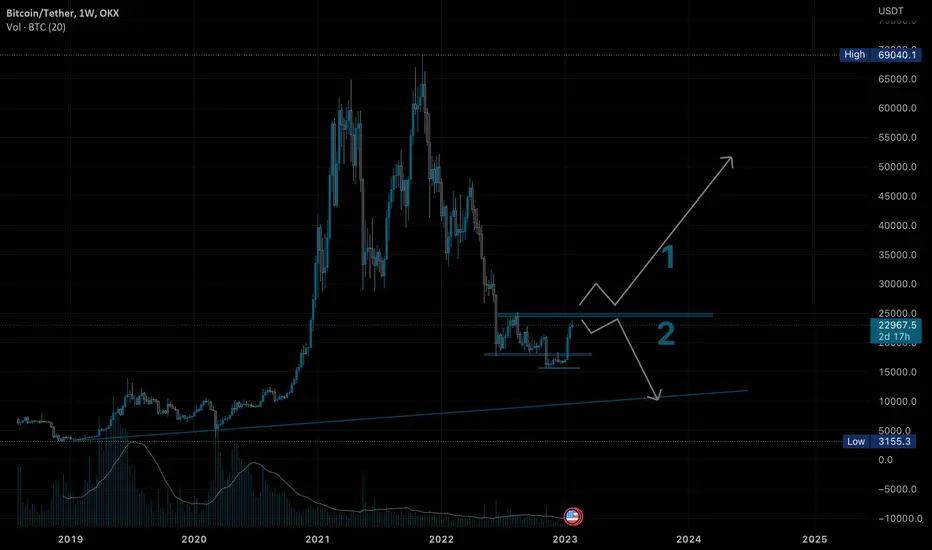
Bitcoin next move update1 or 2 ?
Lets not guess.
Lets react to the market
If guessing is the game i’l go with 1
#fingerscrossed
matic bullishcreating a base just below strong resistance ..
can be a good buy abv 1.05
and good for investing also
MLong
