LSK/USDT Daily TFLSK/USDT - Price action analysis
Resistance turned into support
currently price is at support level - aggressive traders can buy at this level
for safe players buy above the trendline resistance
Target - 10$ and above (long term)
#tradewithelplan #tradewithaplan
Cryptotrading

BTC price action I am sharing 4hr timeframe chart just to give you all clear view of what happening with regards to $BTC
Since BTC started its downward movement after hitting 69k. BTC was moving downward in a parallel channel. After the breakout of the channel. BTC got rejected at 51.9k and again it started moving in a new downward Parallel channel.
As you can see BTC price is still going downward but the RSI is moving up. Which is a hidden bullish divergence and same divergence can be seen on daily timeframe.
Note: These are just my observations. Kindly DYOR.

MDX/USDT 4H TFMDX/USDT - price action analysis
price breakdown from support and given huge fall
currently price is consolidating in range 0.35$ - 0.45$
price is taking trendline resistance - had huge liquidity above trendline
entry above trendline and given range
Target - 1$
#tradewithelplan #tradewithaplan

Weekly BTC-USD(3rd December)After the last weekly gains, BTC again witnessed a bearish movement and closed the week with a 6.90% decline. It continues to consolidate in the range of $45,000 to $51,000 for the 4th straight week, which suggests that the tussle between bears and bulls is still going on and there is no definite trend. At the time of writing, BTC is trading slightly above $47,000.
On the Daily TF, BTC is sustaining below its 200-DEMA but managing to hold its support presented by 0.786 Fibonacci level which is present at $46,200.The trading range has been diminishing for the past 5 days and a breakout to both sides can be expected in the coming weeks.
On the higher side, the immediate resistance is placed at $48,500, if BTC manages to close above this level, the next potential hurdle is present at $50,000 followed by $52,000. On the other hand, the nearest support is present at $45,600 but if it breakdowns below this level, the next major support level is placed at $44,500 followed by 43,500.
As per the Momentum indicators, the weekly MACD has turned bearish and further downside corrections can be expected, whereas, Weekly RSI is trading flat in the range 43-46. According to the current technical charts, we advise traders to wait for the market to depict a definite trend before taking any new positions

ETH/USDT on 15 mins chart.ETH is making a traingle or pennant pattern on 15 mins chart. With a good breakout and retest we have a long opportunity where we can quick scalp for $70 move.
Trade safe. Let the resistance zone drawn be broken


Cardano making a breakout of rising wedge patternAda/usdt is making Rising wedge pattern and also giving a breakout on bullish side.
If price sustains after breakout and retest the level we can go long on the trade

Weekly BTC-USD(27th December)After consolidating in the range of $46,000 to $50,000 from the last 15-20 days, BTC closed the last week on a positive note with ~8.81% gains. Other crypto assets also witnessed a positive week as the combined crypto market increased from $2.10 Tr to close the week at $2.395 Tr. BTC formed a strong weekly candle which slightly depicts further movement to the higher side that can be expected in the coming days.
As per the Daily TF, BTC is trading between its 200-DEMA and 50-DEMA for the last 4 days but the trading range is getting narrower with every passing day, which suggests that a breakout can be expected in the coming days. On the higher side, the immediate resistance is presented by 50-DEMA which is placed at $52,500, however, a decisive breakout above this level can trigger a fresh new move to the higher side till the first level of $54,000 followed by $55,600.
On the lower side, BTC has sustained above its 200-DEMA from last 4-5 days, which suggests that strong buying pressure is present at this level, but if bears managed to break this level again, downside rally can continue for the first level of $48,500 followed by $46,000.
As per the candlestick patterns, BTC has formed a Bullish Engulfing kind of pattern on the weekly TF which suggests that trend reversal is on the cards, however, momentum indicators are still lagging the strength, therefore, we advise traders to Go long only with tight Stop Loss.

Ethereum on edge.Ethereum is on edge. The green line must be saved at all costs. It's a Lakshman Rekha. Price almost crawling on the line.
Above that the bull market still intact.

Small Trade in Wazirx cryptoSmall trade opportunity in Wazirx(WRX).
Target 1: 2.020 (USDT)(20 days)
Happy Trading!

Weekly BTC-USD(20th December)Bears continue to dominate the crypto markets as well as the traditional equity markets due to the news flowing in about the Omnicon Virus outbreak in many parts of the world. The combined Crypto M.cap declined by more than 4% last week whereas BTC prices took a dip of 6.79% in the same period. At the time of writing, BTC is slightly trading below the level of $46,000.
On the weekly TF, BTC formed a solid bearish candlestick which depicts negative sentiments in the market. The nearest support is presented by its 50-WEMA, placed at $44,800 as a strong recovery was witnessed from these levels. On the Daily TF, BTC is forming a descending channel kind of formation, depicting that market trend to be sideways to bearish.
On the higher side, the immediate hurdle is present at $48,000 followed by $50,000 as its 200-DEMA is also present at this level, decisive closing above the $50K would be the first signal for the trend reversal. On the lower side, the support is present at $45,400 followed by $44,000.
Momentum indicators like RSI are depicting flat sentiments as it is trading in a range from the last 3-4 days. BTC is most likely to trade in the range of $48,500 to $44,000 for the coming days, so we advise traders to wait for the market to break any major level before taking any new positions.

ETH May reach 4600$ again As you can see a falling wedge pattern which confirms that the ETH is gonna rise
I have given the possible target and The support and resistance range, SO that we can buy the ETH in DIP. After a little more fall.
Views are purely educational in nature. You are solely responsible for any decisions you take on basis of my research.

$AVAX to 190! Rising Wedge & Hidden Bullish DivergenceHave a glance at the above chart. We see AVAX has been following a rising wedge kinda pattern and according to fibonacci retracements & Fib Time we have 190 on the table. Also pay attention to the bounce that might happen according to the rising wedge, we also see a hidden bullish divergence Hold your bags!
DYOR 💎🤝

Elliott Wave Corrective Wave Theory- DYDX to $28 soon! Hi traders, pl. refer to the above chart for knowing how Elliott Wave Correction Theory is currently forming up on DYDX. Some pointers-
* DYDX has stopped forming new lows rather forming equivalent lows which shows end of an impulse downside move.
* We see huge volume expansion showing the interest of people
* We see RSI bullish exaggerated divergence meaning the Price is forming flatter bottoms but the RSI looks bullish as it forms lower highs.
* We have entered wave A
HODL

Sleeping Giant AXIE to $300 soon! Fibo & Rising Ladder Hi Traders & Hodlers, here is my analysis for Axie, pls refer to the above chart. Hold your bags 🚀🚀💎💎

BNB - 4th elliott wave may be in progressIf the fourth Elliott wave is in progress, it will not go below around 500-530 levels. If that fulfills, we can get a fifth wave which can take BNB to 800-1000 levels.

Fibonacci Retracement 61.8%Shib should form its base around these levels to begin the next upmove
Disclaimer: View for Education purpose only, not to be taken as trading advice.

Rounding Bottom Pattern on Weekly TFRounding Bottom Pattern on Weekly TF
ETHERUM to outperform Bitcoin in upcoming times as the price action tells.
Disclaimer: view for educational purpose only, not to be taken as trading advice.


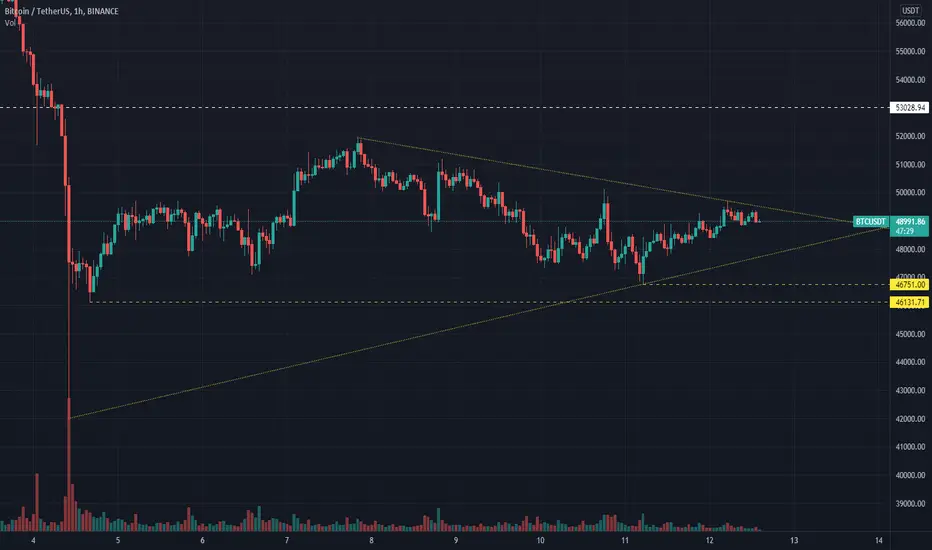
BTCUSDFormed a triangle pattern on hourly time frame connecting the big bearish candles, if the lower trendline breaks with fine volumes then below two mentioned levels are probable to be shown on the charts.
Near Breakdown :BitcoinThis is not an investment advise!!!
Inverted Cup and Handle is formed on hourly timeframe on BTC
Price can retest the support line before achieving target levels of 43000-43500.
* I'm not an expert analyst. This is something is just learnt, so I'm sharing this with public.
If you guys find anything wrong with this post, you can tell me about that in comments.
Have a nice day!😄

Head and Shoulders Breakdown on SOLThis is not an investment advise!!!
Head and shoulders pattern formation on SOL on a DAILY timeframe
Target should be around 120-130 levels
* I'm not an expert analyst. This is something is just learnt, so I'm sharing this with public.
If you guys find anything wrong with this post, you can tell me about that in comments.
Have a nice day!😄

Head and Shoulders Breakdown on BNBThis is not an investment advise!!!
Head and shoulders pattern formation on BNBUSDT on a hourly timeframe
Target should be around 520-525 levels
* I'm not an expert analyst. This is something is just learnt, so I'm sharing this with public.
If you guys find anything wrong with this post, you can tell me about that in comments.
Have a nice day!😄
