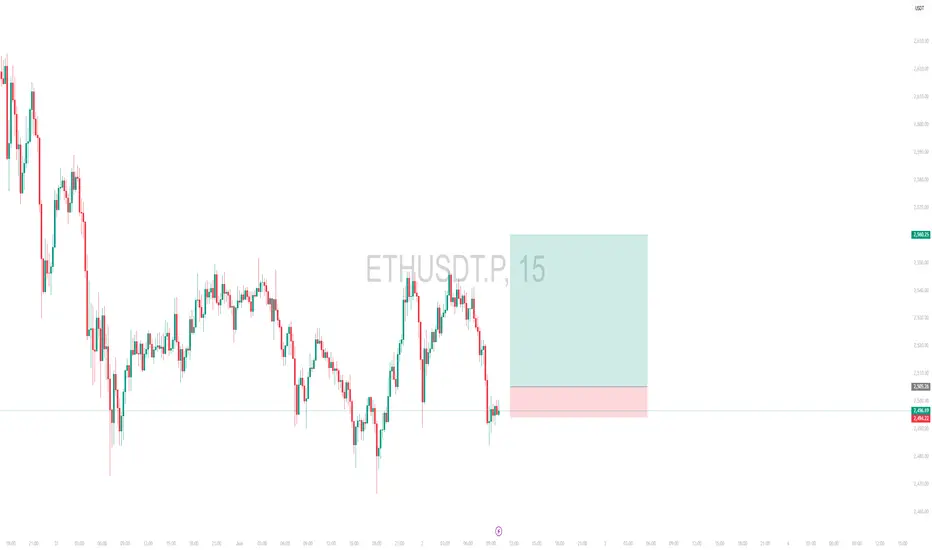
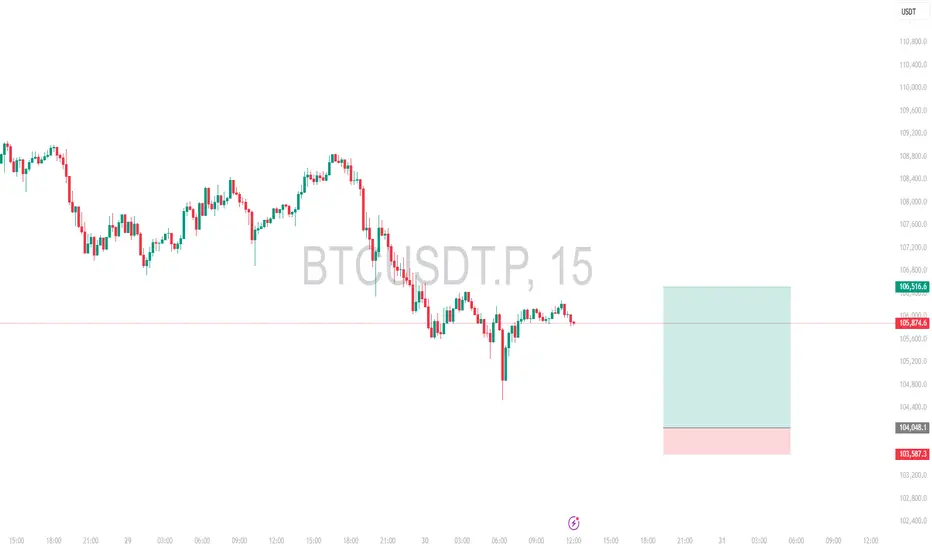
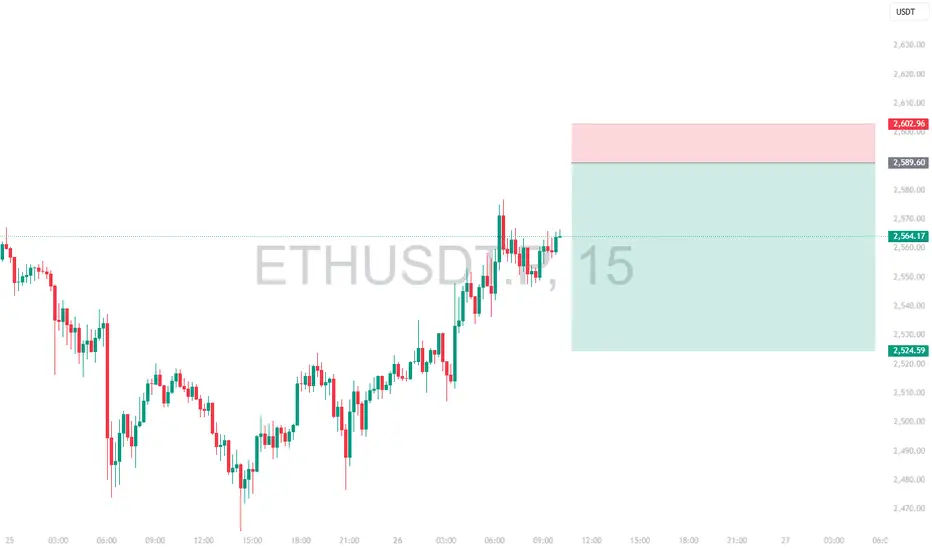
Intraday Long Setup | June 2nd 2025 | Valid Until Daily ClosePrice is retracing to a strong pivot zone (marked by the red box).
Structure remains bullish with potential for continuation after pullback.
The green box represents a high-probability long opportunity with tight risk control.
Watch for price reaction within the red zone. Entry only if confirmation (e.g., bullish engulfing, strong wick rejections) appears.
The setup expires at end of the daily candle close.
Cryptotrading
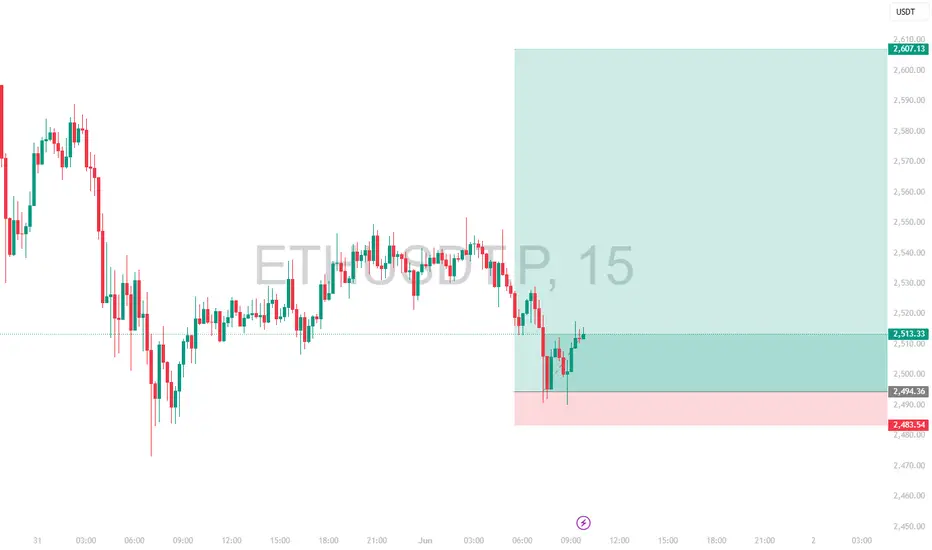
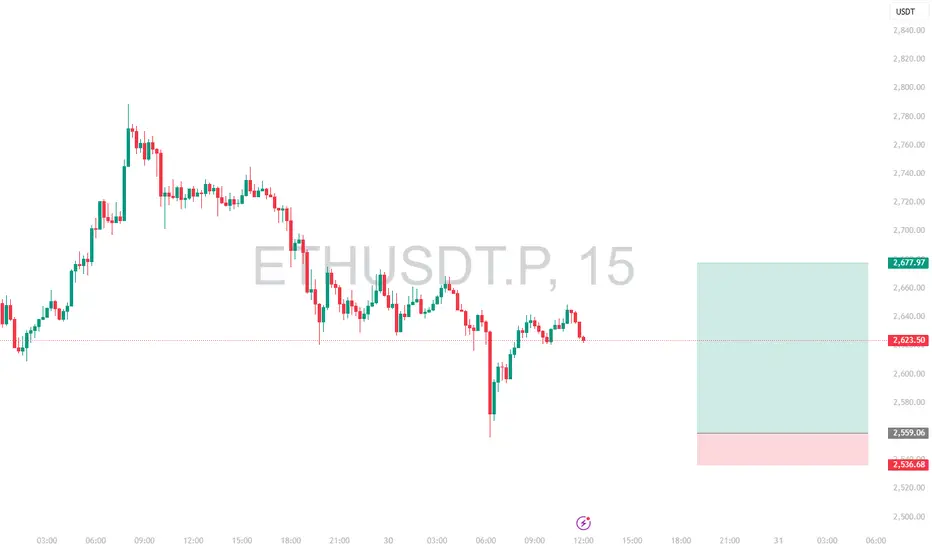
Intraday Long Setup | June 1st 2025 | Valid Until Daily ClosePrice is retracing to a strong pivot zone (marked by the red box).
Structure remains bullish with potential for continuation after pullback.
The green box represents a high-probability long opportunity with tight risk control.
Watch for price reaction within the red zone. Entry only if confirmation (e.g., bullish engulfing, strong wick rejections) appears.
The setup expires at end of the daily candle close.
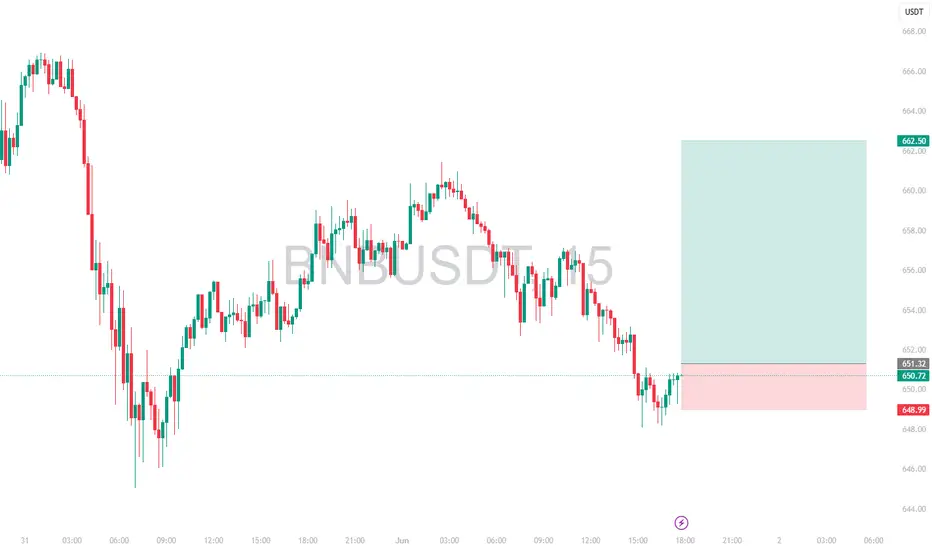
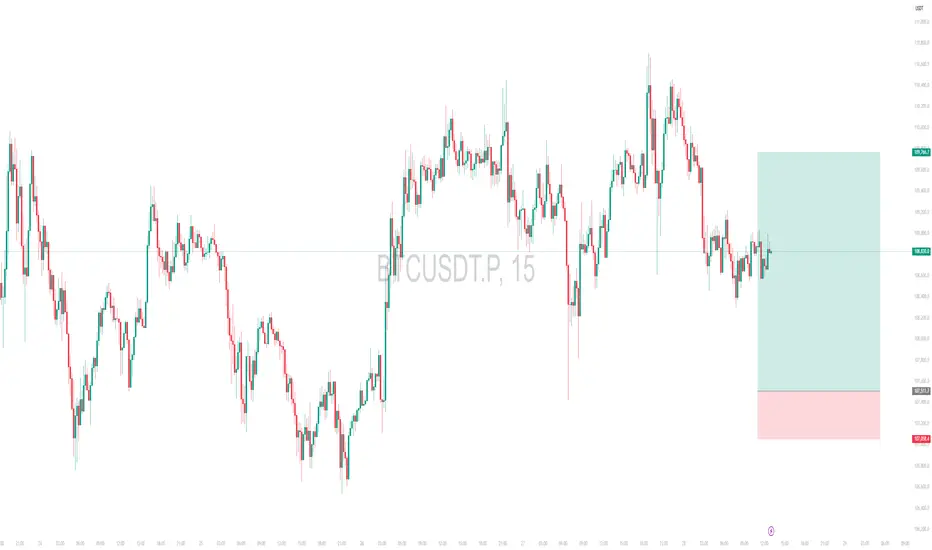

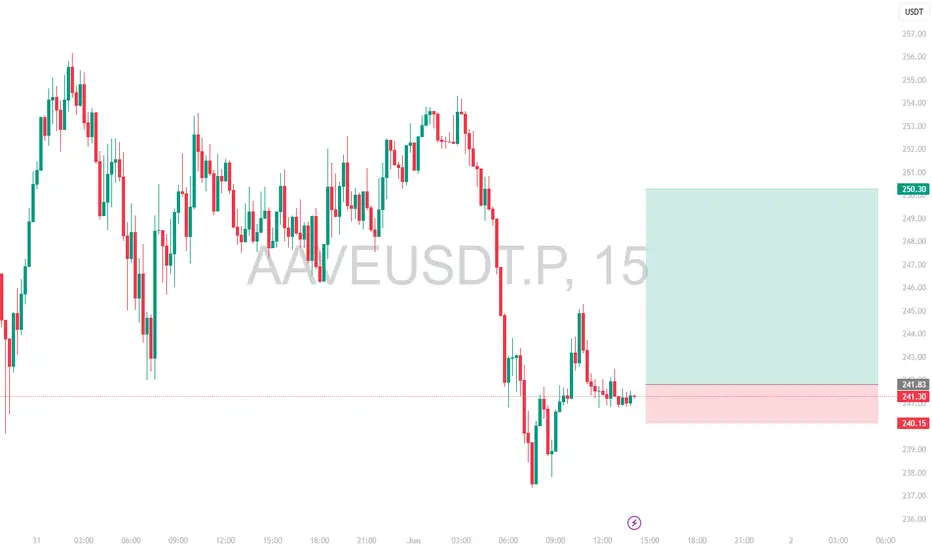
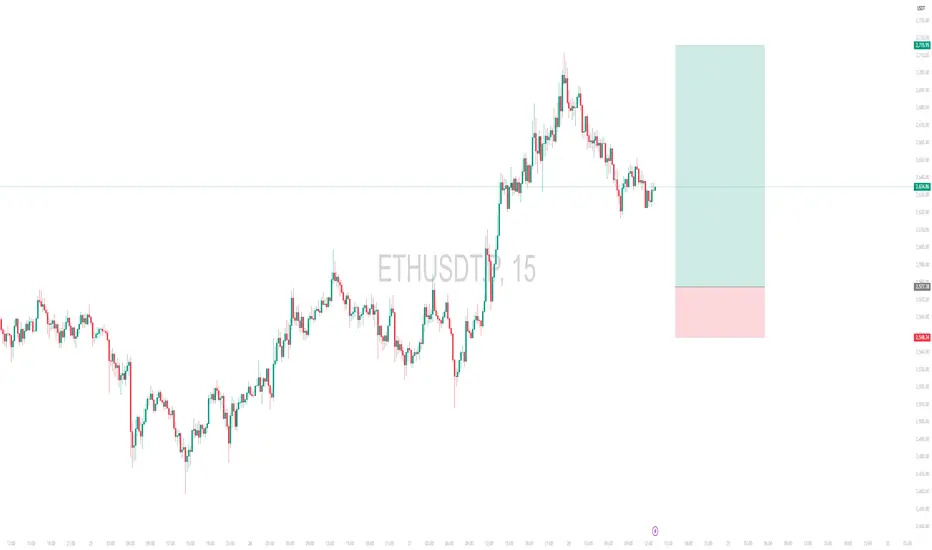
Intraday Long Setup | June 1st 2025 | Valid Until Daily ClosePrice has retraced to a strong pivot zone (marked by the red box).
Structure remains bullish with potential for continuation after pullback.
The green box represents a high-probability long opportunity with tight risk control.
Watch for price reaction within the red zone. Entry only if confirmation (e.g., bullish engulfing, strong wick rejections) appears.
The setup expires at end of the daily candle close.
Intraday Long Setup | May 30th 2025 | Valid Until Daily ClosePrice is retracing to a strong pivot zone (marked by the red box).
Structure remains bullish with potential for continuation after pullback.
The green box represents a high-probability long opportunity with tight risk control.
Watch for price reaction within the red zone. Entry only if confirmation (e.g., bullish engulfing, strong wick rejections) appears.
The setup expires at end of the daily candle close.
Intraday Long Setup | May 28th 2025 | Valid Until Daily ClosePrice is retracing to a strong pivot zone (marked by the red box).
Structure remains bullish with potential for continuation after pullback.
The green box represents a high-probability long opportunity with tight risk control.
Watch for price reaction within the red zone. Entry only if confirmation (e.g., bullish engulfing, strong wick rejections) appears.
The setup expires at end of the daily candle close.
BTCUSDT.P | Intraday Short Setup | 26th May 2025Price is pushing into a key pivot based resistance area (highlighted in red).
Looking for a clean rejection with a 1R move to secure partials, then possible continuation toward lower levels.
Managing risk tightly as structure unfolds.

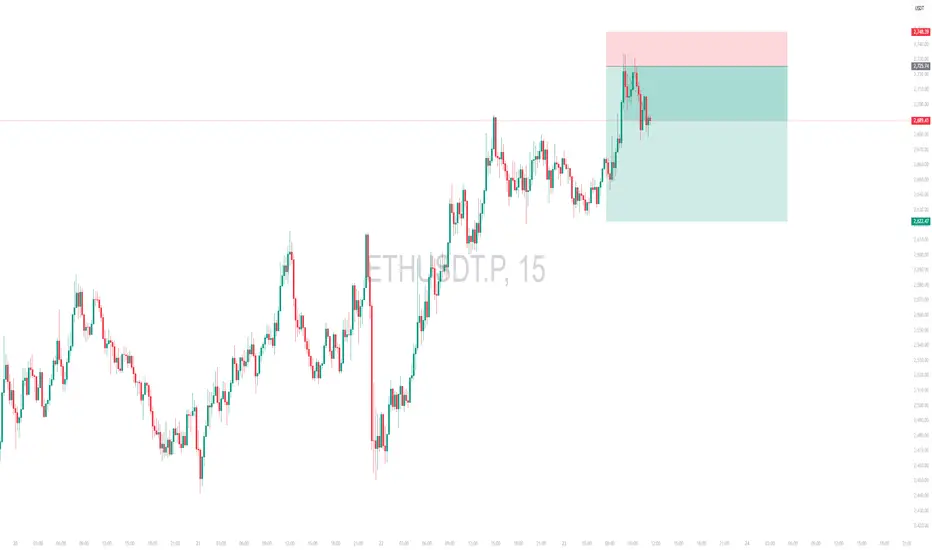
Intraday Short Setup | May 26th 2025 | Valid Until Daily ClosePrice has pushed into a potential intraday Pivot supply zone (red box) where sellers may step in. This trade is based on the expectation of a rejection from this area.
Entry: Red box — a short entry zone aligned with overhead supply
Stop Loss: Above the red zone (invalidates the setup)
Target: Green box — area to consider partial/full exit based on momentum
ETHUSDT has shown a strong bounce but is now approaching a key pivotal resistance zone
Risk-reward is favorable with a tight invalidation and clean downside target
Price may stall or reverse near the red box, creating short opportunity
Note:
This is an intraday trade idea that expires at 00:00 UTC (Daily Candle Close). Re-evaluate the setup if price remains indecisive near the entry zone close to that time.
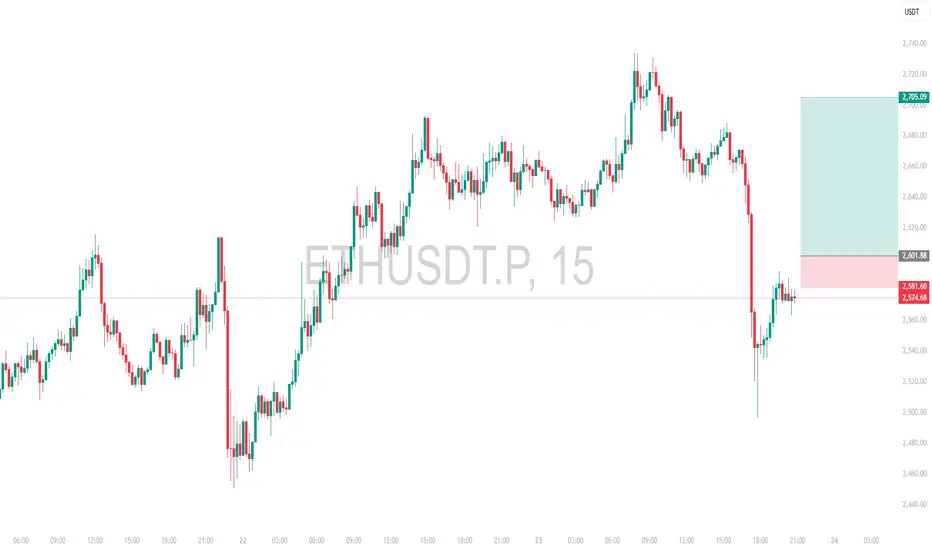
Intraday Short Setup | May 23rd 25 | Valid Until Daily CloseThis is the trade I was looking for but was too early for my day!
Price has pushed into a potential intraday Pivot supply zone (red box) where sellers may step in. This trade is based on the expectation of a rejection from this area.
Entry: Red box — a short entry zone aligned with overhead supply
Stop Loss: Above the red zone (invalidates the setup)
Target: Green box — area to consider partial/full exit based on momentum
ETHUSDT has shown a strong bounce but is now approaching a key pivotal resistance zone
Risk-reward is favorable with a tight invalidation and clean downside target
Price may stall or reverse near the red box, creating short opportunity
Note:
This is an intraday trade idea that expires at 00:00 UTC (Daily Candle Close). Re-evaluate the setup if price remains indecisive near the entry zone close to that time.
Intraday Long Setup | May 23rd 25 | Valid Until Daily ClosePrice has retraced below a strong pivot zone (marked by the red box).
Structure remains bullish with potential for continuation after pullback.
The green box represents a high-probability long opportunity with tight risk control.
Watch for price reaction within the red zone. Entry only if confirmation (e.g., bullish engulfing, strong wick rejections) appears.
The setup expires at end of the daily candle close.
Technical Levels Respected – BTC Reaches $108K Target📍 BTC Target Hit with Precision!
✅ As predicted in the previous analysis, Bitcoin has successfully tapped the $108K resistance zone — clean and technical execution!
📊 My chart spoke in advance... and the market listened.
🎯 Why miss out on these accurate forecasts?
📉 My strategies are not just random lines — they’re built on solid market structure, EMAs, and key price action zones.
📢 Let’s stay connected!
🧠 I’m committed to sharing educational content and professional trading insights to help you grow as a trader.
💡 Whether you're a beginner or seasoned trader, there’s always something new to learn with me.
📚 Join the journey — learn, trade, and win!
📩 DM or follow to get consistent updates and chart breakdowns.
🚀 Let’s trade smart, not hard!

Chainlink (LINK) – Momentum Shift with Strong EMA ReclaimLINK is showing a clear structural shift, having reclaimed both the 20-week and 200-week EMAs, signaling a potential transition from accumulation to expansion. The recent sweep of liquidity near $14 further strengthens the bullish case.
This setup provides a clean opportunity to enter on retracement to support, with solid upside if the momentum holds.
🔹 Entry Zone:
$13.00 – $13.50 (support + previous liquidity sweep zone)
🎯 Take Profit Targets:
🥇 $20 (HTF resistance)
🥈 $25 (macro range mid/high)
🥉 $30 (prior major resistance)
🛑 Stop Loss:
Daily close below $12.00 (structure invalidation)

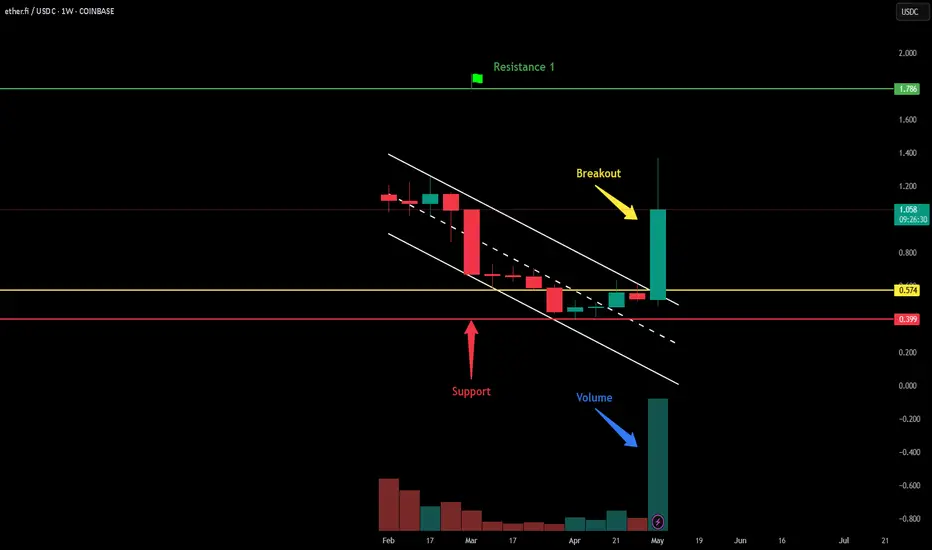
Breakout in ETHFI / TetherUS...Chart is self explanatory. Levels of breakout, possible up-moves (where crypto may find resistances) and support (close below which, setup will be invalidated) are clearly defined.
Disclaimer: This is for demonstration and educational purpose only. This is not buying or selling recommendations. Please consult your financial advisor before taking any trade.
Huge fall in bitcoin, let's play some contra now with small SLHello Traders! In today’s post, we’re looking at Bitcoin (BTC) on the 15-minute chart. The price is currently showing a potential reversal setup, with the market consolidating around 78,000. The recent price action suggests that Bitcoin could either push higher or face further downside depending on how it reacts to this level.
The MACD is showing some Bullish crossver on chart, may be we can see some positive reversal momentum from here, but watch for the price action to confirm whether a reversal is likely. If Bitcoin does not take our stop loss, we could see a move toward 79,892. Stay sharp, and as always, manage your risk effectively!
Disclaimer: This analysis is for educational purposes only. Please consult a financial advisor before making investment decisions.
If you Found this helpful? Don’t forget to like, share, and drop your thoughts in the comments below.

Hedera (HBAR) Spot Trade SetupWith HBAR trading at a key support level, this presents a solid long opportunity if buyers step in to defend the zone. A successful bounce could push the price towards key resistance levels.
🛠 Trade Details:
Entry: Around $0.18 (Support Level)
Take Profit Targets:
$0.25 - $0.285 (First TP Zone - Initial Resistance)
$0.35 - $0.39 (Second TP Zone - Major Resistance)
Stop Loss: Just below $0.175
Watching for bullish confirmation before entry. 🚀

Bitcoin Price Analysis: Breakout, Resistance Zone & Key Support Hello Traders! In today’s post, we’ll explore the technical analysis of Bitcoin, one of the most popular cryptocurrencies in the market. It's essential to keep an eye on key levels like resistance zones and support levels to trade Bitcoin effectively. If you want to master these setups, understanding Bitcoin's price action is crucial.
Looking at the Bitcoin chart, we can see a strong resistance zone that has been tested multiple times around 41,586, marking significant price rejection points. After the breakout above this zone, Bitcoin continued its upward journey, with targets set around 76,494 (a potential 104% upside). However, there's also a possibility of a pullback, with Bitcoin falling to a key support zone between 71,000-72,000. If the price retraces to this level, it could provide a good entry point for traders looking to ride the next leg up. The best support zone for Bitcoin is highlighted around 71,500, which could act as a strong buying opportunity. With Bitcoin currently in a strong upward trend, understanding these levels will help you make more informed decisions in your trading strategy.
Disclaimer:- This analysis is for educational purposes only. Please trade responsibly and consult a financial advisor before making any decisions.
If you found this analysis helpful, don’t forget to like, follow, and share your thoughts in the comments below! Your support keeps me motivated to share more insights. Let’s grow and learn together—happy trading!

Fair Value Gaps (FVG): The Secret to Smart Money Trading!
Hello Traders! Have you ever noticed sudden price movements leaving behind gaps in the chart ? These are known as Fair Value Gaps (FVGs) —a concept used by smart money traders to identify price imbalances, liquidity zones, and high-probability trade setups. Today, let’s break down how to trade price imbalances & FVGs like a pro!
1. What is a Fair Value Gap (FVG)?
Fair Value Gaps (FVGs) occur when the market moves aggressively in one direction, leaving a three-candle price gap with no opposing orders filled.
FVGs represent areas where institutional traders may re-enter the market to balance liquidity.
These gaps often act as magnetic zones, meaning price tends to fill the gap before continuing the trend.
2. How to Identify an FVG on the Chart?
Look for a strong impulse move (big bullish or bearish candle).
The gap is formed when the low of the first candle and high of the third candle do not overlap.
Mark the area between the first and third candle, as this is the Fair Value Gap zone.
Price is likely to retrace back into the gap before resuming its trend.
3. How to Trade Price Imbalances & FVGs?
Entry Strategy: Wait for price to retrace into the FVG zone. Enter a trade when price shows bullish or bearish confirmation.
Confirmation with Indicators: Combine FVGs with order blocks, liquidity zones, or moving averages for extra confluence.
Stop-Loss Placement: Set your stop-loss below the gap (for buys) or above the gap (for sells).
Profit Targets: Aim for the next liquidity zone, resistance, or trend continuation level.
Watch for Fakeouts: Sometimes, price partially fills the gap before reversing, so wait for strong confirmation before entering.
4. Examples of FVGs in Different Market Conditions
Bullish FVG: If price breaks out aggressively and leaves a gap, it often retraces to fill the FVG before continuing upward.
Bearish FVG: A strong downside move creates a gap, and price retraces to fill the imbalance before resuming its downtrend.
FVGs in Forex & Crypto: These gaps occur across all markets—stocks, forex, and crypto—and can be used for high-probability setups.
5. Risk Management & Key Considerations
Don’t trade every FVG blindly! Wait for confirmation before entering a position.
Use FVGs in confluence with market structure, such as higher highs/lows or order blocks.
Avoid trading FVGs in choppy markets, as liquidity imbalances are less reliable in sideways price action.
Always manage risk! Even high-probability setups can fail, so use proper stop-loss placement and risk-reward ratios.
Conclusion
Fair Value Gaps (FVGs) offer high-probability trading opportunities by helping traders identify liquidity imbalances and institutional moves. By understanding and applying FVG strategies, you can improve your trade entries, risk management, and overall profitability!
Have you used Fair Value Gaps in your trading? Let’s discuss in the comments!

The Importance of Liquidity in Trading: Don’t Ignore This!The Importance of Liquidity in Trading
Hello Traders! Ever wondered why some trades get executed instantly while others experience slippage? The answer lies in liquidity —one of the most crucial yet overlooked factors in trading! Whether you’re a day trader, swing trader, or investor , understanding market liquidity can help you make better trade decisions, minimize losses, and improve execution. Let’s dive into the importance of liquidity in trading!
1. What is Liquidity in Trading?
Liquidity refers to how easily an asset can be bought or sold without significantly affecting its price.
A highly liquid market has many buyers and sellers , ensuring smooth transactions with minimal price impact.
Low liquidity can lead to high spreads, slippage, and erratic price movements , making trading riskier.
2. Why is Liquidity Important for Traders?
Better Trade Execution – High liquidity ensures faster order execution at the expected price, reducing slippage.
Tighter Bid-Ask Spread – Liquid markets have lower spreads , meaning you pay less in trading fees and get better entry/exit points.
Lower Volatility – Highly liquid assets tend to be less volatile , offering more stable price action .
Easier Position Sizing – Large orders can be executed smoothly without drastically moving the market.
Avoiding Market Manipulation – Low liquidity markets are more prone to price manipulation , making it riskier for traders.
3. How to Identify Liquidity in the Market?
Check Volume – Higher trading volume indicates better liquidity . Look for assets with consistent daily volume.
Monitor the Bid-Ask Spread – A tight spread between buy and sell prices suggests a liquid market . Wider spreads indicate lower liquidity.
Use Order Book Analysis – A deep order book (many buy/sell orders) means higher liquidity, while a shallow order book signals lower liquidity.
Look at Market Depth – Trading platforms provide market depth charts showing available liquidity at different price levels.
Observe Price Slippage – If your trade executes far from your intended price, liquidity may be low.
4. High Liquidity vs. Low Liquidity Markets
High Liquidity Markets – Examples: Nifty 50, S&P 500, Bitcoin, Forex major pairs . These markets have higher volume, tight spreads, and smooth trade execution .
Low Liquidity Markets – Examples: Small-cap stocks, exotic forex pairs, illiquid crypto assets . These markets tend to have wider spreads, higher volatility, and potential price manipulation .
5. How to Use Liquidity for Better Trading?
Trade in High Liquidity Assets – Choose stocks, forex pairs, or crypto assets with high volume to avoid slippage.
Use Limit Orders – Market orders in low liquidity markets can cause unexpected price jumps , so use limit orders to control execution price.
Analyze Institutional Activity – Smart money trades in liquid markets. Watch for volume spikes and order flow to track their moves.
Avoid Illiquid Trading Hours – Liquidity drops outside major market hours, so trade during high-volume sessions for better execution.
Conclusion
Liquidity plays a vital role in trade execution, risk management, and overall market stability . Whether you’re scalping, swing trading, or investing , understanding liquidity can help you avoid bad trades and improve profitability .
Do you check liquidity before placing trades? Let’s discuss in the comments!
Will BNB hit $5000 in future?Back in 2020, I said GETTEX:BNB will hit $500 when it was just $16… and y’all laughed. 🤡
But guess what? It didn’t just hit $500… it went all the way to $800—a 50x from my entry! 😎💰
And yeah, right after I entered, GETTEX:BNB dumped almost 62%! 💀😂 But diamond hands win in the end! 💎🙌
Now, it won’t even drop below $500! 😏
Just wait… GETTEX:BNB → $5000 is only a matter of time! ⏳🚀
Not financial advice, so don’t blame me later. DYOR! 😆

Mastering Fractals: The Secret Weapon of Smart Traders!Hello Traders! Have you ever noticed that market patterns repeat across different timeframes? That’s where Fractal Theory comes in! Fractals are self-repeating patterns that occur at both micro and macro levels, helping traders spot trend reversals, breakouts, and entry points. Today, let's explore how to use fractals in price action trading to refine our strategy and improve accuracy!
1. What Are Fractals in Trading?
Fractals are recurring price patterns that signal potential reversals in the market.
These patterns consist of five or more candlesticks , where the middle candle is either the highest (bearish fractal) or lowest (bullish fractal) in a sequence.
Fractals help traders identify support, resistance, and trend shifts with better precision.
2. How to Identify a Fractal in Price Action?
Bullish Fractal: A price formation where the middle candle has the lowest low , surrounded by two higher lows on both sides.
Bearish Fractal: A price formation where the middle candle has the highest high , with two lower highs on both sides.
Multiple Timeframe Analysis: Fractals appear on all timeframes (from 1-minute to weekly charts), making them useful for scalpers, swing traders, and long-term investors.
3. How to Trade Using Fractal Theory?
Trend Confirmation: Combine fractals with indicators like Moving Averages, RSI, or Fibonacci levels to confirm trend direction.
Entry & Exit Signals: A bullish fractal near support may signal a buying opportunity , while a bearish fractal near resistance may indicate a potential sell signal .
Breakout Trading: Use fractals to spot breakout zones —when price breaks a previous fractal high (bullish) or low (bearish), it can confirm a new trend direction.
Stop-Loss Placement: Set stop-losses below bullish fractals (for buy trades) and above bearish fractals (for sell trades) to manage risk effectively.
Combine with Smart Money Concepts (SMC): Fractals align well with liquidity grabs, order blocks, and institutional moves , making them even more powerful when used with smart money trading techniques.
4. Limitations & Risk Management
Fractals are lagging indicators —they only confirm after the pattern has completed.
False signals can occur , so always confirm with volume, trend structure, or additional indicators.
Use risk-reward ratios wisely —never rely solely on fractals without a solid trading plan and stop-loss strategy.
Conclusion
Fractal Theory helps traders identify high-probability setups , confirm trend reversals , and improve trade entries & exits. By combining fractals with other technical analysis tools , traders can increase their accuracy and reduce market noise.
Have you ever used fractals in your trading? Let’s discuss in the comments!
