BUY TODAY SELL TOMORROW for 5%DON’T HAVE TIME TO MANAGE YOUR TRADES?
- Take BTST trades at 3:25 pm every day
- Try to exit by taking 4-7% profit of each trade
- SL can also be maintained as closing below the low of the breakout candle
Now, why do I prefer BTST over swing trades? The primary reason is that I have observed that 90% of the stocks give most of the movement in just 1-2 days and the rest of the time they either consolidate or fall
Trendline Breakout in CSBBANK
BUY TODAY SELL TOMORROW for 5%
CSBBANK

CSBBANK : Momentum Breakout with Sector StrengthThis trade is a classic momentum breakout setup. The price had been consolidating in a range since August 2025 and has now broken out with strong volume, indicating fresh participation. The broader finance and banking sector is also showing strength, which adds further confluence to the trade. Additionally, recent sales and EPS growth have been encouraging, supporting the bullish bias from a fundamentals perspective.
The only concern is that the price is currently extended from the 20 and 50 EMA, and there wasn’t a very clear basing structure before the breakout. However, considering the overall momentum and sectoral support, this can be managed by allowing some breathing room and using a slightly wider stop loss.
Based on this setup, the trade has been initiated with a defined risk of 1%.
📢📢📢
If my perspective changes or if I gather additional fundamental data that influences my views, I will provide updates accordingly.
Thank you for following along with this journey, and I remain committed to sharing insights and updates as my trading strategy evolves. As always, please feel free to reach out with any questions or comments.
Other posts related to this particular position and scrip, if any, will be attached underneath. Do check those out too.
Disclaimer : The analysis shared here is for informational purposes only and should not be considered as financial advice. Trading in all markets carries inherent risks, and past performance is not indicative of future results. It’s essential to conduct your own research and assess your risk tolerance before making any investment decisions. The views expressed in this analysis are solely mine. It’s important to note that I am not a SEBI registered analyst, so the analysis provided does not constitute formal investment advice under SEBI regulations.

Breakout in CSB Bank Ltd...Chart is self explanatory. Levels of breakout, possible up-moves (where stock may find resistances) and support (close below which, setup will be invalidated) are clearly defined.
Disclaimer: This is for demonstration and educational purpose only. This is not buying or selling recommendations. I am not SEBI registered. Please consult your financial advisor before taking any trade.

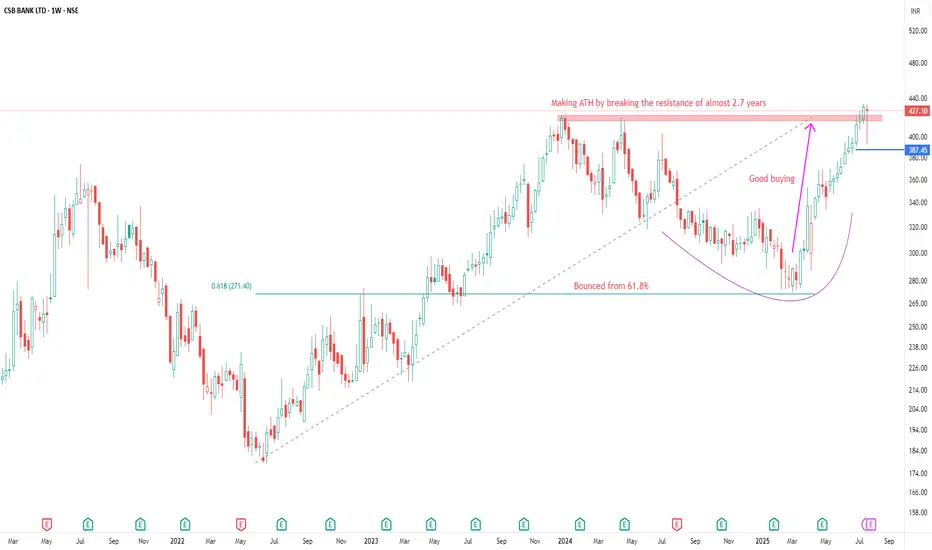
CSB BANK LTD ANALYSISFOR LEARNING PURPOSE
CSB BANK LTD - The current price of CSB BANK LTD is 427.10 rupees
I am going to buy this stock because of the reasons as follows-
1. Its coming out from a good consolidation base
2. It broke a strong resistance zone and it's making a new ATH and retested that level last week.
3. It is showing better relative strength as it stood strong in volatile times including last week.
4. The risk and reward is favourable. The good part- The stock is not extended.
5. The stock belongs to a sector which is quite strong i.e, Private Banks. The sector is in the consolidation after making new highs
6. The stock has done almost nothing in last 6 years i.e, it got listed in 2019 so it's more a laggard which is trying hard to do something now.
I am expecting more from this in coming weeks
I will buy it with minimum target of 35-40% and then will trail after that.
My SL is at 387.45 rupees
I will be managing my risk.
CSBBANK : Swing Pick#CSBBANK #BREAKOUTSTOCK #trendingstock
CSBBANK : Swing Trade
>> Breakout Candidate
>> Trending stock
>> Good strength & Volume
>> Good Upside Potential
Swing Traders can lock profit at 10% and keep trailing
Disc : Stock Charts shared are for Learning purpose and not a Trade recommendation.
Consult a SEBI Registered Advisor before taking position in it.

CSB Bank Short Term ViewBreakout above 365 on Closing basis.
Volume:
Volume is less than previous session by 12.67%.
Volatility:
ATR% of the stock is 3.46%
Average of last 20-day is 4.01%
Moving Average Observations:
Price remains above 200-day Moving average.
Price above 50-day, 100-day and 200-day Moving average.
RSI Observations:
The Daily RSI indicator has remained above 50. This is a bullish zone. Current Daily RSI reading is 60.95.
The Weekly RSI indicator has remained above 50. This is a bullish zone. Current Weekly RSI reading is 64.27.
The Monthly RSI indicator has remained above 50. This is a bullish zone. Current Monthly RSI reading is 58.48.
ADX Observations:
The Daily DMI position remains bullish.
The Daily ADX fell by -1.36%. Current ADX reading is 19.03.
The Daily distance between DMI lines is 27.01%.
The Weekly DMI position remains bullish.
The Monthly DMI position remains bullish.
Donchian Channel Observations:
Price is above middle Donchian channel (Bullish).
Bands are flat.
Difference between bands is 10.68%.
Ichimoku Observations:
Price above Ichimoku clouds.
Clouds are bullish.
Tenkan line is above Kijun line. Ichimoku setup is bullish.
Current cloud range is 1.28% and Future cloud range is 8.63%.
Bollinger Band Observations:
Price is above middle Bollinger band (Bullish).
Bands are converging.
Difference between bands is 5.29%.

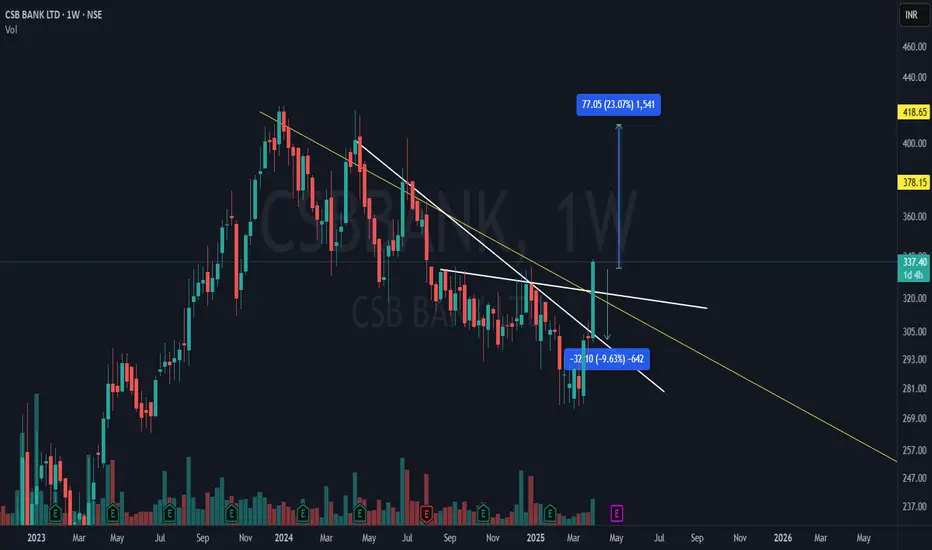
CSB Bank | WTF Breakout – Can Bulls Sustain? 📈 Stock: CSB BANK LTD (NSE)
Key Breakout Signals:
✅ CT Resistance (White Line) – Broken! A solid breakout on the weekly timeframe (WTF).
✅ Hidden Resistance Cleared! The lower white trendline resistance has been taken out.
✅ Monthly Resistance Ahead (Yellow Line)! Price approaching the higher timeframe barrier.
✅ Massive Volume Surge: Buyers stepping in strongly – Friday’s close will confirm!
🔥 A classic CT-based breakout setup with strong volume! Will bulls conquer the monthly resistance? Drop your views below! 👇
CSB BANK swing+positional bullishHello Everyone,
CSB bank taking Ema 200 supporrt and rsi positive divergence also a trendline support reatrce 50% from high overall bullish view 360,390,440+ possible.

CSB BANK: Big institutions calling!CSBBANK is at strong support and currently picked by BIG FIIs. Targets are marked as per Fibo Retracement. Follow after studying the setup.
NOTE: I'm not a SEBI REG. Study before investing.

Daily Bullish Flag Breakout in CSB BANKHi,
NSE:CSBBANK has given a Bullish Flag Breakout on Daily charts with very good volume.
MACD is also on the bullish side on daily and monthly time frames. RSI is also on the bullish side on daily and weekly time frames.
In the current market scenario I am expecting that the bullish momentum will continue.
Complete price projection like entry, stoploss and targets mentioned on the charts for educational purpose.
Please share your feedback or any queries on the study.
Disclaimer: Please consult your financial advisor before making any investment decision.

CSB bank-A private sector bank for long termDCB bank is close to a multi year breakout.
Once stock closes above 500, big targets can be expected.
Short term momentum traders can set a target of 500.
A good private sector bank with bettering fundamentals.

CSBBANK | Experiment📊 Details
CSB Bank (formerly The Catholic Syrian Bank Ltd) is engaged in the business of banking Services ,oldest private sector banks in India with a history of over 98 years, and a strong base in Kerala , Bank focus on SME, retail, and NRI customers.(Source : Company Web-site )
Disclaimer: This analysis is solely for educational purposes and does not make me a SEBI registered analyst.
If you found this analysis helpful, I encourage you to like and share it. Your observations and comments are also welcomed below. Your support, likes, follows, and comments motivate me to consistently share valuable insights with you.
🔍 More Analysis & Trade Setups 🔍
For more technical analysis and trade setups, make sure to follow me on TradingView: www.tradingview.com

Breakout alert in CSB bank.>>Stock has been in an uptrend since last year.
>>Over one year, it has been following a special trend line.
>>Since January 2023, it has slightly changed its direction and is now forming a beautiful
symmetrical triangle pattern.
>>Today, it has reached its resistance level and appears promising to break it.
>>If it breaks the trend line, we can initiate positions with a 1:1 risk-reward ratio as explained in the chart.
>>PSU banks were in the limelight today due to their exceptionally good Q1 results.
>>CSB banks also performed well, suggesting a brighter future for this stock.

CSBBANK BREAKING H&S PATTERNCSBbank breaking out h&s pattern
with good volume ,bullish RSI
MACD crossover done
educational idea only

CSB Bank - Long termTry CSB for above 295 weekly close for given target .
Study purpose only - Dont trade according to this view

CSBBANK F&P BREAKOUTCSBBANK breaking out from F&P pattern
trading above 20 ema
q4 result is expected today
trade at ur own risk

'Long' on CSB Bank for Short TermCSB BANK reached a 52W high of 275.05 on 19th Dec 2022, after which it went through a correction of nearly 21%. Well, the downtrend came to an end today, when it gave a breakout from wedge pattern rising by 8.89%.
In terms of price action, the stock is trading well above all the short-term and long-term moving averages.
RSI is above 55 and MACD gave bullish crossover above its signal line today.
Based on bullish moving averages and technical indicators, it is expected that the stock's price will continue to rise towards the assigned targets, with a recommended stop loss of 238.50 on a closing basis.


CSB Bank LimitedCSBBANK:- Head and shoulders pattern has formed, keep an eye
Hello traders,
As always, simple and neat charts so everyone can understand and not make it too complicated.
rest details mentioned in the chart.
will be posting more such ideas like this. Until that, like share and follow :)
check my other ideas to get to know about all the successful trades based on price action.
Thanks,
Ajay.
keep learning and keep earning.

CSB Bank Aiming 73% Upside!NSE:CSBBANK levels marked on the chart.
It has made a double Bottom and also this is a good Support level sustained in the past, so looks pretty nice from here


27/10/2021 Research Report For CSBBANK Disclaimer:
I am not SEBI registered person and this is not an investment advice and also please note this is only for education purpose. Also note we can use this research in my own portfolios. So don't influence yourself by this research. Please note before investing according to this educational research, please do own research and also do take advice from your financial adviser. Your any profits and loss are totally your liability. No one is liable for that. Also, please note we will not never compensate your any loss. So before investing any single rupee, please do your own research according to your risk taking capacity and after that do invest and book profits on right time.
Buy at 290
Target 1: 297
