CUB : 30-35% upside possible in near to mid termHi Friends,
CUB a great stock to hold now after 5 years of consolidation period. I am anticipating the stock to continue its upward journey after taking 5 years of time to gain energy .
Targets, Stoploss & Entry are mentioned in the chart . Please feel free to share your views regarding this chart & analysis .
Note : I am not a SEBI registered advisor . Please consider my analysis only for Education purpose .
CUB

City Union Bank: A Textbook Breakout After Years of ConsolidatioCity Union Bank has recently delivered a compelling technical setup that offers a classic case study in breakout trading. After years of sideways movement, the stock has finally breached a long-standing resistance level, signaling potential for a sustained uptrend.
🕰️ Multi-Year Consolidation and Breakout
Historical Resistance Breached: The stock closed above its January 2020 high yesterday, marking a significant breakout on a closing basis.
Consolidation Phase: From March 2020 to June 2025, the stock remained range-bound, forming a prolonged base. Such extended consolidations often precede powerful moves when broken.
Breakout Confirmation: The recent price action above the consolidation range confirms a major breakout, suggesting a shift in market sentiment and potential for trend continuation.
💪 Strength in Price Action
Sustained Above Key Moving Averages: The stock is trading well above its 50-day and 100-day moving averages. This alignment of short- and medium-term trend indicators reflects underlying strength and bullish momentum.
Momentum Building: The Relative Strength Index (RSI) has moved above 50 and is now attempting to cross 70, a zone often associated with strong bullish momentum. This supports the breakout narrative and indicates increasing buying pressure.
📚 Educational Takeaways
This setup offers several lessons for traders and investors:
Breakouts from Long Consolidations: When a stock breaks out after years of consolidation, it often leads to sustained moves due to pent-up demand and re-rating by market participants.
Closing Basis Matters: A breakout confirmed on a closing basis adds credibility, reducing the risk of false breakouts.
Moving Averages as Support: Trading above key moving averages reinforces trend strength and can act as dynamic support levels.
RSI as a Momentum Gauge: RSI crossing above 70 during a breakout can validate the strength of the move, especially when aligned with price and volume action.
🔍 Final Thoughts
City Union Bank’s recent breakout is a textbook example of how patience during consolidation can pay off. With price action confirming strength and momentum indicators aligning, this setup could serve as a valuable reference for traders studying breakout strategies.

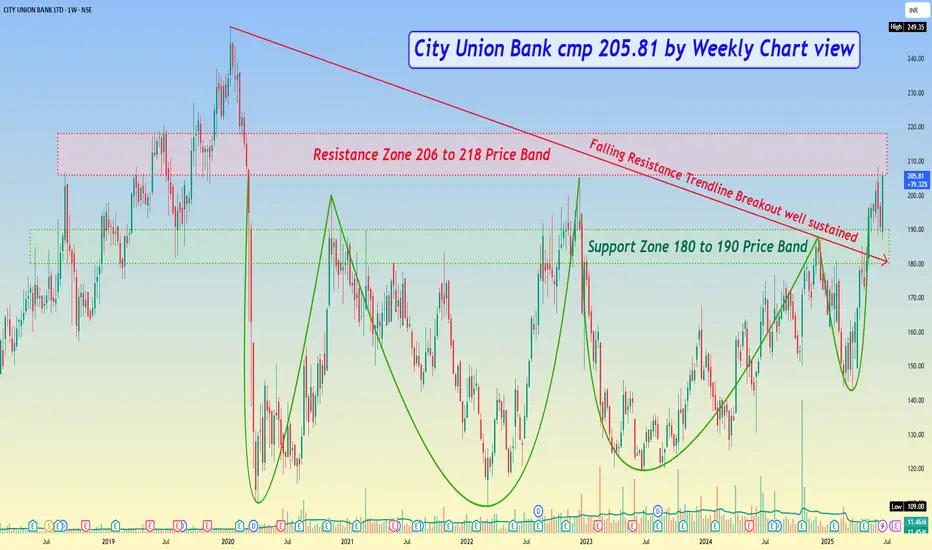
City Union Bank cmp 205.81 by Weekly Chart view*City Union Bank cmp 205.81 by Weekly Chart view*
- Support Zone 180 to 190 Price Band
- Resistance Zone 206 to 218 Price Band
- Falling Resistance Trendline Breakout well sustained
- Technical Indicators of EMA, MACD, RSI on positive trend
- Repeated Bullish Rounding Bottoms with considerate Cup & Handle
- *Resistance Zone neckline acting as good hurdle to cross since breakdown in March 2020*
CUB: 5 year trendline breakout? 4. CUB
➡️had been adding since September
➡️5 year trendline breakout possible
➡️ highest ever turnover and sales
➡️may move like PNB as NPA is reducing as well and has a similar structure
➡️may benefit from the impending RBI rate cut

CUB City Union Bank Compression Swing Long Setup - CUB is currently trading at 170.6 and is showing signs of a huge expansionary move on a 4H TF
- CUB is currently compressing and trying to take more and more Liquidity out
- Make a note of a liquidity grab or deviation possibility before this shoots up
- 166-168 can be a good area to look for longs

CUB - Bullish Breakout possibleAt weekly resistance
High volume activity
Bullish sentiment
Possible breakout

CITY UNION BANK OF INDIA Stock is consolidating from a long time now lows is shifting upside with a good divergence
we can see target of 233 and 267 in upcoming days

CITY UNION BANK CUBNote:
1. Views are personal and for educational purposes only. Recheck and take the trade as per your RR.
2. Always remember SL is your lifeline, not the big target...
3. Follow us for more patterns and like, share so that we feel it is helpful to many and share more patterns...
3. Views given here is not a tip rather it is for educational purpose... Aftermarket opens, the condition might change so learn to handle different conditions...
Keep an eye ladies and gentlemen. Cheers and Happy Trading

CUB Straight RiseCUB (LTP -159)
This is highly UNDERVALUED share at present and is ready for a BIG UPMOVE (20-25% straight rise soon)
Will be participating within risk appetite with SL of 5-6%
Patience will pay off

CUB (City Union Bank)CUB is showing strength and available at an attractive price which usually attracts big investors. One can enter above this zone or at the LTP for some accumulation.
NOTE: This is Weekly time frame and it may take a little longer to come up, so enter with that mindset.

#Long CUB#CUB swing to Short term stock.
Stock moved from a Strong Demand Zone. Stock has to give its minimum target.
Use your own Analysis.

CUB Bullish breakout analysis 21 Nov 23 CUB has given the breakout as can be seen on the chart. we can make a entry once it give us a retrace and then it goes bullish. you can buy the stock once it drops to price 144-146. and hold it till 160 with Risk:Reward :: 1:3 approx.
Reason:
Stock has given the breakout of rectangle pattern range 120-142. (Bullish)
Just EMA(13,200) crossover, also golden crossover. (Bullish)
Price > EMA(12,50,200). (Bullish)
RSI > 60 crosing to upside. (Bullish)
Verdict:
Bullish Breakout done
Plan of action:
Entry after retrace
BUY: 144-146 after retrace
Stoploss: 141
Target: 160

Unlocking Potential: CUB Surges Beyond a 10-Month Range!Dear Traders/Investors,
I invite you to watch the detailed analysis video on City Union Bank (CUB), where I have endeavored to provide a comprehensive overview of the stock. While the video primarily features analysis in Hindi, I am sharing the key insights in English here in the description.
Over the past 10 months, CUB has maintained a trading range of 119-146. Remarkably, the stock has now breached this range, closing above it, prompting us to consider it as a breakout. Notably, prior to this breakout, the price exhibited an uptrend, adding further conviction to the breakout scenario.
Our strategy involves observing a potential retest of the resistance zones as an entry point for the trade. We plan to employ swing lows as stop-loss and identify the nearest resistance levels as our targets.
It is imperative to note that this information does not constitute financial advice, and trading decisions should be made based on individual judgment.
Stay tuned for upcoming updates, and thank you for your attention.
Sincerely,
Rahul Khandelwal
Wealth By Trade

CUB at 10 year old trendline supportCUB is trading at 10 year old trendline support, this has acted as a good support for atleast three times in past and so far price has respected this in last weekly closing. Weekly RSI is currently around 32, which is indicating oversold and stock is trading near to its Covid Low.
Although, the stock is trading below most of the key moving averages but long term support zone provide here a good risk to reward in long side and fresh shorts here may be very risky unless and until price breaks down key support areas.
Anticipating here a turn around and may be in coming weeks price can form a double bottom on weekly charts to start its journey again on upside.

Sloping Trendline Breakout w. Good volume. Bullish @ Rs.132.CUB has broken out with volumes from its downward sloping trendline on the Daily chart in both price and volume. A gap exists just above Rs.135. Bullish for the next price of Rs.142. BULLISH.

CUB, 1D formed Bearish MarubozuNSE:CUB formed Bearish Marubozu on Daily TF and gave closing below it.
Entry : 129.25
Target : 121.55
SL : 137
RR : 1

City Union BankHi every one
This is best stock for investmenr
Entery 137 to 140 rs
Stop lose 124
TP 1 184
TP 2 205
TIme 90 days
Note: No buy sale tips
this my technical anlysis
consult your financial Advisor before taking risk


CUB - Looking good for Long CUB looking good for swing to short term
On weekly support.
Weak below 118.
Upside Targets - 135-140-150+

CUB Breakout above 145 will open door for 18% upsideCUB can move to 170 Levels after Breakout from current Neckline of H&S Pattern on daily charts @plenganawin145
LTP - 141.5
Targets 170+
SL - 138
Time frame - 25-30 days

CUB Looking ready for 15% UpmoveCUB can move up 15% for Targets of 160-165 in coming Months.
Happy Trading.

City Union Bank Share to hit a target of 180 CUB currently at a market price of 124 may hit the target of 180.
Stock may probably slips to 108 for its correction and will bounce back for its 189 journey

City Union Bank LimitedCUB:- Double bottom pattern has been formed and you can also call it W pattern. keep on eye
Hello traders,
As always, simple and neat charts so everyone can understand and not make it too complicated.
rest details mentioned in the chart.
will be posting more such ideas like this. Until that, like share and follow :)
check my other ideas to get to know about all the successful trades based on price action.
Thanks,
Ajay.
keep learning and keep earning.
