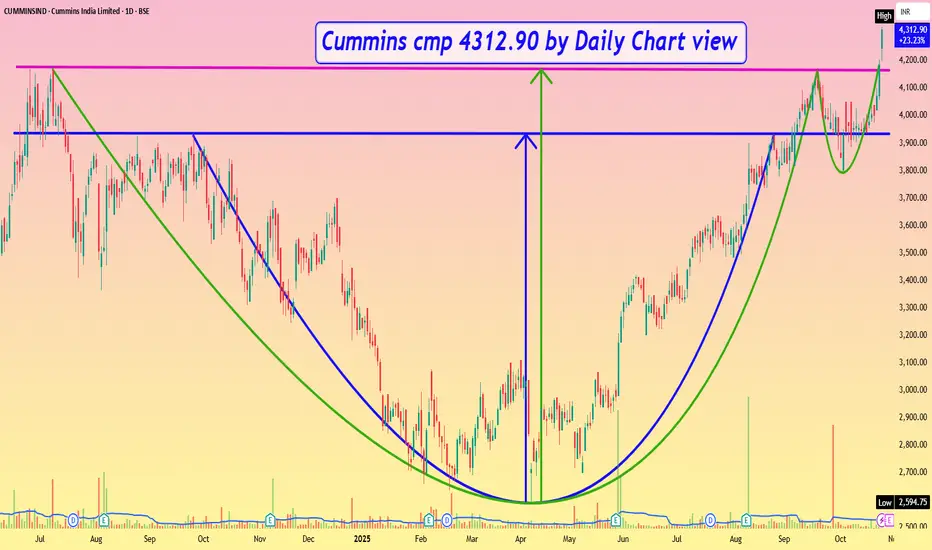
Cummins cmp 4312.90 by Daily Chart viewCummins cmp 4312.90 by Daily Chart view
- Support Zone 3900 to 4100 Price Band
- Only Resistance at ATH 4323.85 done today
- Very Strong Bullish Chart setup and Technical patterns made
- 1st Logical Target price level +/- 5250 by inner Rounding Bottom
- 2nd Logical Target price level +/- 5735 by broader Cup & Handle pattern
Cummins
Cummins India Break out stock for 28% Gain
Breakout above 200 SMA with Rising volume and positive MACD Divergence
Here's my analysis of Cummins India's financials:
**Net Profit:**
- Net profit for FY 2023-24: ₹2,533 crores ¹
- Net profit for FY 2022-23: ₹2,345 crores ¹
- Net profit for FY 2021-22: ₹1,944 crores ¹
- Net profit for FY 2020-21: ₹1,566 crores ¹
**Yearly Results:**
- Revenue growth: 15% CAGR over the last 5 years ¹
- Profit growth: 20% CAGR over the last 5 years ¹
- Operating margin: 15.6% in FY 2023-24 vs 14.5% in FY 2022-23 ¹
- Return on Equity (ROE): 23.1% in FY 2023-24 vs 21.5% in FY 2022-23 ¹
Overall, Cummins India has shown consistent revenue and profit growth over the years.
Note : May have open positions in this entity at various price levels.

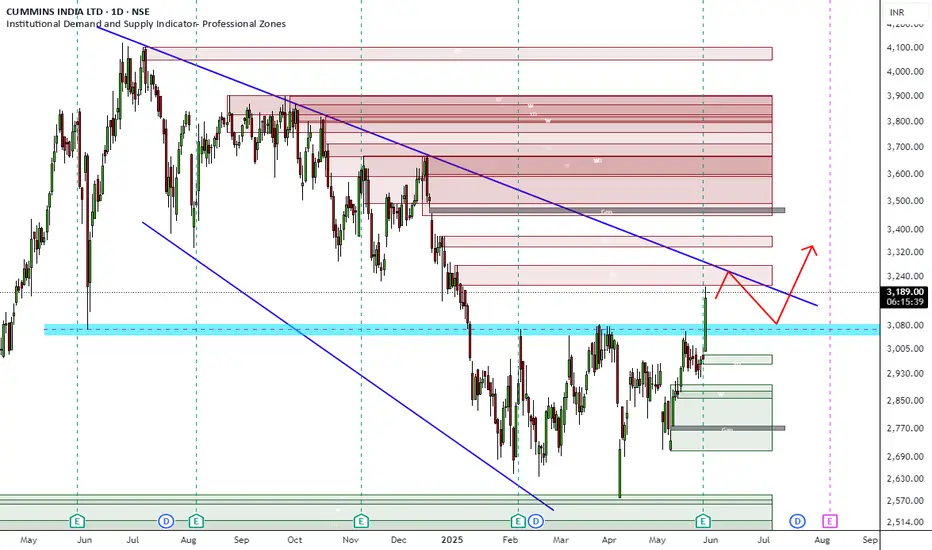
Cummins Ind - Many OpportunitiesStock reaching its daily supply zone
Which also happens to be its trend line resistance
Expecting a short down move from here
Downside now has a good resistance turned support at 3060 - 3080
Stock may try to bounce back from there to break the trend line and move higher
Play according, Keep proper Sl
CUMMINS INDIA Cummins India on the verge of breaking out of range we can see good long rally mic company with good fundamentals

Cummind India | Weekly LevelsStock currently hovering near Weekly Strong support levels, which extends downside upto 2625
As we can see stock is not making new highs but also not making new lows as well
There is also a daily strong area merged in the same zone, which can be considered as a good buying zone, with a downside Sl of 2600 (Closing basis)
If it manages to hold the mentioned area, then we can see a good upside upto 3250 / 3300 areas
Risk to reward ratio looks good
Lower time frame confirmation is a must
Broader market is bearish as well as chopp, so be cautious

Potential Channel Breakout: Cummins India Near 3950Details:
Asset: Cummins India Limited (CUMMINSIND)
Breakout Level: Above 3950
Potential Target: Significant upside potential beyond 3950
Stop Loss: Below 3950 or as per risk tolerance
Timeframe: Medium-term
Rationale: Cummins India has been consolidating for months and is now nearing the critical breakout level of 3950. A successful breakout from this channel could lead to a substantial upward move, making it a stock to watch closely for potential big gains.
Market Analysis:
Technical Setup: The stock has been consolidating in a channel and is approaching the breakout level of 3950. A breakout above this resistance could trigger strong bullish momentum.
Consolidation Phase: The prolonged consolidation suggests that the stock is building strength, and a breakout could be a signal for an extended upward trend.
Price Target:
The breakout above 3950 could lead to a significant move higher, with further upside potential as the stock gathers momentum.
Risk Management:
A stop loss below 3950 is recommended to protect against downside risk in case of a failed breakout or market reversal.
Timeframe:
The expected breakout and potential move higher could unfold over the medium term, though the actual timing depends on market conditions and the strength of the breakout.
Risk-Reward Ratio: A favorable risk-reward setup, with limited downside risk near the breakout level and significant upside potential if the breakout occurs.
Keep a close eye on Cummins India for a possible breakout, and be prepared to act based on technical signals and market conditions.

CUMMINS - Weak?Going by the structure of the Cummins, I believe the price action is getting weaker.
If the price doesn't sustain the lower border of the triangle, expect the downward momentum to gain strength.

NSE Cummins in a long term uptrend
On weekly basis showing strength and in a sustained upmove
Currently around 1700 or so. However there is a chance of reversal on the daily chart back to 1650. Keep this on your watchlist and buy in dips back to 1650
One good strategy could be taking a small position - 20% of your full size now and then catch more on the downside
Strong resistance at 1580-1600 and this can be used as the buy zone. Ideally buy stock for a 3-6 month period (8-12 weeks)

Cummins India Range BreakoutCummins broke from its range and is likely to do well. Trail Stop Loss accordingly in this one. Cummins India is a dominant player in generators and power generation. It is also working closely with the Indian Railways for the electrification of engines and is also building data centers for other companies.

CUMMIINS INDIA MONTHLYCummins India already break a major resistance and trading above is is showing good volumes on weekly and monthly charts and positive on Bollinger bands too, will be trade if break and close next resistance on monthly basis so adding in watchlist


Cummins India Chart Analysis !! 📈 Cummins India 📉
Today broke out from year 2021 high, 2017 high and approaching to all time high.
On Buy Side I am looking for Targets of 1190-100 zone.
StopLoss should be kept in 1005-1015 zone.
It offers 1:1 Risk To Reward.
All Important Supports and Resistances are drawn in chart. All levels are on closing basis.
Please have a look and revert back if you need some more study on it.
Disclaimer : Consult Your Financial Advisor Before Taking Any Decision On This Analysis.


Cummins India Ltd - 25.02.2022Cummins India Ltd - 25.02.2022
The stock is trading @ 959 levels
There is a RESISTANCE @ 980 levels
The prices are above EMA
There is a HAMMER in Daily Chart
RSI is 55 in Weekly Chart
watch out for the price action

BUY CUMMINS ABOVE 935Cummins looking good Buy above 935 for the upper marked targets on the chart.
To motivate us, Please like the idea If you agree with the analysis.
Happy Trading!
InvestPro India Team

Cumminsind buy above 1006Cumminsind has given a breakout and also seems to have retested it today.
Buy above 1006
Targets mentioned in the chart above.
Please LIKE, COMMENT and SHARE to motivate and support me. I'll keep on posting new ideas on Indices & Stocks. Be sure to follow so that you don't miss any good trades that might have been rewarding.
Any comments and critiques will be appreciated even if it's of opposite view as a trader can also be right so many times.

[SHORT-TERM] BUY CUMMINS INDIA ABOVE 940Cummins India looking good buy above 940.
To motivate me, Please like the idea If you agree with the analysis.
Happy Trading!
InvestPro India Team

Cummins India Ltd. Cummins India Ltd cmp 875.35 Stop Loss 820 Target 1090 positional, support on 200 ema and bulish hidden divergence

Cummins India is Taking support, wait till trend line breakoutBUY - 917
Stop Loss- 860
Target - 1032
Start trailing at 1:1 R:R

📊 #CumminsIndia on Support🎯NSE:CUMMINSIND
Cummins INDIA stock on support wait for conformation to long. One can trade it for swing trade.
******whatever charts or levels sharing here are just for educational purpose only, not a recommendation. Please do your own analysis before taking any trade on them. We are not SEBI registered.

Cummins India - 15 Min Chart AnalysisCUMMINS swing analysis
In above chart we have used1 5 min time frame.
Traders can go for swing trade for this one .
See the movement and Go long or Short after proper breakout and break down
Please put proper stop loss
*We are not SEBI registered
This is only for educational purpose.
Please consult your advisor before making any trade or investment

Simple Trade Setup |CUMMINS INDIA | 20-09-2021 [INTRADAY] NSE:CUMMINSIND
I am posting it, on request from one of the follower.
Observations:
1)On Weekly Time frame: We can see that now 1000 level is very very critical level.
And on the upper side it has a resistance Zone: 1045 to 1065.
And in coming days if it takes support from it and breakout 1045-1065 reistance range then it will start upmove again.
If it breaks down 1000 level then next support is as 975/980 and then 960.
960 is again a critical level which was acting as resistance in past many time. It has chance to reverse it from 960 level.
Please refer below chart : Weekly time frame.
2) On Daily Time Frame: It has broken 21DMA. Also it has came back in to the parallel channel. It might get support from middle trendline of parallel channel.
If not then it will go to the bottom trendline of parallel channel.
Please refer below chart : Daily time frame.
-------------------------------------
Trade Setup for Date 20-09-2021:
1) Don't Jump in to trade at the beginning of the market. Let it get settle for 15-20min first and judge the price action.
2) Everything is mentioned on the chart. I hope it is easy to understand.
3) All the levels will work as support, resistance, entry and exit w.r.t price action near that level.
Please refer below chart for levels.
Hope I made it easy to understand it.
Do comment your doubt or suggestion.
Note: Trade with Strict SL.

