BUY TODAY SELL TOMORROW for 5%DON’T HAVE TIME TO MANAGE YOUR TRADES?
- Take BTST trades at 3:25 pm every day
- Try to exit by taking 4-7% profit of each trade
- SL can also be maintained as closing below the low of the breakout candle
Now, why do I prefer BTST over swing trades? The primary reason is that I have observed that 90% of the stocks give most of the movement in just 1-2 days and the rest of the time they either consolidate or fall
Cup & Handle Breakout in INFOBEAN
BUY TODAY SELL TOMORROW for 5%
Cupandhandlebreakout

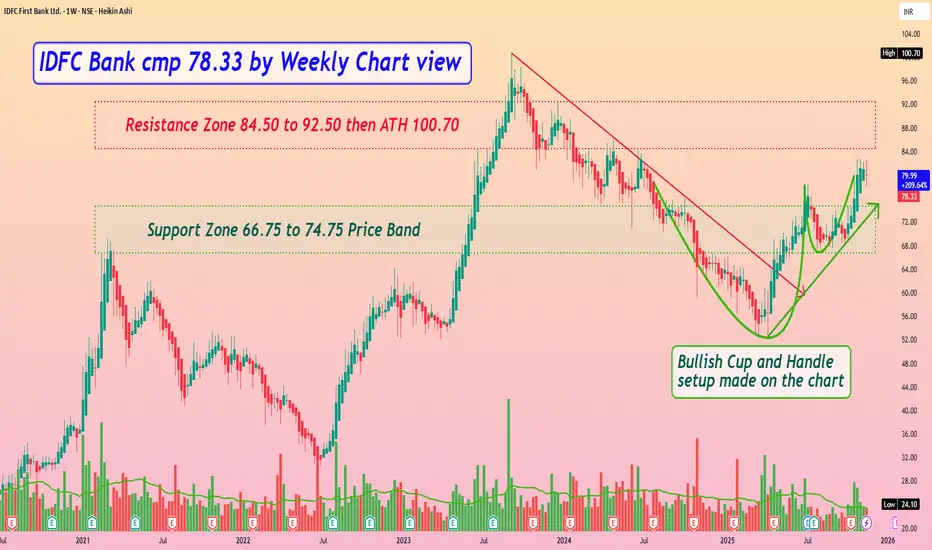
IDFC Bank cmp 78.33 by Weekly Chart viewIDFC Bank cmp 78.33 by Weekly Chart view
- Support Zone 66.75 to 74.75 Price Band
- Resistance Zone 84.50 to 92.50 then ATH 100.70
- Bullish Cup and Handle setup made on the stock chart
- Volumes are in good sync with the average traded quantity
- Rising Support Trendline well sustained and trending positively
- Resistance Zone Breakout by increased volumes to pave way for New ATH
BUY TODAY SELL TOMORROW for 5%DON’T HAVE TIME TO MANAGE YOUR TRADES?
- Take BTST trades at 3:25 pm every day
- Try to exit by taking 4-7% profit of each trade
- SL can also be maintained as closing below the low of the breakout candle
Now, why do I prefer BTST over swing trades? The primary reason is that I have observed that 90% of the stocks give most of the movement in just 1-2 days and the rest of the time they either consolidate or fall
Cup & Handle Breakout in SAIL
BUY TODAY SELL TOMORROW for 5%

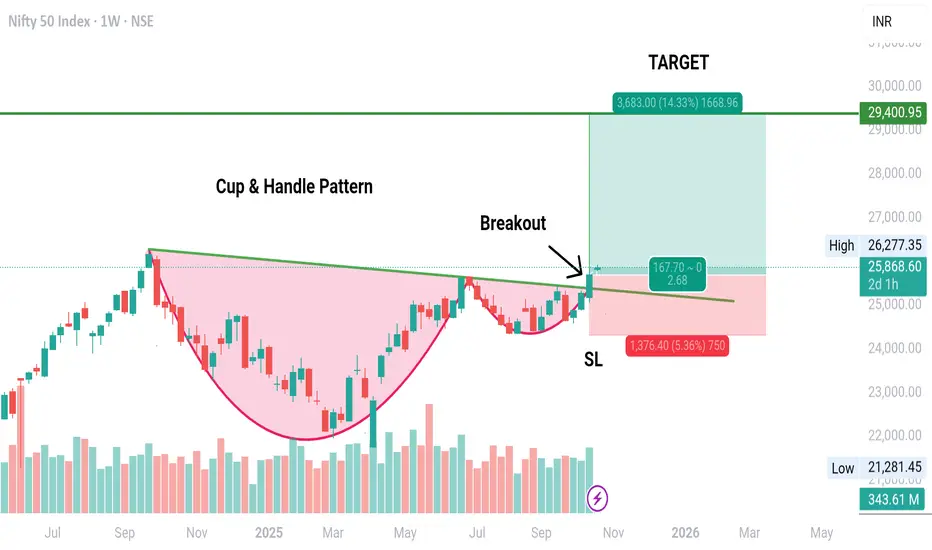
CUP & HANDLE Pattern Breakout in NIFTYA Breakout with good volume has happened in NIFTY 50 INDEX.
The breakout is has happened in weekly Time Frame 😱😱.
A Big target of 29400 is available to be achieved🎯
SL will be below the Handle's Low on sustaining Basis.
A better entry could be the one after retracement💡. As there are high chances of retracement from here as the price is very near to lifetime high.
One should always be cautious with the trade as the time is weekly. And, there can be many factors which can become hurdle like War, Tariff War, US economic bubble burst leading to crash etc etc.
However, entry target and SL are also mentioned in the chart.
Subscribe to my YouTube Channel for more details and more analysis.
Note: This analysis is for Educational Purpose Only. Please invest after consulting a professional financial advisor.
BUY TODAY SELL TOMORROW for 5%3 minutes ago
DON’T HAVE TIME TO MANAGE YOUR TRADES?
- Take BTST trades at 3:25 pm every day
- Try to exit by taking 4-7% profit of each trade
- SL can also be maintained as closing below the low of the breakout candle
Now, why do I prefer BTST over swing trades? The primary reason is that I have observed that 90% of the stocks give most of the movement in just 1-2 days and the rest of the time they either consolidate or fall
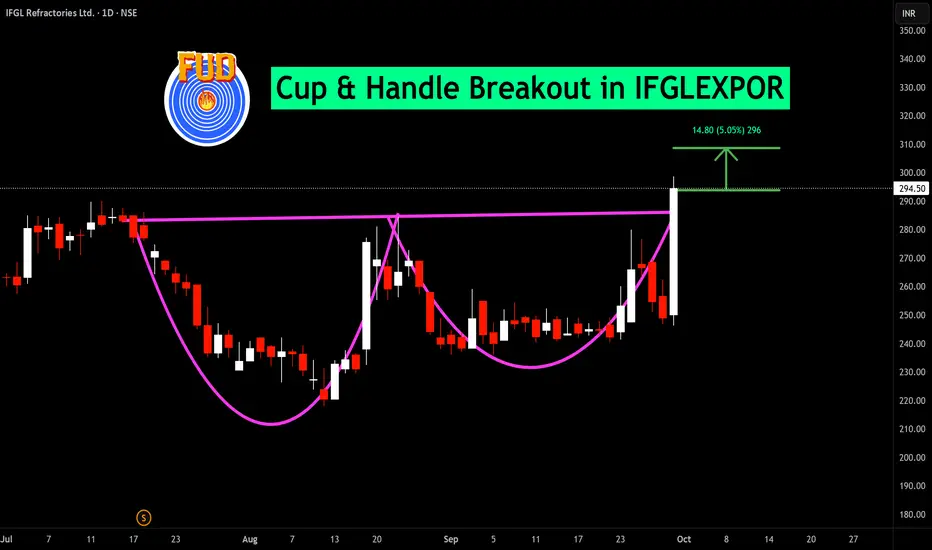
Cup & Handle Breakout in IFGLEXPOR
BUY TODAY SELL TOMORROW for 5%
BUY TODAY SELL TOMORROW for 5%DON’T HAVE TIME TO MANAGE YOUR TRADES?
- Take BTST trades at 3:25 pm every day
- Try to exit by taking 4-7% profit of each trade
- SL can also be maintained as closing below the low of the breakout candle
Now, why do I prefer BTST over swing trades? The primary reason is that I have observed that 90% of the stocks give most of the movement in just 1-2 days and the rest of the time they either consolidate or fall
Cup & Handle Breakout in TANLA
BUY TODAY SELL TOMORROW for 5%

Inverse Cup and Handle for Bearish indicationAfter strong Bullish Engulfing formation on 5th September 2025, the OANDA:NZDCAD price is rocketing towards higher highs, aiming for 0.8624 resistance.
Now it needs some breath after forming a bearish Harami on 12th September 2025.
Looking at the Hourly timeframe, it made an inversed Cup and Handle which indicates for bearish signal.
Yet we need another confirmation for breaking its lower high at 0.8229 which is our entry price
I am bearish from Monday onwards waiting for that cup's handle breakout. Once its done my orders must be triggered and left for bearish.
I will place a sell stop order 0.8229 with my SL at the handle of cup at 0.8256.
I will take two positions both at the breakout of Handle at 0.8229. Both position has 2% risk in total
Note: The Sell stop order is a must. If its not triggered then we are not aiming for any other trade.
Position 1 with 1 % Risk
Buy Stop: 0.8229
Stop Loss: 0.8256
TP: 0.8197
Position 1 with 1 % Risk
Buy Stop: 0.8229
Stop Loss: 0.8256
TP: 0.8160

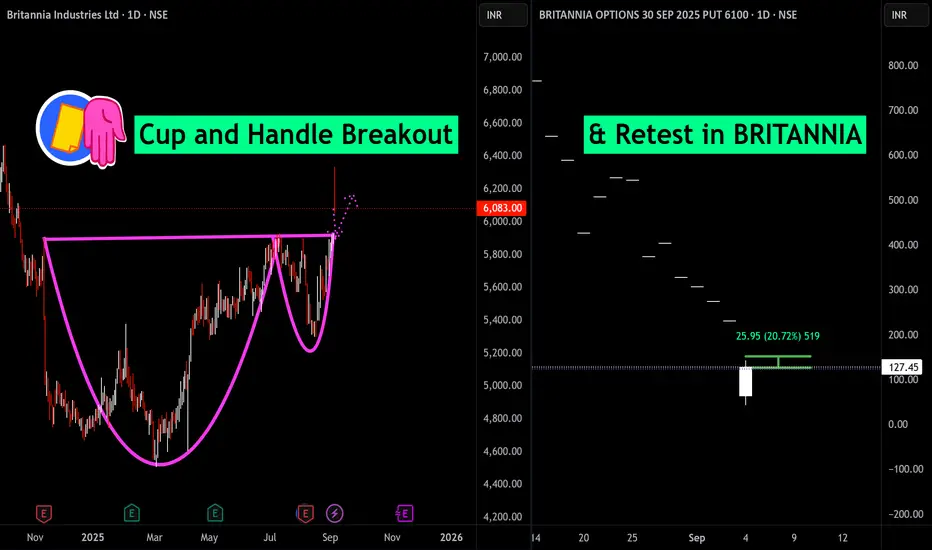
Cup and Handle Breakout & Retest in BRITANNIABritannia Industries has delivered a textbook Cup and Handle breakout on its daily chart, signaling renewed bullish momentum and the potential for higher highs ahead. After months of base-building, the stock surged above the key resistance level near ₹6,083, confirming the breakout with strong volume and a sharp price spike. This technical pattern often foreshadows continued upward movement, as buyers regain control following consolidation.
On the right, the Britannia 6100 September PUT option chart highlights a significant retest, with the PUT price dropping over 44% today, indicating strong bullish sentiment in the underlying stock. The sharp drop in the PUT’s value reinforces the breakout’s validity, since a falling PUT price typically aligns with rising equity prices.
Overall, Britannia’s decisive close above resistance and the synchronized retreat in bearish option premiums underscore an emerging uptrend. Traders may watch for continuation above ₹6,083 while managing risk near the breakout level.
BUY TODAY SELL TOMORROW for 5%DON’T HAVE TIME TO MANAGE YOUR TRADES?
- Take BTST trades at 3:25 pm every day
- Try to exit by taking 4-7% profit of each trade
- SL can also be maintained as closing below the low of the breakout candle
Now, why do I prefer BTST over swing trades? The primary reason is that I have observed that 90% of the stocks give most of the movement in just 1-2 days and the rest of the time they either consolidate or fall
Cup and Handle Breakout in JAICORPLTD
BUY TODAY SELL TOMORROW for 5%

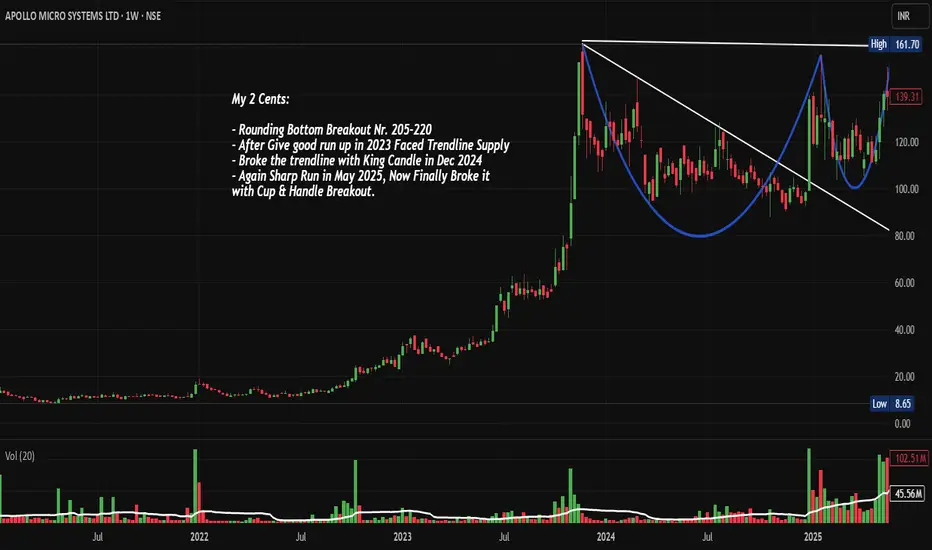
APOLLO: C&H and Rounding Bottom BO: Chart of the Week NSE:APOLLO : The Cup and Handle Breakout That Finally Delivered After Multiple False Starts with Rounding Bottom Breakout on Daily TF Let's Analyze it in the Chart of the Week.
As per the Latest SEBI Mandate, this isn't a Trading/Investment RECOMMENDATION nor for Educational Purposes; it is just for Informational purposes only. The chart data used is 3 Months old, as Showing Live Chart Data is not allowed according to the New SEBI Mandate.
Disclaimer: "I am not a SEBI REGISTERED RESEARCH ANALYST AND INVESTMENT ADVISER."
This analysis is intended solely for informational purposes and should not be interpreted as financial advice. It is advisable to consult a qualified financial advisor or conduct thorough research before making investment decisions.
Price Action:
• The chart reveals a sophisticated Cup and Handle pattern formation spanning from Late-2023 to August 2025, with the "cup" forming between 205-160 levels and the "handle" consolidating around the 180-200 zone
• Multiple breakout attempts were witnessed - first in December 2024 with a King Candle formation, followed by another sharp rally in May 2025, both failing to sustain above the descending trendline
• The current August 2025 breakout represents the third and most convincing attempt, breaking through both the descending resistance trendline and the horizontal resistance at 205-220 levels
• Volume surge during the current breakout (119.95M vs average 54.33M) confirms institutional participation and validates the breakout authenticity
• The curved line clearly marks the rounding bottom formation, indicating a gradual shift from bearish to bullish sentiment
Volume Spread Analysis:
Volume Pattern Insights:
• Exceptional volume breakout with nearly 2.2x average daily volume during the recent surge
• Volume accumulation visible during the cup formation, indicating smart money participation
• Low volume during handle formation, suggesting healthy consolidation
• Volume expansion coinciding with price breakout confirms institutional buying
Key Support and Resistance:
• Immediate Support Zones:
- Primary: 220-225 (previous resistance turned support)
- Secondary: 200-205 (handle formation base)
- Major: 180-185 (cup formation low)
• Critical Resistance Levels:
- Near-term: 250-260 (measured move target from cup depth)
- Intermediate: 280-290 (Fibonacci extension 1.618 level)
- Long-term: 320-340 (cup and handle pattern target)
• Base Formation: Strong accumulation base established between 160-220 over 18+ months
Multi-Pattern Technical Setup:
• Cup and Handle Pattern: Classic bullish continuation pattern with 18-month formation period
• Descending Triangle Breakout: Successfully breached the falling trendline resistance
• Rounding Bottom: Long-term reversal pattern indicating strong institutional accumulation
• Volume Breakout Pattern: Exceptional volume expansion confirming price breakout validity
Fundamental and Sectoral Backdrop:
Latest Financial Performance:
• Net profit surged 126% to Rs 19 crore in Q1 FY2026 compared to Rs 8 crore in Q1 FY2025
• Revenue growth of 46.5% to Rs 134 crore versus Rs 91 crore in the previous year, same quarter
• Quarterly growth basis shows a 32.21% jump in net profits since last quarter
• Market capitalization stands at approximately Rs 7,854 crores, reflecting strong market confidence
Strategic Business Positioning:
• Company is involved in more than 150 indigenous defence programs and 60 DcPP (Defence Capital Procurement Policy) programs as a sub-system partner
• Specializes in ruggedized electronic hardware and software solutions for critical sectors
• Strong focus on import substitution and Atmanirbhar Bharat initiatives
• Diversified client base including DRDO, HAL, BEL, and other major defence contractors
Sector Momentum Analysis:
• Apollo Micro Systems gained 14.6% on August 22, 2025, demonstrating resilience amid market fluctuations
• Stock has significantly outperformed the broader market year-to-date, reflecting strong performance in the Aerospace & Defence sector
• Defence budget allocation increases continue to provide sectoral tailwinds
• Growing focus on indigenous defence manufacturing creates long-term opportunities
Market Participation Analysis:
• High institutional interest is evident from volume patterns
• Retail participation is likely to increase given the breakout visibility
• Options activity expected to increase as the stock approaches higher price levels
• Potential inclusion in small-cap/midcap indices could trigger passive fund buying
Risk Assessment and Scenario Analysis:
Technical Risk Factors:
• Failed breakout history (December 2024 and May 2025) suggests caution is required
• High beta nature means increased volatility during market corrections
• Potential for profit booking at psychologically important 250 levels
• Need for sustained volume to validate the breakout authenticity
Fundamental Risk Considerations:
• Defence sector dependency on government policy changes and budget allocations
• Long procurement cycles are typical in defence contracts, affecting quarterly results
• Competition from established defence majors and emerging players
• Currency fluctuation impact on imported components and raw materials
Full Coverage on my Newsletter this Week
Keep in the Watchlist and DOYR.
NO RECO. For Buy/Sell.
📌Thank you for exploring my idea! I hope you found it valuable.
🙏FOLLOW for more
👍BOOST if you found it useful.
✍️COMMENT below with your views.
Meanwhile, check out my other stock ideas on the right side until this trade is activated. I would love your feedback.
As per the Latest SEBI Mandate, this isn't a Trading/Investment RECOMMENDATION nor for Educational Purposes, it is just for Informational purposes only. The chart data used is 3 Months old, as Showing Live Chart Data is not allowed according to the New SEBI Mandate.
Disclaimer: "I am not a SEBI REGISTERED RESEARCH ANALYST AND INVESTMENT ADVISER."
This analysis is intended solely for informational purposes and should not be interpreted as financial advice. It is advisable to consult a qualified financial advisor or conduct thorough research before making investment decisions.
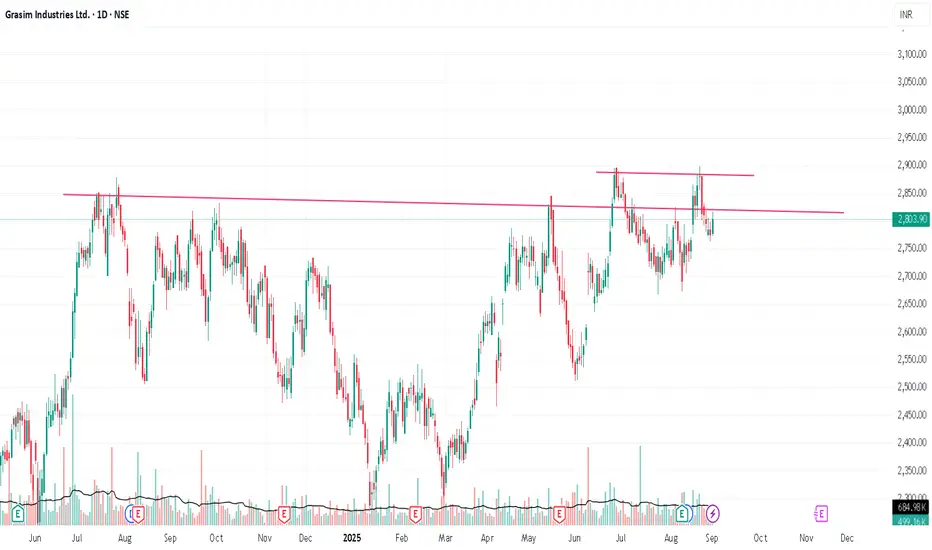
Flexing at All Time HighGrasim broke a cup & handle pattern and came down, again trying to break another trendline at top of the cup & handle pattern. if it breaks and sustain above the latest breakout with good volume, it'll move up for sure.
***This is only for educational purposes***
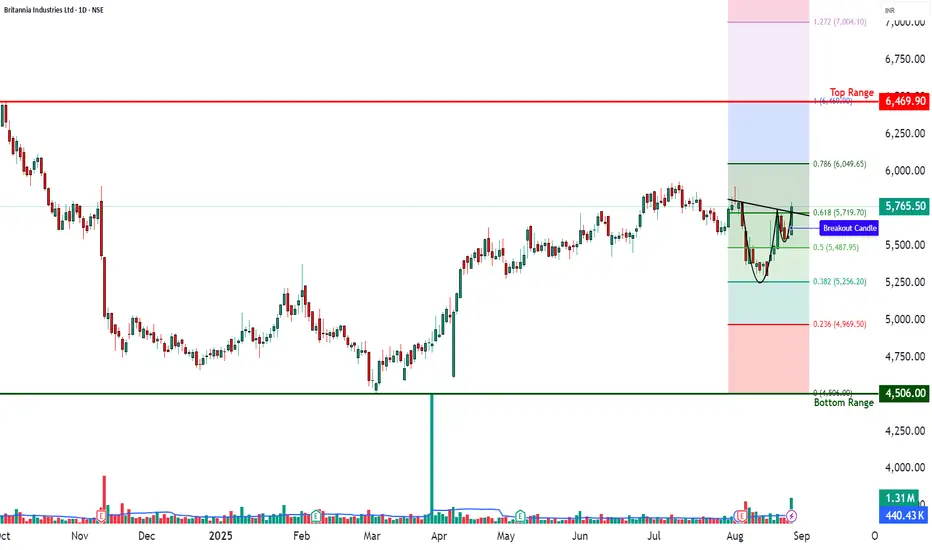
BRITANNIA - Cup & Handle Breakout Attempt📊 BRITANNIA – Technical & Fundamental Educational Snapshot
Ticker: NSE: BRITANNIA | Sector: FMCG – Packaged Foods & Biscuits
CMP: ₹5,765.50
Rating: ⭐⭐⭐⭐ (Bullish Setup – For Educational Purposes Only)
Pattern Observed: ☕📈 Cup & Handle Breakout Attempt
📊 Technical Observations
BRITANNIA (CMP: ₹5,765.5) is exhibiting a Cup & Handle breakout formation, confirmed by a strong bullish candle on heavy volumes. The stock has moved up from a recent bottom zone near ₹5,256–₹5,487 towards the neckline at ₹5,794, with key resistances placed at ₹5,848, ₹5,931, and ₹6,068, while supports are noted at ₹5,628, ₹5,491, and ₹5,408.
Technical indicators show RSI at 59 (breakout zone), a bullish MACD crossover, CCI at 76, and Stochastic at 94, highlighting strong upward momentum. The price action is supported by VWAP strength, and a Bollinger Band squeeze-off breakout, suggesting a possible trend continuation.
Volume surged to ~1.31M shares, significantly higher than the 20-day average of ~0.44M, indicating institutional participation. Based on the current momentum and technical structure, there is a strong possibility of breakout continuation; however, traders should carefully monitor the ₹5,628 and ₹5,518 levels as critical supports for risk management.
Britannia Industries has been in focus after analysts at PL Capital named it among their top stock picks, citing its strong positioning to benefit from India’s consumption revival. In its Q1 FY26 results, the company reported a consolidated net profit of ₹521 crore, up ~3% YoY, with revenues rising ~9% to ₹4,622 crore, though profitability fell short of street expectations due to higher input costs. Standalone performance was softer, with net profit down 0.8% YoY to ₹498 crore despite an 8.8% increase in revenue, reflecting margin pressure from raw material cost inflation. On the positive side, Britannia highlighted broad-based demand growth across both rural and urban markets and announced steps to boost the nutritional profile of its products by increasing whole grain content while reducing sugar and sodium, aligning with health-conscious consumer trends.
From a sentiment standpoint, the stock currently reflects a neutral to slightly positive bias. Bullish triggers include the ongoing consumption recovery, strong rural demand, analyst endorsements, product innovation, and sequential revenue growth. On the bearish side, rising input costs, weak standalone profitability, and rich valuations (P/E ~60) pose risks to near-term upside.
From an investment perspective, the outlook for Britannia remains mixed but constructive. On the bullish case, volume-led demand growth, health-focused innovation, and strong brand positioning could support further upside. On the bearish case, margin pressure and stretched valuations may limit near-term gains. In the short term (next few sessions), price action appears momentum-driven, supported by a bullish cup-and-handle breakout setup and strong institutional participation, making a continuation move possible in the next 1–2 days. Over the longer term (6–12 months), Britannia’s growth story remains intact provided cost pressures ease and the company sustains its demand momentum, aligning with PL Capital’s positive stance on the FMCG leader.
📊 STWP Trade Analysis – Under the STWP trade framework, one illustrative breakout scenario could involve a long entry near ₹5,794.50, with a protective stop at ₹5,518.40. In comparable past structures, price has tended to extend towards zones such as ₹5,848–₹5,880 (approx. 1:1 risk–reward), ₹5,931 (around 1:1.5 R:R), and ₹6,049–₹6,071 (approx. 1:2 R:R). If momentum accelerates, a stretch target may open towards ₹6,068 → ₹6,347.
An alternative, more conservative illustration could be a pullback entry in the ₹5,545–₹5,525 zone, with a tight invalidation stop at ₹5,518. A quick reaction pullback may also occur around the Fibonacci level of ₹5,719.70, before attempting a continuation higher. Upside zones remain aligned with the same resistance ladder (₹5,848–₹5,880 → ₹5,931 → ₹6,049–₹6,071 → ₹6,347).
Possible Demand Zone (Illustrative): ₹5,608.50 – ₹5,545
Stop Loss (tight): ₹5,537.90
Approximate Risk: ~₹70 per lot
⚠️ Risk Reminder:
Price momentum is strong but Stochastic readings are elevated, which may lead to volatility or shakeouts. Traders should trail stops actively (e.g., move SL to breakeven after T1, and under higher lows after T2). Market volatility, raw material cost changes, and broader FMCG index sentiment can influence outcomes. Past price behavior and backtests are illustrative only and do not guarantee future performance.
⚠️ Disclaimer – Please Read Carefully
The information shared here is meant purely for learning and awareness. It is not a buy or sell recommendation and should not be taken as investment advice. I am not a SEBI-registered investment advisor, and all views expressed are based on personal study, chart patterns, and publicly available market data.
Trading — whether in stocks or options — carries risk. Markets can move unexpectedly, and losses can sometimes exceed the money you have invested. Past performance or past setups do not guarantee future results.
If you are a beginner, treat this as a guide to understand how the market works — practice on paper trades before risking real money. If you are experienced, always assess your own risk, position sizing, and strategy suitability before entering trades.
Consult a SEBI-registered financial advisor before making any real trading decision. By engaging with this content, you acknowledge full responsibility for your trades and investments.
💬 Found this useful?
🔼 Give this post a Boost to help more traders discover clean, structured learning.
✍️ Drop your thoughts, questions, or setups in the comments — let’s grow together!
🔁 Share with fellow traders and beginners to spread awareness.
👉 “If you liked this breakdown, follow for more clean, structured setups with discipline at the core.”
🚀 Stay Calm. Stay Clean. Trade With Patience.
Trade Smart | Learn Zones | Be Self-Reliant 📊
HWC - LongThis is a weekly candlestick chart of Hancock Whitney Corporation (HWC) listed on NASDAQ. The chart is showing a Cup and Handle pattern, which is a bullish continuation pattern often seen before an upward breakout. Let’s break it down step by step:
🔎 Pattern Analysis
Cup Formation (Left Side to April 2025)
The chart formed a large round bottom (cup), which reflects a gradual decline followed by a steady recovery. This signals accumulation by smart money (big investors quietly buying at lower levels).
Handle Formation (June–August 2025)
After the cup, prices consolidated slightly downward and sideways, forming the handle.
This is the last stage before a breakout, essentially a "pause" before buyers take full control.
Breakout Zone (63 level): The neckline (or breakout level) is around $63. Price has just broken above this neckline, confirming the bullish pattern.
🎯 Price Target Projection
The height of the cup is around $18.43 (41.73%). Adding this to the breakout point ($63) gives a target of around $81. This is marked on the chart as the Target zone.
📉 Stop Loss (Risk Management)
The suggested Stop Loss (SL) is set at $56.94. If prices fall below this, the bullish setup would be invalid, so risk needs to be controlled.
🔔 Key Takeaways for Members
✅ A bullish Cup and Handle breakout is visible.
✅ Breakout confirmed above $63.
🎯 Upside Target: $81
📉 Stop Loss: $56.94
⏳ This is a weekly timeframe, so it may take weeks/months for the target to be achieved. Patience is key.
⚠️ Disclaimer: This explanation is only for educational purposes, not financial advice. Always do your own research and manage risk before making trading decisions.

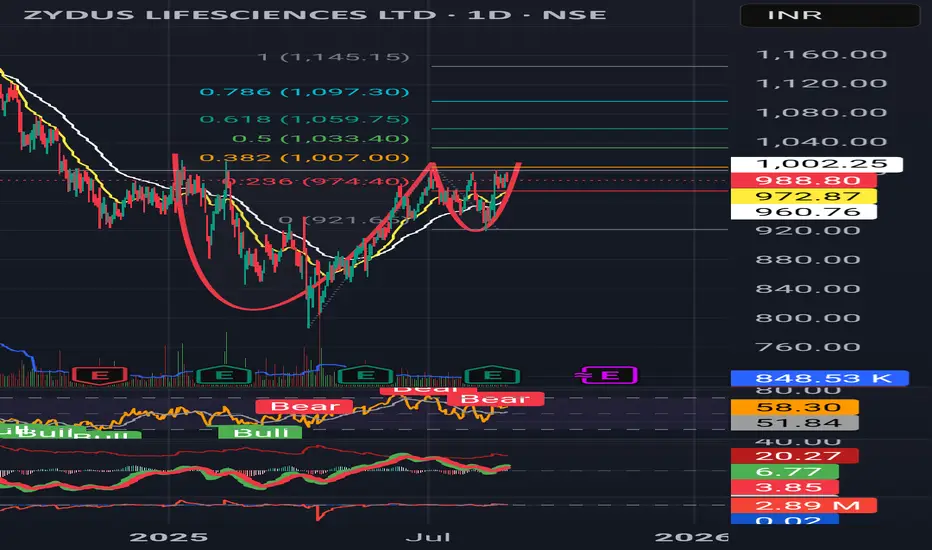
Zydus Lifesciences – Cup and Handle Breakout SetupThe stock has formed a classic Cup and Handle pattern, with a breakout zone around ₹1,010–1,020. A successful breakout above this level indicates bullish continuation, with a projected upside target of around ₹1,235.90 (21.5% potential).
The daily RSI (67.49) and weekly RSI (61.78) are both rising, signaling strong bullish momentum with room for further upside. The MACD also remains in positive territory, reinforcing the bullish trend.
A sustained breakout above ₹1,010–1,020 can be used as an entry point, with an upside target of ₹1,235, while maintaining a stop loss at ₹919 to manage risk below the handle low.
Disclaimer: The information provided in this analysis is for educational and informational purposes only and should not be considered as financial or investment advice.

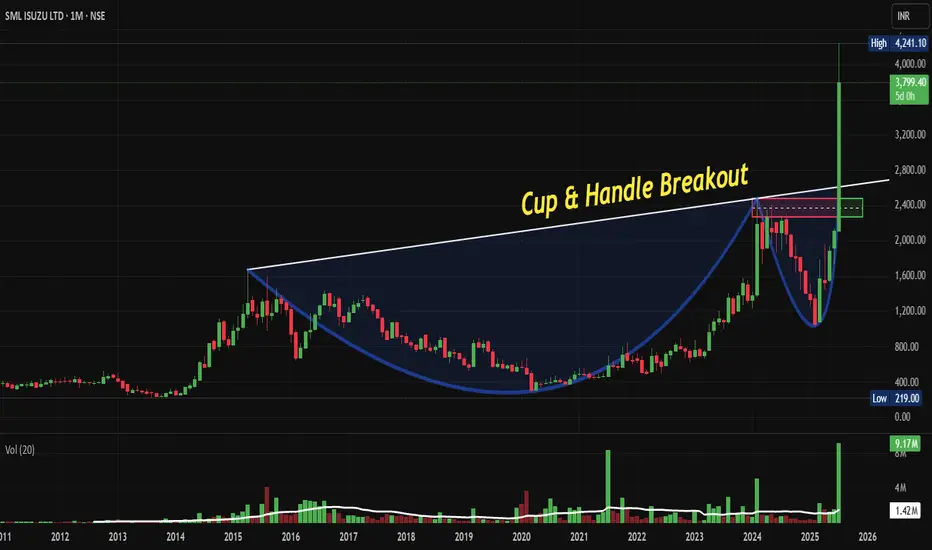
SMLISUZU: Explosive Cup and Handle Breakout, Chart of the Month From Years of Consolidation to Explosive Breakout: Why NSE:SMLISUZU Cup & Handle Pattern Could Deliver Multi-Bagger Returns. Let's Deep Dive into "Chart of the Month"
Price Action Analysis:
- Current trading price is approximately ₹3,799.40
- The stock has demonstrated a textbook Cup & Handle formation spanning over a decade (2015-2025)
- Post-breakout momentum shows strong bullish continuation with healthy volume expansion
- Recent breakout above the ₹2,400 breakout level indicates institutional accumulation
Volume Spread Analysis:
- Volume spike during the 2024-2025 breakout phase confirms genuine institutional interest
- Average daily volume has increased significantly from historical levels
- Volume pattern shows healthy distribution during consolidation phases and accumulation during breakouts
- Recent volume bars indicate sustained buying interest at higher levels
Key Technical Levels:
Base Formation:
- Primary base formed between 2020-2023 at ₹400-800 levels
- Secondary base consolidation occurred in 2023-2024 around ₹1,200-1,600 range
- The decade-long cup formation created a strong foundation for the current uptrend
Support Levels:
- Immediate support: ₹3,200-3,400 (recent consolidation zone)
- Strong support: ₹2,400-2,600 (cup breakout level)
- Critical support: ₹1,800-2,000 (previous resistance turned support)
- Long-term support: ₹1,200-1,400 (base formation)
Resistance Levels:
- Immediate resistance: ₹4,200-4,400 (psychological round number)
- Next resistance: ₹4,800-5,000 (projected target based on cup depth)
- Long-term target: ₹6,000+ (measured move from cup formation)
Technical Pattern:
Cup & Handle Pattern
- Formation period: 2015-2025 (10-year formation)
- Cup depth: Approximately ₹1,800 (from ₹2,400 high to ₹600 low)
- Handle formation: 2024-2025 consolidation
- Breakout confirmation: Volume expansion above ₹2,400
Moving Average Alignment:
- Price trading above all major moving averages
- Strong uptrend with moving averages in bullish sequence
- No signs of trend reversal in the immediate term
Trade Setup:
Entry Levels:
- Aggressive entry: ₹3,600-3,700 (current market price on minor dips)
- Conservative entry: ₹3,200-3,400 (on pullback to support)
- Accumulation zone: ₹2,800-3,200 (for long-term positions)
Exit Levels:
- Target 1: ₹4,500-4,700 (25-30% upside)
- Target 2: ₹5,500-5,800 (50-60% upside)
- Target 3: ₹6,500+ (multi-bagger potential)
Stop-Loss Strategy:
- For aggressive entries: ₹3,100 (8-10% risk)
- For conservative entries: ₹2,800 (12-15% risk)
- Trailing stop: Use a 20% trailing stop once the position moves 30% in favour
Position Sizing & Risk Management:
Position Sizing Guidelines
- Conservative investors: 2-3% of portfolio
- Moderate risk investors: 3-5% of portfolio
- Aggressive investors: 5-8% of portfolio (maximum recommended)
Risk Management Framework
- Never risk more than 2% of the total portfolio on a single trade
- Use position sizing formula: (Portfolio Risk ÷ Trade Risk) × 100
- Implement pyramid buying on pullbacks to support levels
- Book partial profits at each target level (33% at each target)
Portfolio Allocation Strategy:
- Core holding: 60% of position for long-term (2-3 years)
- Trading position: 40% for swing trades and profit booking
- Rebalance quarterly based on technical developments
Sectoral & Fundamental Backdrop:
Commercial Vehicle Sector Overview:
- The Commercial Vehicles market in India is projected to grow by 2.13% (2025-2030), resulting in a market volume of 1,165.00k vehicles in 2030
- India's commercial vehicle industry is gearing up for a modest recovery, with ICRA forecasting a 3-5 per cent year-on-year growth in wholesale volumes for FY26
- The India Commercial Vehicles Market size is estimated at 51.09 billion USD in 2025, and is expected to reach 62.95 billion USD by 2029, growing at a CAGR of 5.36%
Industry Dynamics:
- Infrastructure development is driving demand for commercial vehicles
- The government's focus on road construction and the logistics sector
- The e-commerce boom is increasing last-mile delivery vehicle demand
- Replacement demand cycle supporting steady growth
Company Fundamentals:
- Net profit of SML ISUZU rose 44.34% to Rs 67 crore in the quarter ended June 2025 as against Rs 46 crore during the previous quarter ended June 2024. Sales rose 13.39% to Rs 846 crore in the quarter ended June 2025
- Market Cap: 5,498 Crore (up 84.8% in 1 year), Revenue: 2,498 Cr, Profit: 142 Cr, Promoter Holding: 43.96%
Business Model Strengths:
- NSE:SMLISUZU Limited manufactures and sells commercial vehicles and related parts in India and internationally. Its products include trucks and buses
- Strong partnership with Isuzu Motors for technology and product development
- Focus on fuel-efficient and reliable commercial vehicles
- Growing aftermarket services contributing to recurring revenue
Financial Health Indicators:
- Consistent revenue growth over recent quarters
- Improving profit margins, indicating operational efficiency
- Stable promoter holding, suggesting management confidence
- Strong balance sheet supporting growth investments
Risk Assessment:
Technical Risks:
- Failure to hold ₹3,200 support could trigger correction to ₹2,800
- High volatility expected due to recent sharp price appreciation
- Potential profit booking pressure at psychological levels
Fundamental Risks:
- Cyclical nature of the commercial vehicle industry
- Dependency on economic growth and infrastructure spending
- Competition from established players like Tata Motors
- Raw material cost fluctuations impacting margins
Market Risks:
- Overall market correction could impact individual stock performance
- Interest rate changes affecting vehicle financing demand
- Regulatory changes in emission norms requiring investment
My Take:
NSE:SMLISUZU presents a compelling technical setup with the successful breakout from a decade-long Cup & Handle pattern. The combination of strong fundamentals, improving sector dynamics, and bullish technical indicators suggests potential for significant upside. However, investors should implement proper risk management given the stock's recent appreciation and inherent sector volatility.
The stock appears well-positioned to benefit from India's infrastructure growth story and the recovery of the commercial vehicle sector. Technical indicators support a bullish outlook with multiple price targets achievable over the next 12-18 months.
Keep in the Watchlist and DOYR.
NO RECO. For Buy/Sell.
📌Thank you for exploring my idea! I hope you found it valuable.
🙏FOLLOW for more
👍BOOST if you found it useful.
✍️COMMENT below with your views.
Meanwhile, check out my other stock ideas on the right side until this trade is activated. I would love your feedback.
Disclaimer: "I am not a SEBI REGISTERED RESEARCH ANALYST AND INVESTMENT ADVISER."
This analysis is intended solely for informational and educational purposes and should not be interpreted as financial advice. It is advisable to consult a qualified financial advisor or conduct thorough research before making investment decisions.
Zydus is ready to breakout from cup and handle pattern Zydus Lifesciences
✅ Cup & Handle shaping up on weekly.
✅ Price consolidating just under resistance at ₹1005.
🚩 Needs strong breakout candle with volume.
🎯 Target zones: ~₹1060
, ₹1097, ₹1145.
🛑 Stop-loss: ₹984.
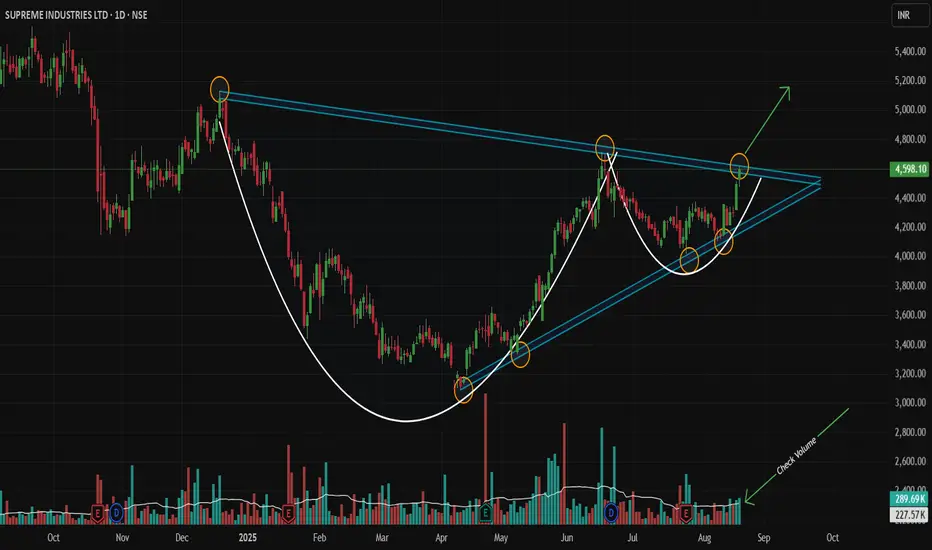
Nested Bullish Patterns Signal Major Breakout!Script: NSE:SUPREMEIND | Timeframe: Daily | Analysis Type: Technical (Pure Price Action) | Patterns: Symmetrical Triangle + Cup & Handle
Idea Summary 💡
A powerful, nested pattern setup is concluding on the daily chart! A large Symmetrical Triangle contains a secondary Cup and Handle (Bullish) pattern. This rare confluence signals strong accumulation and suggests an imminent, powerful upside breakout is likely!
Chart Pattern Logic 🔍
Primary Pattern (Symmetrical Triangle): Characterized by descending resistance (highs: Dec-18-2024, Jun-17-2025) and ascending support (lows: Apr-9-2025, May-9-2025, Jul-24-2025).
Secondary Pattern (Cup & Handle): Formed entirely within the triangle, adding a potent layer of bullish confirmation.
Confluence: This pattern-within-a-pattern setup significantly amplifies the potential for a strong upward resolution.
Trade Thesis 📈
Price is coiling at the triangle's apex under immense pressure. A decisive break above the upper trendline could ignite the next major bullish impulse phase.
Trade Setup ⚡
Direction: LONG 🟢
Entry Trigger: WAIT for a strong Marubozu green candle 🕯️ to close above the triangle's trendline on high volume (min. 1.5x average).
Stop Loss: Below the low of the breakout candle. 🛑
Profit Targets: 4700 🎯 | 4800 🎯 | 5125 🎯
Long-Term Target: 6000+ (Extended Target Based on Pattern Confluence & Momentum) 🚀
Risk Management: Trail stops aggressively after Target 1.
Got another stock you want me to break down? 📊
Drop the ticker in the comments below! If you found this idea useful, like and follow for more pure price action analysis.
Disclaimer: This post/information is solely for educational purposes and should not be construed as a recommendation or financial advice. Trading carries a risk of loss. Please conduct your own research or consult a financial advisor before making any investment decisions. The author and TradingView are not liable for any financial losses incurred based on this content.
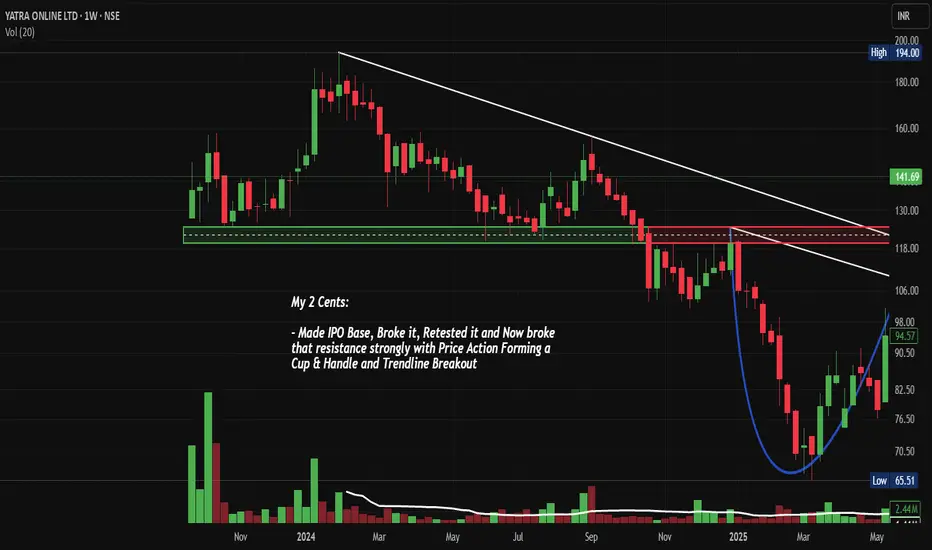
YATRA: Spectacular Recovery, Chart of the Week Post Q1 FY26From IPO Disaster to Cup & Handle Breakout: NSE:YATRA Spectacular Recovery Rally May Just Be Getting Started post Strong Q1 FY26 Numbers
As per the Latest SEBI Mandate, this isn't a Trading/Investment RECOMMENDATION nor for Educational Purposes; it is just for Informational purposes only. The chart data used is 3 Months old, as Showing Live Chart Data is not allowed according to the New SEBI Mandate.
Disclaimer: "I am not a SEBI REGISTERED RESEARCH ANALYST AND INVESTMENT ADVISER."
This analysis is intended solely for informational purposes and should not be interpreted as financial advice. It is advisable to consult a qualified financial advisor or conduct thorough research before making investment decisions.
Price Action Analysis:
Chart Pattern Identification:
- Primary Pattern: Cup & Handle Formation (Bullish Reversal Pattern)
- Cup formation period: March 2024 to May 2025
- Handle formation: May 2025 to July 2025
- Breakout confirmation: August 2025 with strong volume spike
Key Price Levels:
- IPO Base Level: ₹125-130 (Initial listing range)
- All-Time High: ₹194.00 (Early 2024 peak)
- Major Support Levels:
- ₹118 (Cup base/IPO resistance turned support)
- ₹106 (Handle low)
- ₹90-95 (Previous resistance cluster)
- Major Resistance Levels:
- ₹160 (Next logical resistance)
- ₹180-185 (Pre-ATH resistance zone)
- ₹194 (All-time high)
Trend Analysis:
- Long-term Trend: Bullish reversal after prolonged downtrend
- Medium-term Trend: Strong bullish momentum post-breakout
- Short-term Trend: Consolidating after breakout with bullish bias
Volume Spread Analysis:
Volume Characteristics:
- Breakout Volume: Exceptional surge to 134.47M (significantly above average)
- Volume Confirmation: Strong institutional participation is evident
- Historical Volume Pattern: Low volume during handle formation followed by breakout explosion
Volume Spread:
- Volume surge indicates genuine breakout with institutional backing
- Previous accumulation phase visible during cup formation
- Current volume levels suggest sustained interest
Key Support & Resistance:
Dynamic Support Levels:
- Immediate Support: ₹125-130 (Breakout level/IPO base)
- Secondary Support: ₹118 (Cup rim level)
- Critical Support: ₹106 (Handle low - stop loss reference)
Resistance Levels:
- First: ₹160 (38.2% retracement from ATH)
- Second: ₹180-185 (Pre-ATH consolidation zone)
- Ultimate: ₹220-240 (Cup & Handle measured move)
Technical Indicators & Patterns:
Classical Patterns:
- Cup & Handle: Completed with successful breakout
- Rounding Bottom: Visible in the cup formation
- Ascending Triangle: Formed during handle consolidation
Key Technical Observations:
- Price action shows strong momentum post-breakout
- Previous IPO resistance at ₹125-130 now acting as support
- Breakout occurred with a gap-up opening, indicating strong sentiment
Sectoral Backdrop:
Online Travel Industry Overview:
- India Online Travel Market expected to reach USD 23.10 billion in 2025 and grow at a CAGR of 7.76% to reach USD 33.90 billion by 2030
- Online travel booking service market in India expected to reach projected revenue of US$57,924.4 million by 2030 with a CAGR of 10.6%
- India's travel industry is valued at $178 billion, fueling economic growth with travel stocks offering lucrative investment opportunities
Market Position:
- Yatra Online Ltd. was identified as one of the major companies operating alongside MakeMyTrip, EaseMyTrip, and Cleartrip
- Strong competitive position in a growing market
- Recovery phase post-pandemic showing robust growth trajectory
Fundamental Backdrop:
Financial Metrics:
- Market Cap: 2,223 Crore, Revenue: 900 Cr, Profit: 49 Cr (TTM)
- Promoter Holding: 64.46% (Strong management commitment)
- Trading at 2.84 times book value at 45.8 times P/E
Operational Assessment:
- The company has a low return on equity of 2.90% over the last 3 years
- Profitability achieved, indicating operational efficiency improvement
- Revenue growth trajectory supported by sector tailwinds
Growth Lever:
- Beneficiary of India's domestic tourism boom
- Digital transformation in travel booking
- Post-pandemic recovery in the travel sector
- The government's focus on tourism development
Market Outlook & Catalysts:
Positive Catalysts:
- Travel & Tourism market in India projected to grow by 8.07% (2025-2029)
- Increasing domestic travel penetration
- Corporate travel recovery
- Digital adoption acceleration
Key Risk Factors:
- Intense competition from larger players
- Seasonal business variations
- Economic slowdown impact on discretionary spending
- Regulatory changes in the travel sector
Key Monitoring Points:
- Sustained holding above the ₹125 breakout level
- Volume sustainability in the coming sessions
- Broader market conditions and sector rotation
- Company's Next Few quarterly results and guidance updates.
Full Coverage on my Newsletter this Week
Keep in the Watchlist and DOYR.
NO RECO. For Buy/Sell.
📌Thank you for exploring my idea! I hope you found it valuable.
🙏FOLLOW for more
👍BOOST if you found it useful.
✍️COMMENT below with your views.
Meanwhile, check out my other stock ideas on the right side until this trade is activated. I would love your feedback.
As per the Latest SEBI Mandate, this isn't a Trading/Investment RECOMMENDATION nor for Educational Purposes, it is just for Informational purposes only. The chart data used is 3 Months old, as Showing Live Chart Data is not allowed according to the New SEBI Mandate.
Disclaimer: "I am not a SEBI REGISTERED RESEARCH ANALYST AND INVESTMENT ADVISER."
This analysis is intended solely for informational purposes and should not be interpreted as financial advice. It is advisable to consult a qualified financial advisor or conduct thorough research before making investment decisions.
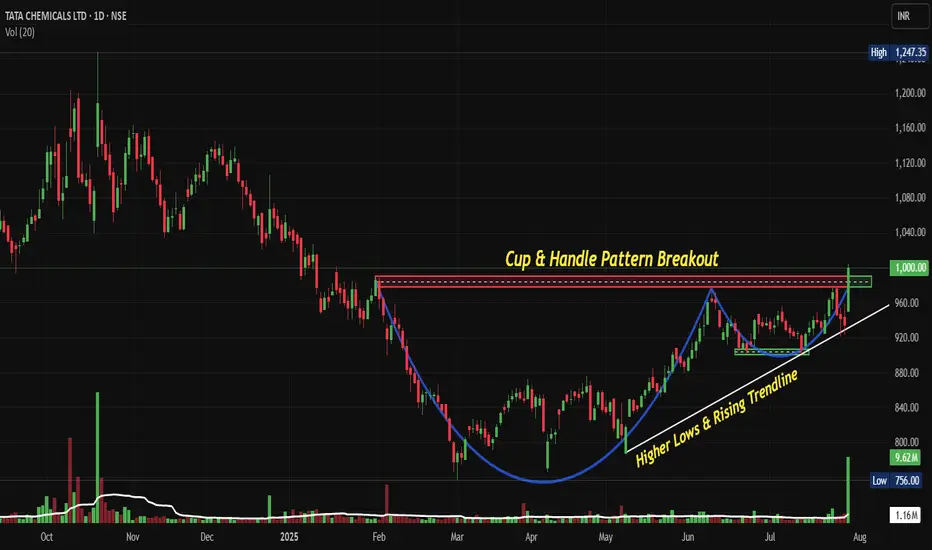
TATACHEM: Breaks out of Cup & Handle Breakout Post Q1 FY 26NSE:TATACHEM Breaks Out: The Cup and Handle Formation That Could Signal New Highs Post Good Q1 FY 26 with Margin Expansion.
Price Action:
Trend Structure
• Long-term uptrend intact with a higher lows pattern since March 2025
• Strong momentum breakout above key resistance at 1,000 levels
• Price action showing bullish continuation after brief consolidation
• Current trading above all major moving averages (20, 50, 200 EMA)
Breakout Characteristics
• Clean breakout above resistance
• Volume expansion confirming institutional participation
• No immediate rejection at breakout level, suggesting strength
• Momentum favouring further upside continuation
Volume Spread Analysis:
Volume Pattern:
• Significant volume spike during the breakout phase in July 2025
• Volume contraction during handle formation (typical healthy pattern)
• Above-average volumes during cup formation, indicating accumulation
• Recent volume expansion suggests institutional buying interest
Volume Confirmation:
• Breakout supported by 2-3x average daily volume
• Previous resistance turning into support with volume backing
• Accumulation-distribution pattern favourable for continued upside
Chart Pattern:
• The chart displays a classic Cup and Handle pattern formation spanning from Jan 2025 to July 2025
• The "Cup" formation shows a rounded bottom with the low around 750-780 levels during March 2025
• The "Handle" represents the consolidation phase between June-July 2025, around 920-960 levels
• Clear breakout above the 1,000 resistance level with strong volume confirmation
Key Technical Levels
• Primary Support: 920-950 (handle low and recent consolidation)
• Secondary Support: 850-880 (mid-cup level)
• Major Support: 750-780 (cup bottom)
• Immediate Resistance: 1,050-1,080 (psychological levels)
• Target Resistance: 1,200-1,250 (measured move from cup depth)
Trade Setup and Strategy:
Entry Levels:
• Aggressive Entry: 1,000-1,020 (on breakout confirmation)
• Conservative Entry: 950-980 (on pullback to handle support)
• Scale-in Entry: 920-950 (major support retest)
Exit Levels:
• Target 1: 1,100-1,120 (initial resistance cluster)
• Target 2: 1,200-1,250 (measured move target)
• Target 3: 1,300-1,350 (extension target based on cup depth)
Stop-Loss Strategy:
• Initial Stop-Loss: 920 (below handle low)
• Trailing Stop: 950 after Target 1 achievement
• Risk-Reward Ratio: 1:3 to 1:4 on conservative entry
Position Sizing and Risk Management:
Position Sizing:
• Allocate 2-3% of portfolio for this trade
• Calculate position size based on stop-loss distance
• Consider scaling in approach for better average entry
Risk Management:
• Maximum risk per trade: 1-2% of total capital
• Use position sizing formula: Risk Amount ÷ (Entry - Stop Loss)
• Maintain diversification across sectors and market caps
Risk Factors:
• Broader market correction could impact individual stock performance
• Sector-specific headwinds in the chemicals industry
• Global economic slowdown affecting demand
Fundamental and Sectoral Backdrop:
Recent Financial Performance:
• Q1 FY26 results showed consolidated revenue of ₹3,719 Cr with EBITDA of ₹649 Cr and PAT of ₹316 Cr
• Standalone revenue at ₹1,169 Cr, up 11.65% compared to Q1FY25, with PAT of ₹307 Cr, up 20%
• Stock gained 16.66% over the last three months
• Strong operational performance supporting technical breakout
Sectoral Outlook:
• The Chemicals market in India is projected to grow by 3.46% (2025-2029), resulting in a market volume of US$35.4bn in 2029
• India's speciality chemicals market is expected to increase at a CAGR of 12% to US$64 billion by 2025
• The chemical industry, currently valued at around US$250 billion, aims to grow to US$300 billion by 2025
• The sector is projected to grow by 11 to 12 per cent during 2021–27, tripling its global market share by 2040
Investment Thesis:
• Strong sectoral tailwinds supporting long-term growth
• Company's positioning in the speciality chemicals segment
• Potential beneficiary of India's manufacturing growth story
• Technical breakout aligning with fundamental strength
Key Monitoring Points:
Technical Triggers:
• Sustain above 1,000 levels for breakout confirmation
• Volume patterns on any pullbacks
• Price action at target levels for profit booking decisions
Fundamental Catalysts:
• Quarterly earnings performance and guidance
• New project announcements or capacity expansions
• Sectoral policy developments and government initiatives
• Global chemical prices and demand trends
Risk Monitoring:
• A break below 920 levels would invalidate the bullish setup
• Broader market sentiment and global risk-off scenarios
• Sector rotation away from chemicals and industrials
• Company-specific news flow and management commentary
My Take:
The combination of technical breakout, strong fundamentals, and positive sector outlook makes NSE:TATACHEM an attractive investment proposition at current levels, with the cup and handle pattern suggesting potential for significant upside over the next 6-12 months.
Keep in the Watchlist and DOYR.
NO RECO. For Buy/Sell.
📌Thank you for exploring my idea! I hope you found it valuable.
🙏FOLLOW for more
👍BOOST if you found it useful.
✍️COMMENT below with your views.
Meanwhile, check out my other stock ideas on the right side until this trade is activated. I would love your feedback.
Disclaimer: "I am not a SEBI REGISTERED RESEARCH ANALYST AND INVESTMENT ADVISER."
This analysis is intended solely for informational and educational purposes and should not be interpreted as financial advice. It is advisable to consult a qualified financial advisor or conduct thorough research before making investment decisions.
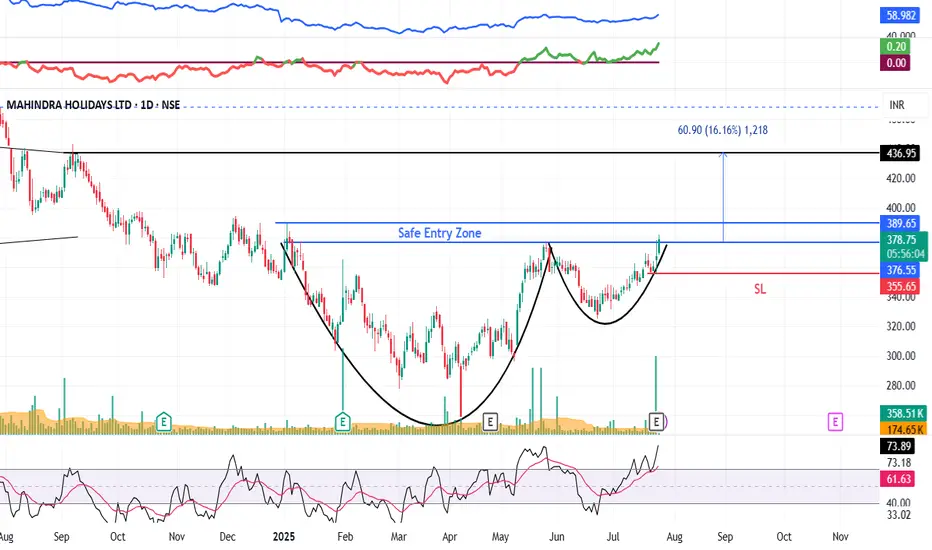
MHRIL : Swing Trade#MHRIL #patterntrading #chartpattern #cupandhandlepattern #swingtrading #trendingstock
MHRIL : Swing Trade
>> cup & Handle chart pattern
>> Breakout soon
>> Trending Setup
>> Stock in Momentum
>> Good Strength & Volumes
Swing Traders can lock profit at 10% & keep trailing
Pls boost, comment & Follow for more Learnings
Disc : Charts shared are for Learning purpose and not a Trade recommendation. Consult your financial advisor or a SEBI Registered Advisor before taking position in it.
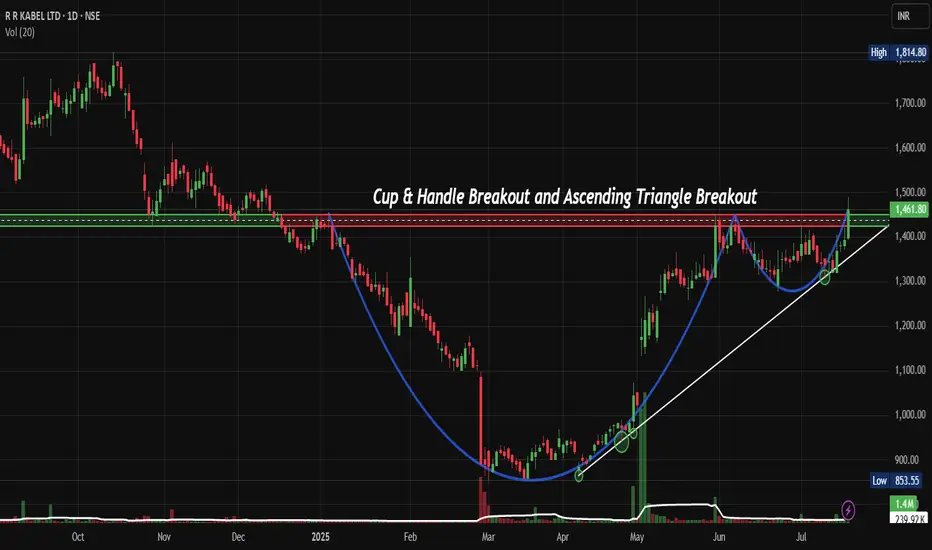
RRKABEL: Cup & Handle Pattern Could Trigger 30% Upside RallyNSE:RRKABEL Perfect Storm: How Cup & Handle Pattern Could Trigger 30% Upside Rally
Price Action Analysis:
Candlestick Patterns:
- Doji Formation: Multiple doji candles during handle formation indicate indecision and potential reversal
- Bullish Engulfing: Strong bullish engulfing pattern on breakout day, showing buying pressure
- Higher Highs/Lows: Clear pattern of higher highs and higher lows post-breakout
- Rejection Candles: Long lower wicks during handle formation show buying support
Price Structure:
- Swing: Clear swing low at ₹853 (March 2025) and swing high at ₹1,850 (previous year)
- Impulse Waves: Strong impulsive moves during the breakout phase indicate institutional participation
- Corrective Waves: Orderly corrective structure during cup and handle formation
- Price Momentum: Accelerating price momentum post-breakout with minimal pullbacks
Market Structure:
- Trend: Transition from downtrend to sideways consolidation to uptrend
- Support Respect: Multiple tests of support levels without breakdown showing strength
- Resistance Breaks: Clean break above multiple resistance levels with conviction
- Price Velocity: Increasing price velocity on breakout indicates strong momentum
Intraday Price Action:
- Opening Gaps: Positive opening gaps during the breakout phase show overnight interest
- Closing Strength: Consistent closing in the upper portion of the daily range
- Pullback Behaviour: Shallow pullbacks with quick recoveries indicate a strong underlying bid
- Volume-Price Sync: Price advances accompanied by volume expansion
Volume Spread Analysis:
Volume Patterns:
- Base Formation: Declining volume during cup formation indicates a lack of selling pressure
- Handle Volume: Minimal volume during handle formation, showing controlled supply
- Breakout Volume: Significant volume spike on breakout confirming institutional participation
- Volume Trend: Above-average volume sustaining post-breakout
Volume Indicators:
- Accumulation Phase: Volume patterns suggest institutional accumulation during the base
- Breakout Confirmation: 2-3x average volume on breakout day
- Follow-through: Consistent volume support in subsequent sessions
- Volume Price Analysis: Positive volume-price correlation during upward movement
Technical Patterns:
Primary Pattern: Cup & Handle Formation
- Cup Formation: The stock formed a classical cup pattern from Jan 2025 to March 2025, with the left rim at approximately ₹1,420 levels
- Handle Formation: A clean handle pattern developed from May to July 2025, showing controlled consolidation with diminishing volume
- Breakout Confirmation: Strong breakout above ₹1,420 resistance with increased volume, signalling pattern completion
- Pattern Reliability: The 6-month cup formation provides a strong technical foundation for sustained upward momentum
Secondary Pattern: Ascending Triangle
- Formation Period: June to July 2025 within the handle structure
- Resistance Level: Horizontal resistance at ₹1,420 tested multiple times
- Support Trend: Rising support line indicating accumulation phase
- Breakout: Clean breakout above triangle resistance with volume expansion
Support & Resistance Levels:
Key Support Levels:
- Immediate Support: ₹1,350 (breakout pullback level)
- Secondary Support: ₹1,280 (handle low)
- Major Support: ₹1,200 (psychological level and previous resistance)
- Critical Support: ₹1,080 (cup base level)
Key Resistance Levels:
- Immediate Resistance: ₹1,500 (psychological level)
- Target Resistance: ₹1,650 (cup depth projection)
- Extended Target: ₹1,800 (previous swing high)
- Long-term Resistance: ₹1,850 (52-week high)
Base Analysis:
Base Characteristics:
- Base Type: Cup with handle base formation
- Duration: 7 months (Jan 2025 to July 2025)
- Depth: Approximately 35% correction from highs
- Volume Pattern: Declining volume during base formation, expanding on breakout
- Base Quality: High-quality base with proper structure and time frame
Base Strength Indicators:
- Volatility Contraction: Price volatility decreased during handle formation
- Volume Dry-up: Minimal selling pressure during consolidation
- Support Holding: Multiple tests of support levels without breakdown
- Institutional Activity: Likely accumulation phase based on volume patterns
Trade Setup:
Entry Strategy:
- Primary Entry: ₹1,420-1,430 (on breakout confirmation)
- Secondary Entry: ₹1,380-1,400 (on pullback to breakout level)
- Aggressive Entry: ₹1,350-1,360 (deeper pullback support)
Entry Confirmation Signals:
- Volume Expansion: Minimum 1.5x average volume on entry
- Price Action: Close above ₹1,420 for two consecutive sessions
- Momentum: RSI above 50 and trending upward
- Moving Averages: Price above 20 and 50-day moving averages
Exit Levels:
Profit Targets:
- Target 1: ₹1,500 (5.5% upside) - Psychological resistance
- Target 2: ₹1,650 (16% upside) - Cup depth projection
- Target 3: ₹1,800 (27% upside) - Previous swing high
- Extended Target: ₹1,850 (30% upside) - 52-week high
Exit Strategy:
- Partial Profit: Book 25% at Target 1
- Scale Out: 50% at Target 2
- Trailing Stop: Implement 8-10% trailing stop after Target 2
- Final Exit: Complete exit at Target 3 or on stop-loss trigger
Stop-Loss Strategy:
Stop-Loss Levels:
- Conservative: ₹1,320 (7% below entry)
- Moderate: ₹1,280 (10% below entry)
- Aggressive: ₹1,250 (12% below entry)
Stop-Loss Management:
- Initial Stop: Below handle low at ₹1,280
- Trailing Stop: Move to breakeven after 5% profit
- Progressive Stops: Raise stops with each target achievement
- Time Stop: Exit if no progress within 4-6 weeks
Position Sizing:
Risk-Based Sizing:
- Conservative Approach: 1-2% of portfolio risk
- Moderate Approach: 2-3% of portfolio risk
- Aggressive Approach: 3-5% of portfolio risk
Position Calculation:
- Risk Per Share: Entry price minus stop-loss level
- Position Size: (Portfolio Risk Amount) / (Risk Per Share)
- Example: For ₹1,400 entry with ₹1,280 stop, risk = ₹120 per share
- Capital Allocation: Maximum 5-8% of total portfolio in a single position
Risk Management:
Risk Control Measures:
- Position Sizing: Limit individual position to 5% of portfolio
- Stop-Loss Discipline: Strict adherence to predetermined stop levels
- Diversification: Maintain exposure across multiple sectors
- Correlation Risk: Avoid concentration in similar cable stocks
Risk Monitoring:
- Daily Monitoring: Track volume, price action, and sector performance
- Weekly Review: Assess progress toward targets and adjust stops
- News Monitoring: Stay updated on company and sector developments
- Market Correlation: Monitor broader market conditions
Sectoral Backdrop:
Indian Cable Industry Outlook:
- Market Growth: The market is projected to grow from USD 10.01 billion in 2025 to USD 17.08 billion by 2032, exhibiting a CAGR of 7.94% during the forecast period
- Infrastructure Push: India's National Grid capacity is expanding continuously under the PM Gati Shakti National Master Plan, which is expected to add around 26,988 circuit km capacity by 2024-2025
- Renewable Energy: India has observed a substantial rise in the demand for wires and cables due to the country's ambitious renewable energy goals
Growth Drivers:
- Smart Cities: The development of smart cities in the country, along with the increase in electronic devices in the household, would increase the demand
- Government Investment: India Wires and Cables Market would grow on the back of rapidly growing investment by the government towards the development of infrastructural projects
- Electrification: Growing electricity demand is driving transmission and distribution network expansion
Fundamental Backdrop:
Company Profile:
- Market Position: RR Kabel is now the 4th largest W&C Company in India by value.
- Global Presence: With a global presence spanning over 67 countries, this electrical company has established a strong international footprint
- Financial Performance: Revenue: 7,618 Cr · Profit: 312 Cr
Financial Metrics:
- Market Cap: Mkt Cap: 16,529 Crore (down -17.5% in 1 year)
- Valuation: Stock is trading at 7.68 times its book value
- Promoter Holding: Promoter Holding: 61.8%
- 52-Week Range: The 52-week high is ₹1825 and the 52-week low is ₹750
Investment Considerations:
- Sector Tailwinds: Strong sectoral growth prospects with government infrastructure push
- Market Leadership: Established position as the 4th largest cable company in India
- International Exposure: Diversified revenue streams from 67 countries
- Valuation Concerns: Recent 22.8% decline in market cap may indicate value opportunity
My Take:
The technical setup for NSE:RRKABEL presents a compelling opportunity with the successful completion of a cup and handle pattern. The 8-month base formation, combined with strong sectoral tailwinds and the company's market leadership position, creates a favourable risk-reward scenario. The breakout above ₹1,420 with volume confirmation suggests institutional participation and potential for sustained upward momentum toward the ₹1,650-1,800 target range.
Key success factors include strict adherence to stop-loss levels, proper position sizing, and monitoring of broader market conditions. The sectoral growth prospects, driven by infrastructure development and renewable energy initiatives, provide fundamental support for the technical breakout.
Keep in the Watchlist and DOYR.
NO RECO. For Buy/Sell.
📌Thank you for exploring my idea! I hope you found it valuable.
🙏FOLLOW for more
👍BOOST if you found it useful.
✍️COMMENT below with your views.
Meanwhile, check out my other stock ideas on the right side until this trade is activated. I would love your feedback.
Disclaimer: "I am not a SEBI REGISTERED RESEARCH ANALYST AND INVESTMENT ADVISER."
This analysis is intended solely for informational and educational purposes and should not be interpreted as financial advice. It is advisable to consult a qualified financial advisor or conduct thorough research before making investment decisions.
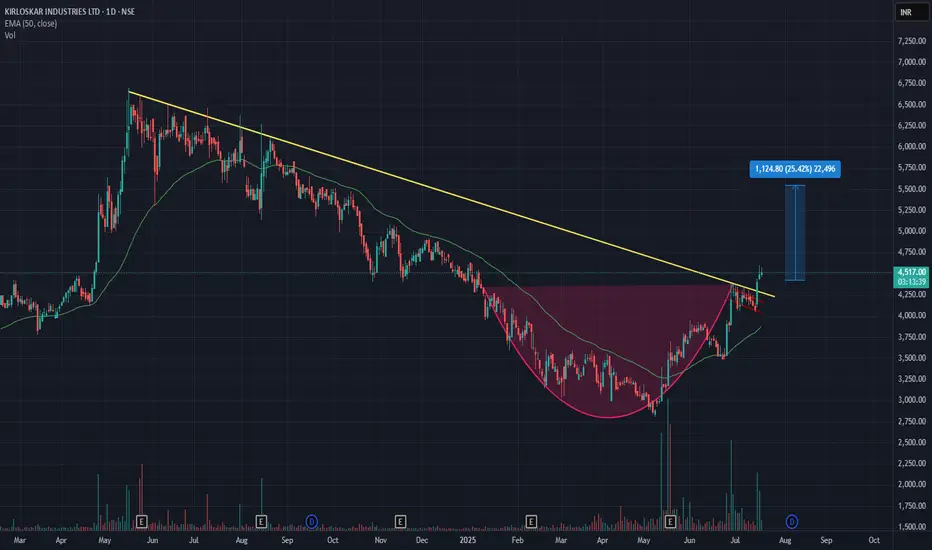
Cup and handle breakout, LONG PositionKirloskar Industries formed a cup and handle pattern and gave a breakout, expecting 1000 points coverage for this long trade, expecting a 25% upmove.
Krishna Institute of Medical Sciences - Cup and Handle pattern"Hey there! 😊 In this chart, I’ve broken down Moving Averages, MACD, RSI, and ADX indicators, all tied in with Price Action. 📊✨ I’ve also included tips on how to interpret them effectively. It's super easy to follow and packed with insights! 💡 Let me know what you think—can’t wait to hear your thoughts! 🚀👍"
