UNIVPHOTO - Cup & Handle Breakout | Daily Chart📊 UNIVPHOTO – Cup & Handle Breakout | Strong Volume | RSI Overbought | Fibonacci Confluence | Daily Chart
📅 Chart Date: July 3, 2025
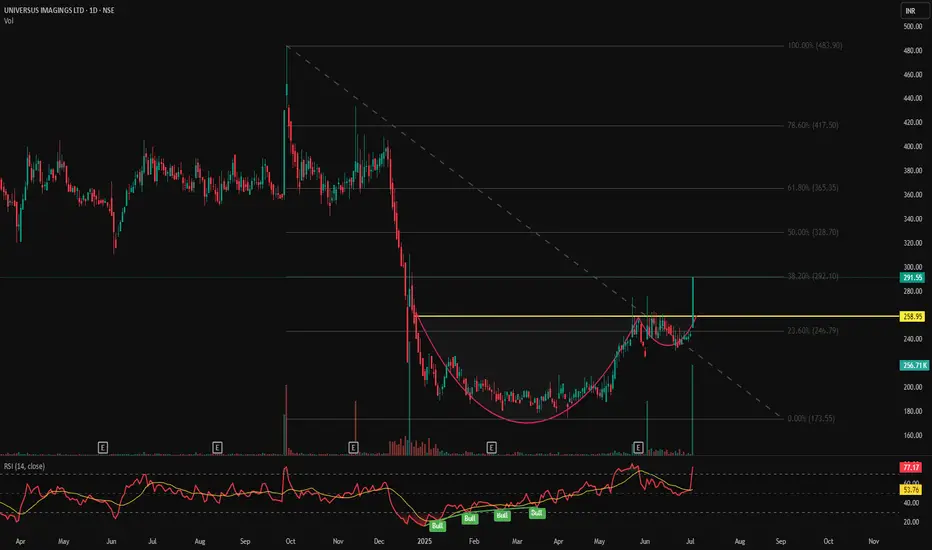
📍 CMP: ₹291.55 (+20.00%)
📈 Symbol: NSE:UNIVPHOTO
🔍 Technical Analysis Summary
✅ Cup & Handle Breakout
Price has broken out above the neckline of the Cup & Handle pattern at ₹258.95 with strong bullish momentum.
Post-consolidation breakout visible with a solid bullish candle.
📊 Fibonacci Retracement Levels (Swing: ₹173.55 to ₹483.90)
23.60% – ₹246.79
38.20% – ₹292.10 ✅ (Price nearing this level – short-term resistance)
50.00% – ₹328.70
61.80% – ₹365.35
78.60% – ₹417.50
100% – ₹483.90 🎯
📈 RSI Indicator (14)
RSI has surged to 77.17, indicating strong momentum but entering overbought territory.
RSI breakout with multiple prior bullish divergences validated the upside move.
📉 Volume
Current breakout supported by above-average volume (256.71K) adds credibility to the move.
🏁 Key Technical Levels
Neckline Breakout: ₹258.95 ✅
Immediate Resistance: ₹292.10 (Fib 38.2%)
Next Targets: ₹328.70 → ₹365.35
Support Levels: ₹258.95 → ₹246.79
Major Swing Low: ₹173.55
💡 Trade Setup
Entry: On breakout confirmation above ₹259
SL: Below ₹246
Short-term Target: ₹292
Mid-term Target: ₹328 → ₹365
Risk Level: Medium (due to RSI overbought – may see retracement)
⚠️ Disclaimer
This chart is for educational and analytical purposes only. Please consult your financial advisor before making investment decisions.
Cupandhandlebreakout
TRANSRAILL : Breakout Stock (Swing Trading) #TRANSRAILL #breakoutstock #swingtrading #chartpattern #cupandhandlepattern #patternbreakout #patterntrading
TRANSRAILL : Swing Trading
>> Breakout Stock
>> Cup and Handle pattern
>> Breakout with Volume
>> Good Strength in Stock
>> Risk Reward Favorable
Swing Traders can lock profit at 10% and keep Trailing
Please Boost, comment and follow us for more Learnings
Disc : Charts shared are for learning purpose only, not a Trade recommendation. Do your own research and consult your financial advisor before taking any position.

BEML: Breaks Multi-Month Resistance: Perfect Cup & Handle SetupNSE:BEML Breaks Multi-Month Resistance: Perfect Cup and Handle Setup Signals Major Upside Potential
Price Action Analysis:
Current Price Movement:
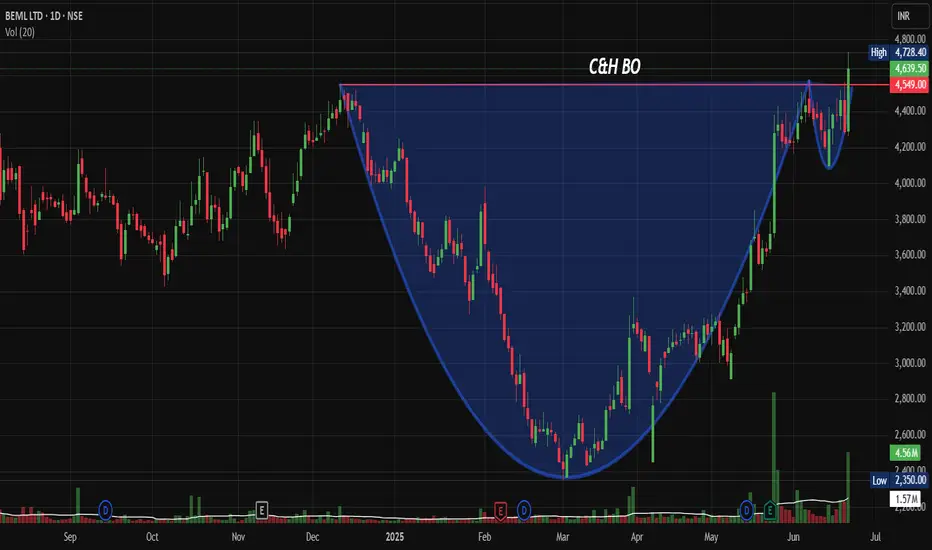
-Current Price: ₹4,291.50 (as of June 20, 2025)
-Daily Change: +₹351.70 (+8.20%) - Strong bullish momentum
-High: ₹4,728.40 | Low: ₹4,261.00
-Opening: ₹4,291.50 | Volume: 1.57M shares
Key Price Action Points:
Phase 1: Initial Decline (Sep 2024 - Dec 2024)
-Price Range: 4,400 to 3,600 levels
-Characteristics: Controlled selling with no panic dumping
-Volume: Moderate selling pressure
-Significance: Formation of the cup's left rim
Phase 2: Deep Correction (Dec 2024 - Feb 2025)
-Price Range: 3,600 to 2,350 (Cup Bottom)
-Characteristics: Capitulation phase with heavy selling
-Volume: High volume during the decline indicates washout
-Key Level: 2,350 marked the absolute low and cup base
Phase 3: Recovery Rally (Feb 2025 - Apr 2025)
-Price Range: 2,350 to 3,400 levels
-Characteristics: Strong bounce from cup bottom with increasing volume
-Price Action: Higher lows formation indicating accumulation
-Recovery Strength: 45% bounce from lows
Phase 4: Handle Formation (Apr 2025 - May 2025)
-Price Range: 3,400 to 3,000 levels (shallow pullback)
-Characteristics: Light volume decline, healthy consolidation
-Duration: Approximately 4-6 weeks of sideways action
-Volume Pattern: Drying up volume during pullback - classic handle behaviour
Phase 5: Breakout Phase (May 2025 - Current)
-Breakout Level: Above 3,400-3,500 resistance
-Price Acceleration: From 3,000 to the current 4,639 levels
-Volume Confirmation: Massive volume surge during breakout
-Momentum: 43% rally from handle lows in just 6-8 weeks
Candlestick Patterns and Price Behaviour
-Recent Action: Large green candles with minimal upper shadows indicating strong buying pressure
-Volume-Price Relationship: Price advancing on expanding volume - healthy trend
-Pullback Quality: Any pullbacks have been shallow with quick recoveries
-Support Holding: Price consistently holding above key moving averages
Price Structure Analysis:
-Higher Highs: Consistent pattern of higher peaks since February 2025
-Higher Lows: Each pullback finds support at higher levels
-Trend Strength: Steep angle of ascent indicates strong institutional buying
-Momentum Characteristics: Price moving in strong trending phases rather than choppy action
Critical Price Levels Based on Price Action:
-Breakout Confirmation: 3,500 level successfully held as support after breakout
-Momentum Continuation: 4,000 psychological level cleared with ease
-Current Resistance Test: Approaching the 4,800 level with strong momentum
-Volume at Key Levels: Each significant level break is accompanied by volume expansion
Chart Patterns:
-Cup and Handle Formation: The chart displays a classic cup and handle pattern spanning from late 2024 to mid-2025, with the cup formation completing around June 2025 at approximately 4,639 levels
-Breakout Confirmation: Stock has successfully broken above the handle resistance levels with strong volume confirmation
-Time Frame: The pattern has developed over approximately 9 months, indicating strong institutional accumulation
Support and Resistance Levels:
Major Support Levels:
-Immediate Support: 4,000-4,100 (psychological and technical level)
-Primary Support: 3,800-3,900 (previous resistance turned support)
-Secondary Support: 3,400-3,500 (breakout level)
-Long-term Support: 2,800-3,000 (cup base formation)
Resistance Levels:
-Immediate Resistance: 4,800-4,900 (current test level)
-Major Resistance: 5,200-5,400 (projected target based on cup depth)
-Extended Target: 5,800-6,000 (long-term projection)
Volume Spread Analysis:
-Breakout Volume: Significant volume spike observed during the recent breakout from handle formation
-Volume Confirmation: Above-average volume during the entire cup formation phase indicates institutional interest
-Current Volume: 1.57M shares showing continued institutional participation
-Volume Trend: Consistent volume buildup supporting price advancement
Base Formation Analysis:
Primary Base Characteristics:
-Base Type: Cup and Handle pattern with 7-month consolidation
-Base Depth: Approximately 47% correction from highs of 4,400 to lows of 2,350
-Base Duration: Extended consolidation period allowing for proper shake-out of weak hands
-Base Quality: Clean consolidation with clear support and resistance levels
Trade Setup Analysis:
Entry Strategy:
-Primary Entry: 4,100-4,200 (on pullback to support zone)
-Aggressive Entry: Current market price around 4,300 with tight stop-loss
-Conservative Entry: Wait for retest of 3,800-4,000 support levels
Exit Levels:
Target 1: 5,200 (21% upside from current levels)
Target 2: 5,600 (30% upside potential)
Target 3: 6,000 (40% upside - long-term target)
Stop-Loss Management:
Initial Stop-Loss: 3,800 (below key support)
Trailing Stop: Move to 4,000 once Target 1 is achieved
Risk-Reward Ratio: 1:2.5 (favourable risk-reward setup)
Position Sizing Recommendations:
-Conservative Approach: 2-3% of portfolio allocation
-Moderate Risk: 3-5% allocation for growth-oriented portfolios
-Risk Management: Maximum 5% position size due to single stock concentration risk
Risk Management Framework:
Key Risk Factors:
Market Risk: Overall market volatility can impact individual stock performance
Sector Risk: Defence and infrastructure sector cyclicality
Execution Risk: Pattern failure if stock breaks below 3,800 support
Risk Mitigation Strategies:
Diversification: Avoid over-concentration in a single position
Stop-Loss Discipline: Strict adherence to predetermined exit levels
Position Monitoring: Regular review of technical and fundamental developments
Sectoral and Fundamental Backdrop:
Business Verticals:
-BEML operates across Defence, Rail, Power, Mining and Infrastructure sectors, serving India's core industries BemlindiaBemlindia
-The company manufactures heavy earthmoving equipment for mining and construction, defence vehicles, and coaches for metro and Indian Railways, Bharat Earth Movers Limited
Financial Performance:
-Market Cap: ₹19,324 Crore with revenue of ₹4,022 Cr and profit of ₹293 Cr
-Promoter holding stands at 54.0%, indicating strong government backing.
-The board has recommended a final dividend of ₹1.20 per share for FY25, reflecting confidence in financial performance.
Growth Drivers:
-Company targeting ₹30bn annual opportunity in the mining sector with state-of-the-art equipment.
-Defence projects, including DATRAN prototypes, are expected to be completed by mid-2025
-The company has grown from ₹5 Cr turnover in 1965 to over ₹4,300 Cr currently.
Sector Outlook:
-Defence Modernization: Beneficiary of India's defence modernization and Make in India initiatives
-Infrastructure Push: The Government's focus on infrastructure development supports mining and construction equipment demand
-Railway Expansion: Metro and railway coach manufacturing aligned with India's transportation infrastructure growth
Investment Thesis:
-PSU Re-rating: Part of the broader PSU re-rating theme in Indian markets
-Diversified Revenue: Multi-sector exposure provides revenue stability
-Government Support: Strong backing from the Ministry of Defence ensures policy support
-Technical Breakout: Pattern completion suggests an institutional accumulation phase
My Take:
The combination of strong price action momentum with improving fundamental backdrop makes BEML an attractive investment opportunity for medium to long-term investors, with the cup and handle breakout providing clear entry and exit parameters for risk management.
Keep in the Watchlist.
NO RECO. For Buy/Sell.
📌Thank you for exploring my idea! I hope you found it valuable.
🙏FOLLOW for more
👍BOOST if you found it useful.
✍️COMMENT below with your views.
Meanwhile, check out my other stock ideas on the right side until this trade is activated. I would love your feedback.
Disclaimer: "I am not a SEBI REGISTERED RESEARCH ANALYST AND INVESTMENT ADVISER."
This analysis is intended solely for informational and educational purposes and should not be interpreted as financial advice. It is advisable to consult a qualified financial advisor or conduct thorough research before making investment decisions.
Cup & Handle Breakout + Golden Cross Confirms Bullish Megatrend Timeframe: Daily
Ticker: NSE:SIEMENS
🔥 Key Technical Setup:
Cup & Handle Pattern:
Cup Depth: ~1026 points
Breakout Level: 3414 (multi-touch resistance).
Golden Cross Confirmation: 50 EMA crossed above 200 EMA (bullish long-term momentum shift).
Volume & Price Confirmation:
- Entry Trigger: Close above 3414 with a strong green candle + above-average volume (min. 1.5x 20-day avg volume).
- False Breakout Filter: Volume must surge to validate breakout.
🎯 Trade Strategy:
Entry Zone: 3415–3430 (after confirmed breakout).
Stop Loss: 3169 (swing low of the handle, below key support).
Target 1: 3750
Target 2: 4170
Final Target: 4455 (cup depth projected from breakout: *3414 + 1026 = 4440–4455*).
The trade targets 4455, but reaching this level will take time—patience is key as price works through resistance at 3750 and 4170.
📉 Price Action Mantra:
“Price absorbs all noise! Trade the CHART, not the news.”
📊 Why This Works:
1. Golden Cross Amplifies Momentum: Post-crossover, rallies average +25% in trending stocks.
2. Cup & Handle Statistics: 85% success rate when volume confirms breakout.
3. Volume Divergence: Declining volume in handle + surge on breakout = institutional accumulation.
⚠️ Risk Management:
Position Size: Risk ≤1% capital per trade.
Trailing SL: Move SL to 3300 after Target 1 (3750) hit.
Partial Exit: Book 50% at 3750, 25% at 4170, hold 25% for 4455.
🧠 Psychology & Market Structure:
Resistance Levels to Watch:
3750: Profit-taking zone.
4170: Key options barrier (break = accelerated FOMO).
Support Floor: 3200–3169 (must hold to preserve structure).
Set alerts, follow volume, and let price lead the way!
📌 Disclaimer:
This is not financial advice. Past performance ≠ future results. Conduct your own due diligence. Technical analysis has limitations and may not account for black swan events. Manage risk aggressively.

DEEPAKFERT | Cup and Handle Breakout |Retest | DailyHere's the **technical analysis** for **Deepak Fertilisers (DEEPAKFERT)**
---
### 📝 **Technical Analysis – Deepak Fertilisers (Daily Timeframe)**
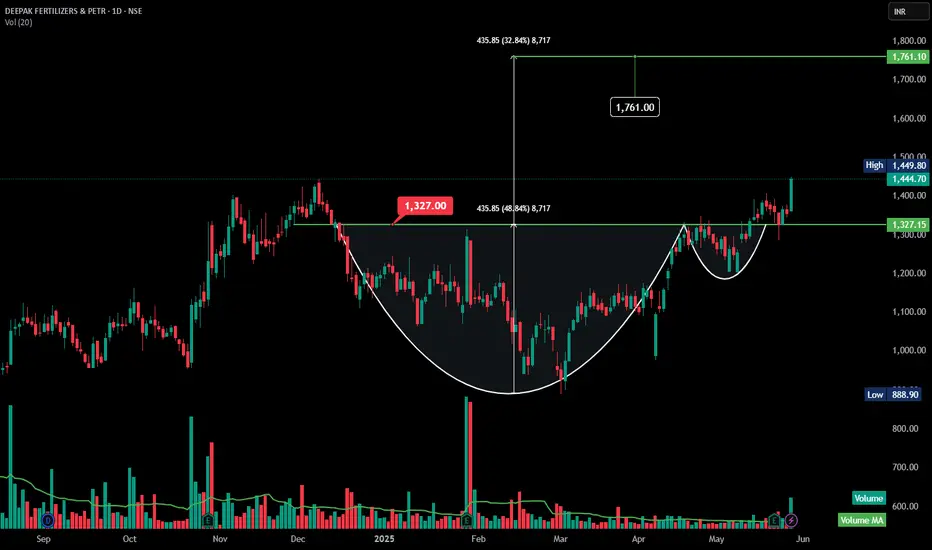
**Date:** May 28, 2025
**Pattern Identified:** ✅ *Cup and Handle Breakout*
---
### 1. **Chart Pattern Overview**
* A textbook **Cup and Handle** formation is complete.
* Price has **broken out** above the neckline resistance of **₹1327**, with strong bullish momentum.
* This breakout signals the potential beginning of a **fresh uptrend**.
---
### 2. **Volume Confirmation**
* **Breakout candle is supported by high volume**, indicating genuine buying interest.
* Volume has surpassed the 20-day moving average — a critical confirmation for pattern reliability.
---
### 3. **Price Action Summary**
* Price action shows a prolonged base, forming the cup.
* The handle showed minor consolidation before the breakout.
* Breakout level: ₹1327
* Current price: ₹1444.70
* Immediate resistance broken cleanly with a wide bullish candle.
---
### 4. **Target Calculation**
* **Cup depth**: ₹435.85
* **Target Price** = ₹1327 + ₹435.85 = **₹1761.00**
➤ This gives a **potential upside** of **\~22%** from current levels.
---
### 5. **Support & Risk Management**
* **Key Support Zone**: ₹1327 (former resistance turned support)
* **Aggressive SL**: ₹1370
* **Conservative SL**: ₹1325 (breakout base)
---
### 6. **Trend & Sentiment**
* With this breakout, sentiment has flipped **strongly bullish**.
* Follow-through price action and continued volume spikes will further validate the move.
---
### ✅ **Conclusion**
* **Pattern**: Cup and Handle
* **Breakout Level**: ₹1327
* **CMP**: ₹1444.70
* **Target**: ₹1761
* **Stop-loss**: ₹1370–1325
* **Bias**: Bullish
* **Strategy**: Buy on dip / Hold for target with trailing SL
---
Would you like a **voiceover script** for this chart as well, or shall I combine this with the previous stocks for a full video/audio narration?
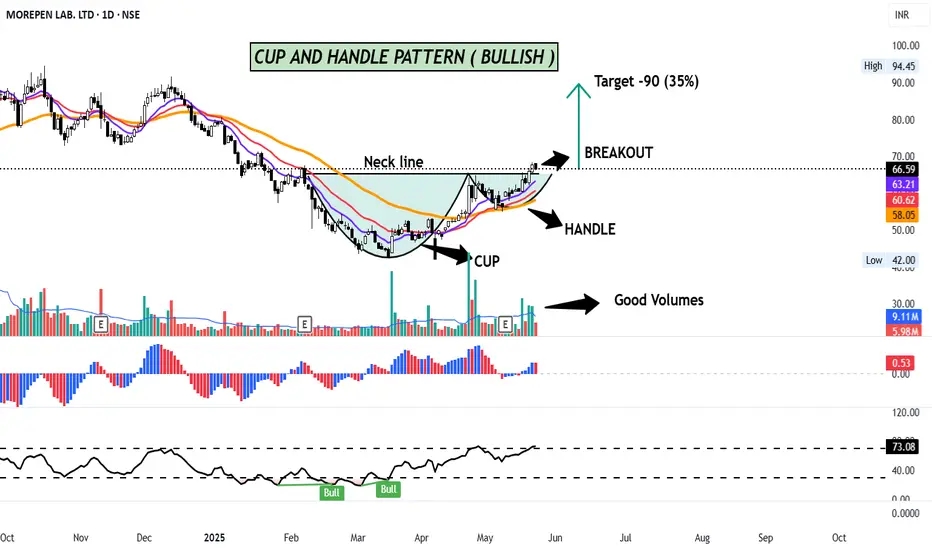
MOREPEN LAB - CUP AND HANDLE PATTERN (BULLISH )More pen Lab has formed CUP AND HANDLE pattern on the Daily charts and has given a breakout with good volumes.
A cup and handle price pattern resembles a cup with a handle, where the cup is in the shape of a "u" and the handle has a slight downward drift. A cup and handle is considered a bullish signal signalling an uptrend.
Morepen Labs is trading above its 11 & 22 day EMA. RSI is at 73 and MACD is well above zero line signalling positive momentum.
CMP- Rs. 66
Target Price- Rs.90 ( 35%)
SL - 62
Disclaimer: This is not a buy/sell recommendation. For educational purpose only. Kindly consult your financial advisor before entering a trade.
SAMHI HOTELS - CUP AND HANDLE PATTERN (BULLISH )SAMHI has formed CUP AND HANDLE pattern on the Daily charts and has given a breakout.
A cup and handle price pattern resembles a cup with a handle, where the cup is in the shape of a "u" and the handle has a slight downward drift. A cup and handle is considered a bullish signal signalling an uptrend.
SAMHI is trading above its 11 & 22 day EMA. RSI is at 61 signalling positive momentum.
CMP- Rs. 186
Target Price- Rs.233 ( 25%)
SL - 181 ( Breaking the Neckline)
Disclaimer: This is not a buy/sell recommendation. For educational purpose only. Kindly consult your financial advisor before entering a trade.

DELHIVERY- CUP AND HANLDE PATTERN BREAKOUT ( Bullish)Delhivery has formed CUP AND HANDLE pattern on the Daily charts and has given a breakout .
A Cup and Handle price pattern resembles a cup with a handle, where the cup is in the shape of a "u" and the handle has a slight downward drift. A cup and handle is considered a bullish signal signalling an uptrend.
Delhivery is trading above its 11 & 22 day EMA. RSI is at 73, MACD is above zero line signalling positive momentum.
CMP- Rs. 318
Target Price- Rs390 ( 25 % upside)
SL - 300 ( Breaking the confirmation Line)
Disclaimer: This is not a buy/sell recommendation. For educational purpose only. Kindly consult your financial advisor before entering a trade.

Mahindra Logistics- CUP AND HANLDE PATTERN BREAKOUT ( Bullish)Mahindra Logistics has formed a CUP AND HANDLE pattern on the Daily charts and has given a breakout with good volume.
A Cup and Handle price pattern resembles a cup with a handle, where the cup is in the shape of a "u" and the handle has a slight downward drift. A cup and handle is considered a bullish signal signalling an uptrend.
The target of this pattern signals an upside potential of 30% from the current price level in medium term.
Stock is trading above its 11 & 22 day EMA. RSI is at 68, MACD is above zero line signalling positive momentum.
CMP- Rs. 331
Target Price- Rs415 ( 30% upside)
SL - 315
Disclaimer: This is not a buy/sell recommendation. For educational purpose only. Kindly consult your financial advisor before entering a trade.

Vintage Coffee and Beverages Ltd (VINCOFE) - Daily ChartVintage Coffee and Beverages Ltd (VINCOFE) - Daily Chart
Pattern: A clear "Cup and Handle" pattern is identified.
Cup: Formed roughly between late February 2025 and late April 2025, with the low around 75.00.
Handle: A small consolidation (handle) formed in early May 2025.
Breakout: The price appears to be breaking out or has just broken out above the neckline of the cup and handle pattern, which is around the 103.00 - 103.25 level.
Volume: There's a noticeable increase in volume on the breakout day, which is a positive sign, adding strength to the breakout.
Target: The depth of the cup (approximately 29.70 points) is projected upwards from the breakout point. This gives a potential target of around 134.68.
Support: The breakout level around 103.00 - 103.25 should now act as support. The low of the cup (75.00) is a more significant support.
Resistance: The immediate resistance would be the recent swing highs during the handle formation, and then the projected target of 134.68.
Interpretation: The chart suggests a bullish outlook following the Cup and Handle breakout, supported by good volume. The stock has the potential to move towards the 134.68 target as long as the breakout level holds.

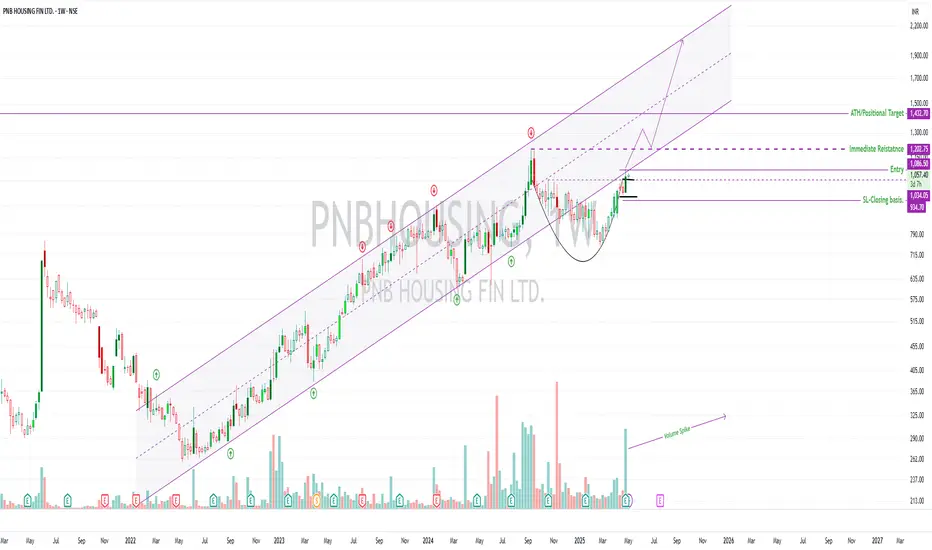
PNB Housing Finance – Weekly Positional Setup🏠 PNB Housing Finance – Weekly Positional Setup
🧭 Strategy: Cup & Handle breakout | 🏦 Sector: Housing Finance / NBFC
🔍 Setup Overview
The stock is trading above key DMAs, indicating strong trend alignment 🔼
Sector momentum is clearly picking up — Housing Finance & NBFCs showing traction 📈
After briefly breaking below its ascending channel, price is now attempting a re-entry — often a bullish sign of reclaiming strength 🔁
A Cup & Handle pattern is forming on the weekly chart — a classical continuation setup 🏺
The first breakout zone was ₹1034.05, which had decent Weekly volume — but caution due to weakness seen in Daily TF 📉
📊 Volume Insight (Why It Matters)
✅ Weekly TF shows volume spike during recent bullish move
⚠️ However, on the Daily TF, red candles had higher volume — suggesting distribution or supply at higher levels
⛔ Avoid low-volume breakouts — these tend to fail or trap early entries
🔑 Wait for a clean Weekly close above ₹1086.50 with volume support(Risk Takers can take the leap now)
🧩 Confluence Factors (Multiple Confirmations = Stronger Setup)
Pattern is forming inside a long-term ascending channel
Reclaiming the channel = bullish structural strength
Sector strength + stock above all key moving averages = powerful context
All this happening in a period where broader market (Nifty 500) is still below 200DMA, making relative strength stand out
⚠️ Macro & Technical Risks
Price could stall or reverse at the positional target near ₹1432.70 (ATH zone)
Geopolitical uncertainty and macroeconomic shifts (rate changes, FII flow) could derail the move
If volume does not accompany breakout, avoid or reduce position
🛡️ Risk Management & Strategy
Use ₹934.70 as SL, based on structure, strictly on closing basis
Total risk: 13.36%, potential reward: 31.85%, giving R:R = 1 : 2.36
Only enter after clear breakout confirmation with volume
This is a positional setup, not a short-term one.
Most important: Position sizing is critical — don’t overcommit on early setups
🎯 Educational Note
Cup & Handle setups are most powerful when supported by:
Multi-timeframe confirmation 📈
Sectoral strength 🏦
Channel/structural context 📐
Volume breakout 📊
Patience is your edge. Enter only when all the pieces align.
Disclaimer: This analysis is for educational and informational purposes only. It does not constitute investment advice or a recommendation to buy or sell any securities. Always conduct your own research and consult with a qualified financial advisor before making any trading decisions. Past performance is not indicative of future results. Trade responsibly.
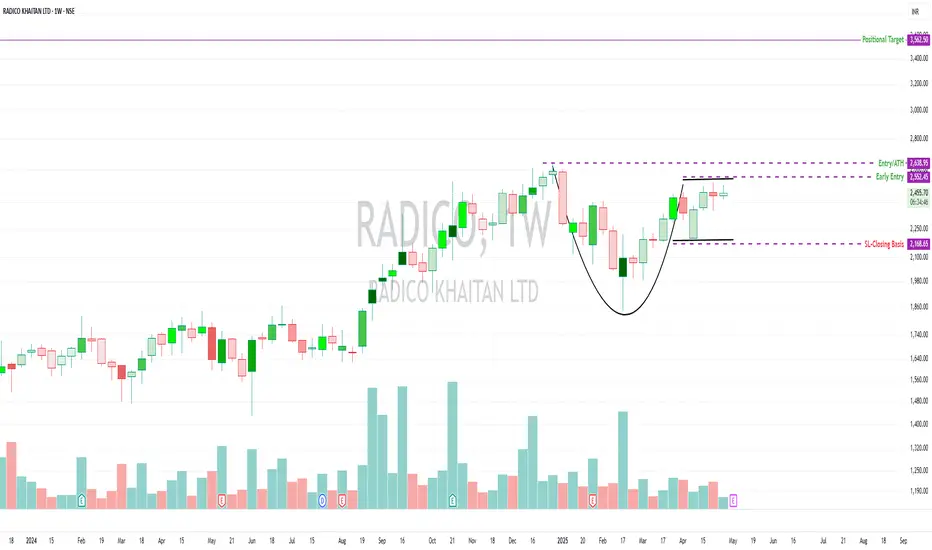
RADICO – Cup Base Forming | Testing Waters, No Diving Yet📈 RADICO – Cup Base Forming | Testing Waters, No Diving Yet
RADICO is forming a classic cup base on the weekly chart, trading above key DMAS with improving structure and RSI strength. A pilot entry to test the strength of the setup — not a full position.
🔍 Technical Overview
🟢 Structure: Well-formed cup attempting a neckline test
⚠️ Volume: Currently drying up — wait for breakout + volume spike
📍 Entry: Early Pilot Entry t at ₹2,552.45
✅ Add only if ATH breaks (₹2,638.95) with a clean weekly candle and volume confirmation
⚖️ Risk Management
❌ SL is deep (~15%) — manage position sizing carefully
💡 Expect shakeouts — volatility remains elevated
🧠 This is a positional pick, not a short-term play
🔄 Risk: Reward planned near 1:2, but no hard target in the current market volatility
⚠️ Macro Context
Nifty 500 is still below its 200 DMA
The market is not fully out of danger
Be nimble, not aggressive
🧠 Final Thoughts
Test the setup, don’t commit fully yet
Let volume confirm — breakout without power = trap risk
Trade as per your style
Risk management isn’t optional — it’s survival
📉 Disclaimer:
This is not investment advice. For educational purposes only. Do your own research and manage capital based on your strategy.
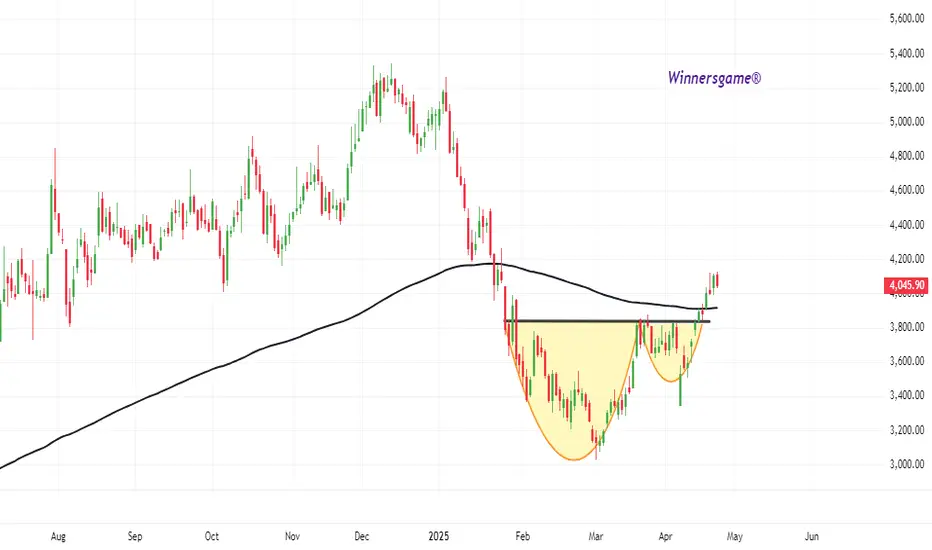
CAMS, C&H BREAKOUT DONECAMS sustaining above 200EMA after Cup & Handle breakout done. Buy CAMS futures till 3930 for target of 4500/4650 and 4800.
keep suitable stop below 3830 on closing basis.
Bajaj Finserv Cup & Handle at Play! Will It Break Out?📌 Setup Overview:
Stock in a 4-year trading range 📊 and currently trading just below this range.
Cup and Handle formation ☕ along with a potential VCP setup (Volatility Contraction Pattern).
No left-side resistance—unlike stocks that fell 40-50%, there are fewer trapped buyers here.
Volume gradually increasing 📈, a necessary condition for a strong breakout.
Finance sector showing strength 💰—index is trading above key DMAs and broke out of a base first.
Stock is trading above key DMAs, adding technical confluence.
🎯 Trade Plan:
✅ Entry: Above ₹1,941 🔼
✅ Immediate Resistance: ₹2,035 (Watch Price Action at this level)
✅ Stop-Loss (SL - Closing Basis): ₹1,547.80 (20.29% below entry)
✅ Target (Tentative Positional): ₹2,510.30 🎯
📌 Risk-to-Reward (R:R) & Percentages:
SL Percentage: ~20.29%
Target Percentage (from ₹1,941): ~29.34%
R:R Ratio: 1:1.44
⚠️ Key Risks & Considerations:
1️⃣ Immediate Resistance at ₹2,035 – Monitor price action here. If rejected, wait for a re-entry after confirmation.
2️⃣ Deep Stop-Loss (~20%) – Adjust position sizing accordingly. Do not go all-in at once.
3️⃣ Market Structure: If broader markets remain weak, reassess if Bajaj Finserv is showing relative strength or struggling.
📌 Final Thoughts:
Wait for breakout confirmation above ₹1,941 with volume. 🚀
Monitor PA at ₹2,035—strong close above this strengthens the setup.
Stick to SL discipline and trail as stock moves higher.
📢 Disclaimer: This is for educational purposes only. Not financial advice. Always manage risk and do your own research before making any trades.
🚀 Trade smart & stay disciplined!

HIKAL LTD - Long-Term Cup & Handle Breakout | Weekly ChartHIKAL LTD - Long-Term Cup & Handle Breakout | Weekly Chart
🕒 Timeframe: 1W | NSE: HIKAL
📅 Date: April 18, 2025
💰 CMP: ₹431.60
📈 Volume: 4.57M
🔍 Chart Highlights
☕ Cup & Handle pattern forming over a multi-year base, suggesting a potential long-term breakout.
📏 Breakout Zone (Resistance):
🟪 ₹440–₹460 (purple zone) – Multiple rejections in the past. Price is now testing this major supply zone.
📉 Downtrend Resistance Line:
Price has broken above the falling trendline, confirming bullish strength.
🟩 Support Levels:
₹400 (recent breakout retest zone)
₹360 (previous structure low)
📈 Resistance Ahead:
₹470 (long wick area)
₹510 (supply zone)
🧠 Technical Indicators
📊 RSI (Relative Strength Index)
RSI at 61.63, approaching the bullish zone
RSI breakout above previous bearish structure
“Bull” and “Bear” labels show previous sentiment shifts
🔔 Conclusion
✅ A classic Cup & Handle breakout on weekly timeframe with strong volume surge
✅ Above key resistance with bullish RSI — suggests potential continuation
⚠️ Watch for sustained close above ₹460 for confirmation
🔍 Chart by: PriceAction_Pulse
📬 For more detailed insights, follow on TradingView
✅ Educational purpose only — DYOR before any investment decision.

JSW Steel – Strong Setup but Manage Risk 🔹 Trend: The stock is in a strong uptrend, forming Higher Highs & Higher Lows (HH-HL) on the long-term charts. Trading inside a well-respected ascending channel 📊.
🔹 Moving Averages: Trading above key DMAs, indicating strength.
🔹 Volume: Increasing, a positive sign 📈.
🔹 Sector Strength: The Metal Index is showing early signs of leadership, trading above the 50 & 200 DMA, while most indices are still below 200 DMA.
🔹Forming a Cup and Handle pattern.
🔍 Technical Setup & Strategy
🚀 Breakout above ₹1,061 – Watch for volume confirmation before entering.
📌 Entry Levels: Above ₹1,061.
📌 Stop Loss (SL): ₹879 (Closing Basis).
📌 Positional Target: ₹1,290.
⚠️ Risk: 17% – Position sizing is critical!
📈 Risk:Reward (R:R) – 1:1.35 (Could improve if adding at better levels).
🛑 Risk Management & Caution
⚠️ Avoid going all-in at once! Stocks often pull back to the channel bottom before continuing up.
⚠️ Potential Bull Trap? The overall market remains weak; this could be a counter-trend movement. Stay cautious.
⚠️ Confirmation Matters! If the stock retests the channel bottom & reverses strongly, that’s a great entry opportunity.
🔎 Observations
✅ JSW Steel held up well in the correction, dropping less than 18% – showing resilience 💪.
✅ Metals are cyclical – be patient with entries and buy in phases 📊.
💡 Final Thought: Strong setup, but risk control is key! Breakout traders can enter above ₹1,061 with volume, while pullback traders can wait for a retest near the channel bottom.
📜 Disclaimer: This is for educational purposes only. Not financial advice. Always do your own research and manage risk accordingly! 🚀📉

ZEEL : Breakout Candidate#zeel #trendline #breakout #patterntrading #chartpattern #cupandhandlepattern #momentumtrade #swingtrade
Zeel : Swing Trade
>> Trendline Concept
>> Cup & Handle chart pattern visible
>> Moving Avg Concept also suggests Breakout of 50 EMA
>> Breakout point of Trendline / Chart Pattern & Moving Avg concept are all in confluence at same point. (Refer both charts)
>> Hence its a Breakout candidate, probability is higher
>> Upside potential is of 20-25% & Downside Potenial is 9-10%
>> So a good 1:2 Risk Reward Trade
Swing Traders can lock profit at 10% and keep Trailing
Please Boost, comment and follow us for more Learnings.
Note : Markets are still Tricky and can go either ways so don't be over aggressive while choosing & planning your Trades, Calculate your Position sizing as per the Risk Reward you see and most importantly don't go all in
Disc : Charts shared are for learning purpose only, not a Trade recommendation. Do your own research and consult your financial advisor before taking any position.

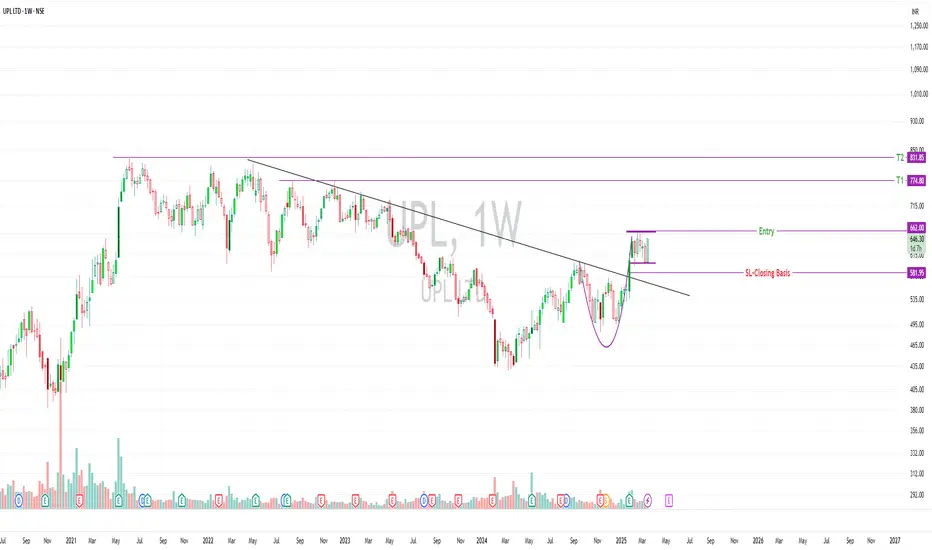
UPL Ltd - Cup & Handle Breakout Setup📊 Trade Plan:
Breakout Entry: Above ₹662 (With 4x-5x Volume Confirmation)
Stop Loss (SL - Closing Basis): ₹581.95
Target 1 (T1): ₹775
Target 2 (T2): ₹831
Current Price: ₹646
📈 Risk & Reward Calculation:
Risk to SL: ₹646 - ₹581.95 = ₹64.05 (9.91%)
Reward to T1: ₹775 - ₹662 = ₹113 (17.07%)
Reward to T2: ₹831 - ₹662 = ₹169 (25.53%)
Risk-Reward (R:R):
To T1: 1:1.72 ✅
To T2: 1:2.57 ✅
📊 Technical Highlights:
✅ Cup & Handle Formation: Classic bullish pattern with a potential breakout
✅ Trading Above Key DMAs: Supports bullish structure
✅ Sectoral Strength: Agrochemicals showing momentum, aiding UPL
✅ Volume Confirmation Needed: Avoid entry without 4x-5x volume spike
✅ Trading Against Trend: Trade light, no heavy positions
📉 Fundamental Concerns:
❌ ROE (-4.28%) & ROCE (3.29%) are poor: Indicates weak profitability
❌ High Debt & Low Efficiency: Capital allocation is not optimal
❌ Dividend Yield (0.15%) is Low: Not an income-generating stock
❌ Market Cap: ₹48,512 Cr – Large cap, but currently weak performance
🔎 Key Insight:
UPL's fundamentals are weak with low profitability (negative ROE) and poor return on capital (ROCE 3.29%), meaning the stock relies more on technical breakout rather than strong financial backing.
⚠️ Risks Involved:
❌ Breakout Failure Risk: If ₹662 is not sustained, stock may fall
❌ Sector Volatility: Agrochemicals are cyclical, demand-dependent
❌ Overall Market Weakness: If Nifty falls, UPL may struggle
❌ Fundamentally Weak: Not ideal for long-term holding
🚨 Disclaimer:
⚠️ This is not financial advice. Trade light and avoid heavy risk, as this setup goes against the long-term trend. Ensure proper risk management before entering. Volume confirmation is a must! 🚀
Bajaj Healthcare - Fresh Opportunity for Upside Move! 📈 Bajaj Healthcare - Fresh Opportunity for Upside Move! 🚀
🔍 Key Observations:
Stock is forming a CNH (Continuation Narrowing Pattern) on the daily timeframe.
Broke out of a 3-year-old trading range on 18th Dec 2023.
Consolidating in a narrow range since 19th Dec 2023.
Volume confirmation (3x-5x) and a strong candle needed for breakout confirmation.
Broader markets are still in a weak structure (LL-LH), so trade cautiously.
🎯 Trade Setup:
Entry: Above 717 (Breakout level).
Stop Loss (SL): Closing below 595 (17.01% risk).
Target 1 (Positional): 942 (31.38% reward).
📊 Risk-Reward (RR):
RR Ratio: 1:1.8
💡 Trading Strategy:
Initial Entry: Buy above 717 with a small test quantity (limit position size).
Add More: On breakout and retest (if it occurs).
Overall Position Size: Keep it low as we are trading against the broader market trend.
Wait for Confirmation: Broader markets need to show signs of reversal (closing above 50-200 DMAs) for scaling in further.
⚠️ Disclaimer:
This is not investment advice. Trade at your own risk.
The broader market is still in a weak structure (LL-LH), and the probability of failure is high.
Always use proper risk management and limit position size.
Past performance is not indicative of future results.
📌 Key Takeaways:
CNH pattern suggests a potential breakout.
Volume confirmation is critical for validity.
Trade cautiously in a weak market environment.
RR of 1:1.8 offers a favorable setup if the breakout sustains.
🚨 Final Note:
Personally, I will scale in only when the broader markets show signs of reversal (closing above 50-200 DMAs).
Until then, trade lightly and stay disciplined!

V2 Retail Ltd: CnH Breakout Setup🛒 V2 Retail Ltd: CnH Breakout Setup
Entry: ₹2,002.85
Stop Loss (SL): ₹1,687 (on closing basis; -15.77%)
Target:
🎯 Positional Target: ₹2,323 (+15.98%)
🚀 Why this trade?
Chart Pattern: Clear Cup and Handle (CnH) breakout with the stock trading in an ascending channel.
Trend Confirmation: The stock is maintaining its position above key Daily Moving Averages (DMAs), confirming strength in the uptrend.
Sectoral Tailwind: Budget 2025 brings a positive outlook for the consumption and FMCG sector, supporting this trade's fundamentals.
Volume: Increasing, but it still needs improvement to strengthen the breakout signal.
⚠️ Key Observations and Risks:
Resistance Ahead: The channel top may act as resistance, so price action near these levels should be watched carefully.
Market Context: Broader market trends are weak, making this a counter-trend trade that adds an element of risk.
Volume Concerns: Volume is yet to fully confirm a breakout; a retest is possible.
📚 Educational Insights:
Channel Tops as Resistance: In ascending channels, the upper boundary often acts as dynamic resistance; breakout strength depends on volume.
Risk Management: With a wide stop loss (closing basis), position sizing becomes critical to limit exposure.
This is a positional trade, so short-term fluctuations shouldn’t influence decisions prematurely.
✅ Suggested Approach:
Take small positions initially to minimize risk while testing the market.
Monitor volume and sector strength for additional confirmation.
Avoid over-leveraging in trades with broad SLs, especially in counter-trend setups.
📈💡 "Adapt to market behavior, but always trade with discipline and patience."
Disclaimer: This analysis is for educational purposes only and should not be considered as financial advice. Trading and investing involve significant risk, and past performance is not indicative of future results. Please consult with your financial advisor before making any trading or investment decisions. Always manage your risk and trade responsibly.

Tata Cons. Prod. Cup and Handle BO.NSE:TATACONSUM today gave a Cup-and-Handle Breakout, with the RSI and MACD Showing Buy Strength as it crossed Major Levels.
Trade Setup:
It can be a Good 1:1 RISK-REWARD Trade with the recent base being crucial and the Size of the Cup as the Target on the upside as it usually is for cup & Handle Breakout.
Target(Take Profit):
1087 Levels for Swing/Positional Trader.
Stop-Loss:
Around 926 For Swing Trader and a Recent Base of 880.35 for Positional Trader.
📌Thank you for exploring my idea! I hope you found it valuable.
🙏FLLOW for more
👍BOOST if useful
✍️COMMENT Below your views.
Meanwhile, check out my other stock ideas below until this trade is activated. I would love your feedback.
Disclaimer: This analysis is intended solely for informational and educational purposes and should not be interpreted as financial advice. It is advisable to consult a qualified financial advisor or conduct thorough research before making investment decisions.

cup and handle breakoutBajaj consumer on weekly timeframe has formed cup and handle pattern and given breakout with good volume. The short term and mid term momentum is also bullish with recent crossover.
the target is of 1:3 which indicates it could be a fair trade.

Bullish Outlook on #AIIL#AIIL Authum Investment & Infrastructure Ltd. has shown a promising breakout from a prolonged consolidation phase, forming a Cup and Handle pattern on the daily chart. Key
observations:
Volume Confirmation: The breakout is accompanied by a significant rise in volume, confirming strong buying interest .
All-Time High Potential: The price is moving toward uncharted territory, suggesting strong bullish momentum.
Support Zone: The consolidation range now acts as a strong support zone for any pullback.
Relative Strength: The stock is outperforming its peers, showcasing superior relative strength.
Recommendation:
Entry Point: Buy on dips near the breakout level (around ₹1,850–₹1,900) for optimal risk-reward.
Target: ₹2,100 and above, based on pattern projections.
Stop Loss: Place a stop loss below ₹1,750 to manage risk.
Authum appears to be in Stage 2 (Advancing), making it an attractive candidate for positional traders. Fundamentals and further price action will dictate long-term potential.
