BHARTI AIRTEL: BEAUTIFUL CUP AND HANDLE ON WEEKLY CHARTPlease check the chart. All the details are mentioned in it. Do not take positions based on someone else's ideas. Do your own study. This information is for educational purpose
Cuphandle

DLF - Ready to breakout Beautiful cup and handle patter on weekly and daily charts.
Although around 320 was a good level but can buy at CMP
Stop - 299

Trading Patterns 101 - The Cup & Handle patternWhat is a Cup and Handle pattern?
• The pattern resembles a cup with a handle, where the cup is in the shape of a "u" and the handle has a slight downward drift.
• This drop, or “handle” is meant to signal a buying opportunity. When this part of the price formation is over, the stock may reverse the course and reach new highs.
• It is a bullish continuation pattern i.e. it extends the existing uptrend
Parts of a Cup and Handle pattern:
The cup and handle chart has 3 main components:
• Cup
• Handle
• Neckline/Resistance
Important aspects:
1. Prior Trend: The cup and handle pattern is a bullish continuation pattern, hence the prior trend should be an uptrend.
2. Cup length: Generally, cups with longer and more "U" shaped bottoms provide a stronger signal. It should resemble a rounding bottom. This ensures that the cup is a consolidation pattern with valid support at the bottom of the “U”. The perfect pattern would have equal highs on both sides of the cup, but this is not always the case. Avoid cups with sharp "V" bottoms because there is almost no consolidation in that case.
3. Cup depth: Ideally, the cup should not be overly deep. In practice, the cup depth can be up to 60% of the last swing move. In my opinion, the best cups often have a depth of about 50% of the last swing.
4. Handle: Avoid handles that are overly deep also, as handles should not exceed 50% depth of the cup. The best cup and handle patterns have a shallow retracement on the handle (not more than 1/3 of the cup). However, in some situations, the price may retrace up to 0.618 Fibonacci level.
5. Breakout: Bullish confirmation comes when the pattern breaks above the neckline made using the prior highs with a good volume.
6. Volume: Volume should decrease as prices decline and remain lower than average in the base of the bowl; it should then increase when the stock begins to make its move higher, back up to test the previous high.
7. Target: The profit target is equal to the depth of the cup. It can be measured by the distance between the bottom of the cup and the neckline and extending that distance upward from the breakout level.
8. Stop-loss: Ideally, the stop loss is placed at the lowest point of the handle. But if the price oscillated up and down a number of times within the handle, the stop-loss can also be placed below the most recent swing low.
Examples of the Cup & Handle pattern:
Like always, if anyone is interested in getting a PDF version of this thread, then you can message me, I'll provide it.
Happy learning. Cheers!

Classic cup & handle formation on daily time frameClassic cup & handle formation on daily time frame , with a breakout above the neckline.One should buy the stock on cmp & add on dips .

TATAMOTORS - Cup and HandleTATAMOTORS - A Cup and Handle formed in 1HR chart and it is already broken the handle. :)

Bank of BarodaCup and handle pattern
Target of 85/95
If the pattern breaks above 95 then the target will be 125-130

ALKEN is trying to make cup handle patternALKEN is trying to make cup handle pattern.
Breakout is still not confirmed. currently in accumulation zone.
Target levels are mentioned in the chart.

HINDCOPPER CUP & Handle patternit has formed a CUP & Handle pattern on daily charts, looking to raise 10% at least for recent high.

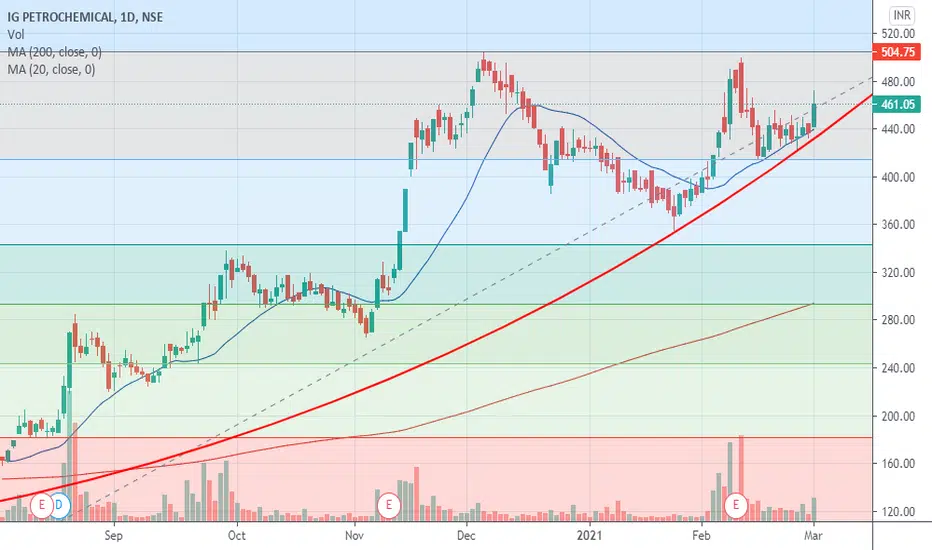
IGPL towards resistanceAfter forming double top on daily chart, but stock is moving towards higher with volume.
500 level acts as good resistance, wait for a clear breakout on weekly chart.
Accumulate BORORENEW TGT 350, 390Rounding Bottom with Cup and Handle Complete in Borosil Renewables.
Achieveable Targets TGT 350, 390+
*Only for Educational and Data Sharing Purpose. No stock buy or Sell Recommendation

RAIN industries BreakoutRAIN has given breakout on weekly chart,
Patterns:
Inverted H&S on Weekly
Cup Handle on Weekly
Fibonacci Retracement
on 21-Dec, it has given false neckline breakdown, however it reclaimed it with good volume.
it sustained above neckline after giving false breakdown of neckline.
it as given Cup& handle breakout on weekly with good volume
it has retrace 61.8% of fib retracement.
it has a potential target of 211.
horizontal consolidation breakout also seen.
At 21 weekly EMA, it has formed a hammer followed by strong bullish candle.

BSOFT CUP & Handle BreakoutBSOFT has formed a cup & handle format, it tried to breakout 208-210, 52W High with good volume, but at the day end it closed just below breakout level, it has gained 10% intraday basis. opening flat on next trading session will give good positional. it is likely go up for 240-250 levels
In the recent consolidation it has re-tested previous 52W high, which is at 173 level

Kolte Patil Developers Ltd-cup and handle patternKolte Patil Developers shows up trend. The daily chart shows breakout in cup and handle pattern formation. Ascending triangle pattern is also clearly visible which denotes further up move. Target 1 is 226 according to the depth of the cup of cup and handle pattern. Target 2 us 273 which is the target based on ascending triangle. Can go long with a stop loss of 178 and trailing stop loss. Happy investing :)
Note: These charts are for educational and learning purpose only. I am just a beginner. Kindly invest based on your research and analysis.

Eveready Industries-Cup and handle patternEveready Industries shows cup and handle pattern clearly in daily chart. Can go long for up move from here with a stop loss of 150. High volume can also be seen. According to technical analysis, long term targets can be seen around 275. Happy investing :)

ASIANPAINT analysis for this weekNSE:ASIANPAINT
I did this analysis for this week. If it will break 2085, I think it will go till t3. What's your thought?

ITCHI, THIS ITC CHART STUDY IS ONLY FOR EDUCATIONAL PURPOSE. ITC FORMING C&H PATTERN AND ALSO H&S PATTERN...LET'S SEE IS THERE BREAKOUT OR NOT... NO BUY SELL RECOMONDATION

CUP AND HANDLE PATTERN IN EURUSDLOOK FOR EITHER SIDE BREAKOUT
RSI DIVERGENCE SUGGEST SHORTING BUT WAIT FOR REJECTION

Nifty Cup and Handle formation Nifty formed Bullish candle today 19th Jan.
Formed Cup and Handle formation if closes above 11430 we could see nearly 11700 Cup height or even Cup height 11900+ or 12k+. SL as per your risk capacity or 11270
Disclaimer: Do your own study or ask your financial advisors before investing/trading. This analysis can be wrong as well.


3IINFOTECH Cup and handle pattern3IINFOTECH Cup and handle pattern formed in Day Time frame
Buy above 2.95 to CMP 3.25
Stop loss 2.19 below day candle close
Target 4.80
This is education purpose only.

Naukri - Cup & Handle breakout - minimum 10% returnNaukri - Cup & Handle breakout - minimum 10% return

ALKYLAMINE made New Highit has made a new 52W High and also formed a cup & handle pattern. closing above 2000 on daily basis also gives new rally. look at neck line breakout. it will give rally further.

Kotak Mahindra Bank Positional Call Buy Target 1382- 1400Kotak Mahindra Bank Positional Call Buy for a Target of 1382 to 1400. Its Forming a cup and handle pattern and within few trading sessions it will touch 1382 to 1400
