BTCUSD📍 BTCUSD – 1H Key Levels
🔹 Support Zones
$55,200 – $55,500 → Immediate intraday support
$54,500 – $54,800 → Strong support zone, buyers likely to defend here
$53,800 – $54,000 → Major support, breakdown here could trigger deeper correction
🔹 Resistance Zones
$56,800 – $57,000 → Immediate 1H resistance
$57,800 – $58,200 → Strong resistance, breakout can fuel further upside
$59,000 – $59,500 → Major resistance, likely to act as a supply zone
⚖️ Quick Summary
As long as BTCUSD trades above $55,500, short-term bias remains bullish.
Breakout above $57,000 may push price towards $58,200 – $59,500.
Breakdown below $54,800 may drag price back towards $54,000 – $53,800.
Current 1H bias: Range-bound to bullish, waiting for a breakout from $55,500 – $57,000 zone.
Cyrpto

USDJPY 1H📍 USDJPY – 1H
🔹 Support Zones
147.80 – 148.00 → Immediate intraday support
147.30 – 147.50 → Strong support; buyers likely active
146.80 – 147.00 → Major support; breakdown here may extend bearish momentum
🔹 Resistance Zones
148.50 – 148.70 → Immediate intraday resistance
149.00 – 149.20 → Strong resistance; breakout can trigger further rally
149.70 – 150.00 → Major psychological resistance
⚖️ Quick Summary
Bias: Currently range-bound with a bullish tilt as long as price stays above 147.80.
Breakout above 148.70 may open the way towards 149.20 – 150.00.
Breakdown below 147.80 may drag price back to 147.30 – 147.00.
Current watch zone: 147.80 – 148.70.

Part 5 Institutional Trading Types of Options
American vs. European Options
American Options: Can be exercised anytime before expiry.
European Options: Can only be exercised at expiry.
Index Options vs. Stock Options
Stock Options: Based on individual stocks (e.g., Reliance, Infosys).
Index Options: Based on indices (e.g., Nifty, Bank Nifty).
Weekly vs. Monthly Options
Weekly Options: Expire every Thursday (India).
Monthly Options: Expire on the last Thursday of the month.
Key Players in the Options Market
Option Buyers (Holders): Pay premium, have rights.
Option Sellers (Writers): Receive premium, have obligations.
Retail Traders: Use options for speculation or hedging.
Institutions: Use advanced strategies for income or risk management.

Retail Trading vs Institutional Trading👋 Introduction
When we hear the term "trading," we often imagine someone sitting in front of a laptop buying and selling stocks — maybe even like you or me. But not all traders are the same.
There are two major types of traders in the stock market:
Retail Traders – Individual investors like students, salaried professionals, or small business owners.
Institutional Traders – Large organizations like mutual funds, hedge funds, pension funds, foreign investors, and banks.
Both operate in the same market but with very different tools, access, size, and influence.
Let’s break down the major differences between retail and institutional trading in a way that’s easy to understand and helps you think smarter as a trader.
📌 Who is a Retail Trader?
A retail trader is any individual who trades with personal money, not on behalf of others. These are regular people using platforms like Zerodha, Groww, Upstox, Angel One, etc.
Characteristics of Retail Traders:
Trade in small quantities
Use mobile apps or online platforms
Rely on technical indicators, news, social media, or trading courses
Face capital limitations (often under ₹1–5 lakhs or ₹10–20 lakhs for advanced ones)
Emotional decisions often play a bigger role
Impact on stock price is minimal due to small size
📌 Who is an Institutional Trader?
An institutional trader represents large financial institutions. They trade on behalf of clients, funds, or corporations with capital often running into crores or billions of rupees.
Examples:
FII (Foreign Institutional Investors)
DII (Domestic Institutional Investors)
Mutual Fund Houses (SBI MF, HDFC MF, ICICI Pru MF)
Insurance Companies (LIC)
Hedge Funds, Sovereign Funds, Investment Banks
Characteristics:
Trade in very large quantities (thousands to millions of shares)
Have dedicated research teams
Use high-frequency trading (HFT), algorithmic strategies, and block deals
Get priority access to stock allotments (like IPO anchor portions)
Influence stock prices due to their massive capital movements
🧠 How They Trade Differently
🔹 1. Entry Strategy:
Retail Trader: Buys based on chart breakout, news, or gut feeling.
Institutional Trader: Analyzes cash flow, management calls, macro factors, and even global risk.
🔹 2. Position Size:
Retail: Buys 10, 100, or 500 shares.
Institutional: May buy 1,00,000+ shares — sometimes slowly (accumulating) to avoid moving the price.
🔹 3. Holding Period:
Retail: Intraday, swing (few days), or positional.
Institutional: Depends — could be intraday (quant funds), quarterly, or multi-year holdings (pension funds).
🔹 4. Leverage:
Retail: Gets margin from broker, usually limited.
Institutional: Gets much larger and cheaper margin, due to strong balance sheets.
🔥 How Institutions Shape the Market
When a large FII like Vanguard or BlackRock enters or exits a stock, price reacts immediately. For example:
If FIIs buy ₹5000 crore worth of Infosys, it shows strength and attracts more buyers.
If Mutual Funds dump shares of Zomato in bulk, retail may panic and sell too.
So, institutions often act as market movers.
📈 Why Institutional Traders Perform Better (Generally)
They have teams of analysts, economists, risk managers
They avoid emotional mistakes — no panic buying or selling
They use models and simulations
They manage risk per trade very strictly
They get real-time global economic feeds
🙋 Why Do Retail Traders Lose More Often?
Studies show that over 85–90% of retail traders lose money, especially in F&O (Futures and Options). Why?
Lack of discipline – No stop-loss, random trading
Over-trading – Multiple trades a day without edge
Chasing news / tips – Not building conviction
No risk management – Betting all capital in one stock
Emotional trading – Fear & greed override logic
Meanwhile, institutions focus on:
Risk-to-reward
Long-term trends
Diversification
Hedging
Structured research
🛡️ Can Retail Traders Compete?
Yes — with proper knowledge and discipline.
Retail traders have some advantages too:
More flexibility: Can enter and exit faster due to small size
No committee pressure: Don’t answer to bosses or clients
Niche strategies: Can trade small-cap momentum where institutions avoid
Learning access: With internet, any trader can learn smartly today
🏁 Final Words: Use Institutional Moves to Your Advantage
Even if you’re a retail trader, you can follow institutional activity:
Track FII/DII flows daily (available on NSE)
Follow bulk/block deals
Use tools like Trendlyne, Screener, Moneycontrol to see where funds are buying/selling
Use this information to align your trades with "smart money", and avoid standing against institutional trends.
Master Institutional Trading🎯 Master Institutional Trading
Master Institutional Trading means learning to trade like the top financial institutions – with precision, strategy, and data-driven decisions. It’s the highest level of trading where you think and act like banks 🏦, hedge funds 📊, and investment firms 💼.
This mastery involves:
🔍 Understanding how smart money moves
📈 Analyzing volume, liquidity zones, and order flow
💹 Executing large trades without impacting the market
🛡️ Applying risk-controlled option & futures strategies
🧠 Using advanced tools, indicators, and market depth
🔄 Adapting to news, events, and institutional triggers
To master this skill, traders must develop:
📊 Strong technical + fundamental analysis
🧘 Discipline and emotion control
🧾 A solid, backtested trading system
💬 Knowledge of macroeconomic impacts
🧮 Command over greeks, derivatives, and hedging
📌 In simple words:
Mastering Institutional Trading means stepping into the shoes of the pros – learning how the big money operates, and trading with structure, edge, and confidence.

Trading Master Class With Experts🎓 Trading Master Class With Experts
The Trading Master Class With Experts is a premium learning experience designed to take your trading skills to the next level by learning directly from market professionals – traders who’ve been in the game, seen the cycles, and built real strategies that work. 💼📈
In this expert-led masterclass, you will:
📊 Learn From Real Market Experts
🧠 Gain insights from institutional traders, analysts, and full-time professionals
🔍 Watch live trading sessions, analysis, and decision-making
🎯 Understand the logic behind high-probability trades
🔄 See how pros adapt to changing markets in real time
🔧 Master Advanced Trading Skills
📉 Deep dive into technical and fundamental analysis
💹 Learn options, futures, and multi-asset strategies
📍 Build a risk-managed trading system from scratch
⚙️ Use institutional tools: order flow, volume profiles, and price action
🛡️ Get Mentorship & Community
👥 Join a private trading community
💬 Get answers in live Q&A sessions
📈 Share progress, refine skills, and grow with a pro network
📌 In simple words:
The Trading Master Class With Experts is where serious traders learn the real rules of the game — directly from those who play it at the highest level.

Institutional Intraday option Trading🔶 What is Institutional Intraday Options Trading?
Institutional Intraday Options Trading is how big players (institutions) like hedge funds, proprietary trading firms, mutual funds, foreign institutional investors (FIIs), and domestic institutional investors (DIIs) actively trade in options markets within the same day to generate quick profits, manage large positions, or manipulate price movements in their favor.
Unlike retail intraday trading (which is usually based on tips, indicators, or scalping), institutional intraday options trading is based on:
Advanced option data (like OI, volume, IV)
Market structure and liquidity
Algo-based executions
Risk-adjusted strategies and fast decision making
Institutions don’t trade for fun or luck—they trade with purpose, plan, and size. Their presence in the market creates price movements, and learning to track their footprints gives retail traders a powerful edge.
🔶 Why Institutions Trade Options Intraday?
Institutions prefer intraday option trading because it allows them to:
✅ Manage Risk & Hedge Positions
Institutions often hold large equity/futures positions. Options allow them to hedge intraday volatility without disturbing their long-term positions.
✅ Scalp Based on Volatility and News
Events like RBI policy, Fed data, results, or global news create fast-moving markets. Institutions use intraday options to take advantage of volatility spikes.
✅ Generate Quick Alpha
Institutional traders are expected to generate consistent returns. Intraday option trades provide high leverage and faster capital rotation.
✅ Exploit Liquidity and Traps
Institutions use fake breakouts, premium decays, and short-covering rallies to trap retailers and make profit intraday.
📌 1. Premium Decay Strategy (Theta Game)
Objective: Sell options when implied volatility is high.
Institutions sell both call and put options (straddle or strangle) around key zones (like CPR, VWAP).
They collect premium and profit from time decay as long as the market stays in range.
✅ Works well in sideways markets (common post-gap days or after big moves).
🎯 Focus: Short Straddle / Short Strangle near key levels
📌 2. Directional Option Buying (with Risk Control)
Objective: Ride fast moves using OTM options
Institutions buy deep OTM options when they expect sudden movement due to:
Breakout + OI unwinding
Short covering rally
News trigger or liquidity sweep
But they:
Use tight stop-loss, and
Enter near liquidity zone, not after the breakout
🎯 Focus: Volume + OI Shift + IV Expansion
📌 3. Scalping with Delta-Neutral Strategies
Objective: Profit from small intraday movements without market direction bias.
Example:
Sell ATM Call + Buy slightly OTM Call (Call Ratio Backspread)
Profit when price breaks in either direction and IV increases
🎯 Focus: Neutral strategy + quick reaction to movement
📌 4. Trap and Reverse (Liquidity Play)
Objective: Trap retailers near breakout/fakeout and reverse
Steps:
Identify large open interest buildup at a strike.
Price spikes above that level and then quickly reverses.
Institutions initiate the opposite side—profit from panic exits.
🎯 Focus: Option chain + sudden volume spike + reversal candle
📌 5. Hedged Position for Intraday Spike
Example Setup:
Buy Nifty 22500 CE + Sell 22700 CE
Risk defined, cheap entry, and profits from quick momentum.
Used during:
Event days
News expectations
VIX spikes
🎯 Focus: Defined risk with high reward if breakout happens
🔶 Institutional Footprints in Options
Here’s how to detect institutional presence:
✅ Sudden spike in option volume without news
✅ Aggressive unwinding near key levels
✅ High IV in far OTM options (possible trap)
✅ Large quantity buying/selling in illiquid strikes
✅ Price rejecting exact levels (like round numbers, day high/low)
🔶 Real Example of Institutional Intraday Option Play
Let’s say it’s Thursday (weekly expiry). Nifty is at 22500.
Retailers:
Start buying 22500CE, expecting a breakout.
Institutions:
Let price go up to 22540, triggering all CE entries.
Institutions sell huge lots of 22500CE with rising OI.
Nifty reverses to 22460. CE premium crashes.
Result:
Retailers lose.
Institutions profit via option writing and liquidity sweep.
🔶 How to Learn and Master Institutional Intraday Option Trading?
Step-by-step roadmap:
✅ Learn Option Chain Reading
Focus on OI shifts, strike buildup, and PCR.
✅ Understand Option Greeks
Especially Delta, Gamma, Theta, and Vega.
✅ Master Market Structure
Use price action, VWAP, volume profile, CPR.
✅ Practice Institutional Patterns
Liquidity grabs, stop hunts, traps, and reversals.
✅ Use TradingView or platforms like Sensibull, QuantsApp
For live data, OI heatmap, option analytics.
✅ Backtest with Replay Mode
See how institutions played in past events.
🔶 Bonus Tips for Retailers to Follow Institutional Moves
🧠 Always ask:
Who is trapped right now—buyers or sellers?
Is this a genuine breakout or just a liquidity grab?
What is option chain telling me?
🚫 Avoid:
Blind call/put buying without OI confirmation
Buying high IV options post move
Selling naked options in low capital

Advance Option Trading🔶 What Is Advanced Options Trading?
Advanced Options Trading goes beyond buying and selling simple Calls and Puts. It’s about using multi-leg strategies, managing risk with precision, applying greeks and volatility, and aligning your trades with market conditions.
Advanced traders treat options like a math-based chess game. They don’t gamble—they strategize, hedge, spread, and use data-driven decisions to extract profits in all kinds of markets (bullish, bearish, sideways, volatile, calm).
🔍 Why Learn Advanced Options Trading?
While beginners just "buy options" hoping for a quick profit, advanced traders use options to:
Control risk
Earn consistent income
Capitalize on volatility
Trade sideways or range-bound markets
Create hedges for portfolios
Use smart capital deployment with defined risk
2️⃣ Implied Volatility (IV)
IV tells you how expensive or cheap options are.
📈 High IV = Options are expensive → Ideal for selling
📉 Low IV = Options are cheap → Ideal for buying
Advanced traders use:
IV Rank / IV Percentile
Volatility skew analysis
Volatility crush trades around earnings or events
3️⃣ Option Strategies
Here’s where real skills come in. Advanced trading uses multi-leg strategies to limit loss, increase odds, or make money in non-directional moves.
🔍 Strategy Example: Iron Condor
Sell 22000 CE
Sell 21800 PE
Buy 22100 CE (hedge)
Buy 21700 PE (hedge)
You’ll profit if the index stays between 21800 and 22000, and time decay works in your favor.
✅ Defined risk
✅ Limited profit
✅ Great for expiry week if market is range-bound
💹 Advanced Techniques for Smart Trading
Let’s now explore how pros operate:
🔸 A. Delta-Neutral Trading
Institutional or advanced traders often create delta-neutral positions—no directional bias.
Example:
Buy Call option (Delta +50)
Sell Put option (Delta -50)
Net Delta = 0 → Neutral. The position doesn’t care which way market moves—only volatility or time decay matters.
🔸 B. Hedging with Options
Advanced traders hedge their stock or futures positions using options.
Example:
You hold ₹5 lakh worth of Reliance shares
You buy Reliance PUT options to protect downside risk
Result? You keep profits if stock goes up and protect capital if it drops. It's like insurance.
🔸 C. Trading Earnings or Events
Options let you trade volatility, not just direction. Ahead of events like:
Earnings reports
RBI or Fed meetings
Budget announcements
You can use:
Straddles / Strangles (if expecting big move)
Iron Condors (if expecting no major move)
Calendar spreads (to exploit IV difference)
🔸 D. IV Crush Strategy
Before major events, IV rises. After the event, IV drops (called IV crush).
Advanced traders:
Sell options before events (high premium)
Buy options after IV crash (cheap premium)
They know when NOT to buy options just before news—because premium is inflated!
🔸 E. Adjusting Trades
Advanced traders don’t just “hope” for success. If a trade goes wrong, they adjust it:
Roll to a new strike
Convert from debit to credit spreads
Hedge with opposite positions
Manage Delta/Theta/Vega exposure
This proactive style protects capital and increases recovery chances.
🛠️ Tools Used by Advanced Option Traders
Opstra / Sensibull – Strategy builder, Greek analyzer
TradingView – Charting & technical levels
OI Analysis Platforms – For understanding institutional footprints
Python / Excel – Custom backtesting tools
Algo Platforms – For speed and logic-based execution
📌 Important Rules for Advanced Option Traders
Don't chase trades. Let trades come to you.
Always define risk before entering.
Use multi-leg setups, not naked options unless there's an edge.
Stay Theta positive in low volatility markets.
Only buy options when IV is low and breakout is expected.
✅ Final Thoughts
Advanced options trading is a skillset—not a shortcut.
If you:
Want consistent profits
Wish to trade like institutions
Hate gambling and want a plan
Love logic, numbers, and control
…then advanced option trading is your next big step.
It gives you the tools to win in all market types, not just trending ones.

Technical Class🧠 Why Learn Technical Analysis?
Because price is king.
All news, fundamentals, and economic data are already reflected in price. Technical analysis teaches you how to read price charts and anticipate movements—giving you the timing advantage.
Institutions, traders, and even algorithms rely heavily on technical levels. So if you want to:
Know when to enter/exit
Understand where big money is active
Manage risk smartly
Improve accuracy
…you need strong technical skills.
🔍 What Will a Good Technical Class Cover?
Let’s break this into 10 structured modules, explained in human-friendly language.
📘 1. Basics of Price Action
What is a chart? (Line, Bar, Candlestick)
Understanding OHLC (Open, High, Low, Close)
Why price is the most important factor
How price creates support, resistance, and trends
👉 Outcome: You’ll read any chart confidently.
📘 2. Candlestick Patterns
Single candlesticks: Doji, Hammer, Engulfing, Marubozu
Dual & triple candle patterns: Morning Star, Evening Star, Three Soldiers
Reversal vs Continuation patterns
👉 Outcome: You’ll know how to identify potential trend reversals or strength.
📘 3. Chart Patterns (Price Structures)
Reversal Patterns: Double Top/Bottom, Head and Shoulders
Continuation Patterns: Triangles, Flags, Pennants, Rectangles
Understanding Breakouts vs Fakeouts
👉 Outcome: You’ll recognize market structures and act before the move begins.
📘 4. Support and Resistance Mastery
How to identify major support/resistance levels
Role of historical price zones
Dynamic support/resistance using moving averages
Price reaction techniques
👉 Outcome: You’ll place entries and exits at the most strategic levels.
📘 5. Trend Analysis
What is a trend? (Uptrend, Downtrend, Sideways)
How to draw trendlines correctly
Role of higher highs & lower lows
Using Multiple Timeframe Analysis
👉 Outcome: You'll align trades with major trends like professionals do.
📘 6. Indicators & Oscillators
Moving Averages (SMA, EMA): Trend confirmation
RSI: Overbought/Oversold signals
MACD: Momentum and divergence detection
Bollinger Bands: Volatility breakout
Volume Profile / VWAP
👉 Outcome: You’ll combine indicators for confluence and higher accuracy.
📘 7. Intraday Technicals
Best indicators for intraday (VWAP, Supertrend)
Time-based chart usage (5m, 15m, 1hr)
Institutional trap zones (fakeouts, liquidity sweeps)
Scalping vs momentum setups
👉 Outcome: You’ll confidently take trades within the day using fast setups.
📘 8. Risk Management and Trade Psychology
Position sizing
Risk-Reward ratio planning
Importance of Stop Loss
Emotional control: Fear, Greed, Impatience
Creating a rule-based system
👉 Outcome: You’ll trade stress-free, without blowing up your capital.
📘 9. Advanced Institutional Concepts
Smart Money Concepts (SMC): Liquidity, Order Blocks, BOS/CHOCH
Institutional Order Flow: Where big money trades
Volume Spread Analysis
Wyckoff Theory (Accumulation/Distribution phases)
👉 Outcome: You’ll learn how institutions move the markets and how to follow them.
📘 10. Strategy Building and Backtesting
Creating rule-based strategies
Journaling trades and analyzing results
Backtesting on historical data
Live market application with confidence
👉 Outcome: You’ll develop your own strategy and remove guesswork.

Advanced Option StrategiesWhat are Options?
Before we dive into advanced stuff, here’s a quick refresher.
An Option is a contract that gives you the right (but not the obligation) to buy or sell a stock/index at a certain price, on or before a certain date.
There are 2 types:
Call Option – Right to BUY
Put Option – Right to SELL
Buyers pay a premium. Sellers receive a premium and take on the obligation.
💼 Why Use Advanced Strategies?
If you only buy calls or puts, you might:
Lose 100% of your capital quickly
Get the direction right, but still lose due to time decay
Suffer from high premiums or volatility crush (IV crush)
Advanced strategies help you:
✅ Reduce risk
✅ Lock-in profits
✅ Earn from sideways markets
✅ Trade during high volatility events
✅ Create income strategies
🧠 1. Bull Call Spread – Directional but Risk-Defined
Used when: You’re moderately bullish, but don’t want to spend too much on a call.
How it works:
Buy 1 ATM Call
Sell 1 higher strike OTM Call
Example:
Nifty at 22000
Buy 22000 CE @ ₹100
Sell 22200 CE @ ₹40
Net Cost = ₹60
Max Profit: ₹200 (22200–22000) – ₹60 = ₹140
Max Loss: ₹60 (net premium paid)
👉 This strategy caps your risk and reward but is cost-efficient and smart in range-bound bull moves.
🧠 2. Bear Put Spread – Controlled Downside Betting
Used when: You’re mildly bearish and want to control losses.
How it works:
Buy 1 ATM Put
Sell 1 lower strike Put
Example:
BankNifty at 48500
Buy 48500 PE @ ₹120
Sell 48000 PE @ ₹60
Net Cost = ₹60
Max Profit: ₹500 – ₹60 = ₹440
Max Loss: ₹60
👉 Ideal for limited downside moves — cheaper than naked Put.
🧠 3. Iron Condor – The Sideways Market King
Used when: Market is flat or expected to stay in a range.
How it works:
Sell 1 OTM Call + Buy 1 higher OTM Call
Sell 1 OTM Put + Buy 1 lower OTM Put
You make money if market stays between the 2 sell strikes.
Example:
Nifty is at 22500
Sell 22800 CE, Buy 23000 CE
Sell 22200 PE, Buy 22000 PE
👉 You collect premiums from both sides.
Max Profit = Net Premium
Max Loss = Difference between strikes – Net Premium
👉 Works great in expiry week or low-volatility phases.
🧠 4. Straddle – Big Move Expected, Direction Unknown
Used when: A major move is expected (news, event, earnings), but unsure about direction.
How it works:
Buy ATM Call and ATM Put of the same strike & expiry.
Example:
Stock at ₹500
Buy 500 CE @ ₹20
Buy 500 PE @ ₹25
Total Cost = ₹45
If stock moves big — say ₹60 or more either way — you profit.
👉 High risk due to premium decay if market stays flat.
Need volatility to spike.
🧠 5. Strangle – Cheaper than Straddle, Wider Range
Used when: You expect a big move but want lower cost than a straddle.
How it works:
Buy OTM Call and OTM Put (strikes wider apart than ATM).
Example:
Nifty at 22500
Buy 22800 CE @ ₹12
Buy 22200 PE @ ₹10
Total Cost = ₹22
You profit if the move crosses either strike + premium.
👉 Needs bigger move than straddle but less premium at risk.
🧠 6. Calendar Spread – Play with Time
Used when: You expect price to stay near a level short term, but may move later.
How it works:
Sell near-term option
Buy far-term option (same strike)
Example:
Sell 22500 CE (weekly) @ ₹50
Buy 22500 CE (monthly) @ ₹70
Net Cost = ₹20
👉 You make money if price stays near 22500 by expiry of short leg.
Profits from time decay of the short leg.
🧠 7. Ratio Spreads – Advanced Directional with a Twist
Used when: You expect a move in one direction, but want to reduce cost.
Bull Call Ratio Spread
Buy 1 lower Call
Sell 2 higher Calls
Example:
Buy 22000 CE @ ₹100
Sell 2× 22200 CE @ ₹60 each
Net Credit = ₹20
If market moves moderately up — you profit.
But if it rises too fast — risk increases.
👉 Suitable for experienced traders only — manage risk carefully.
🧠 8. Covered Call – Income Strategy for Investors
Used when: You hold stocks and want to earn extra income.
How it works:
Hold 100 shares of a stock
Sell 1 OTM Call
Example:
You own 100 shares of Reliance @ ₹2500
Sell 2600 CE @ ₹20
If Reliance stays below ₹2600, you keep the premium.
If it rises above ₹2600, your shares get sold, but you still profit.
👉 Perfect for long-term investors.
🧠 9. Protective Put – Insurance for Your Stock
Used when: You own shares but want downside protection.
How it works:
Hold stock
Buy 1 ATM/OTM Put
Example:
Own Infosys @ ₹1500
Buy 1480 PE @ ₹20
If stock falls below ₹1480, your loss is capped.
👉 It’s like buying insurance for your portfolio.
🧠 10. Butterfly Spread – Range-Bound Precision Strategy
Used when: You expect minimal movement and want low-risk, high-RR trade.
How it works (Call Butterfly):
Buy 1 lower strike Call
Sell 2 middle strike Calls
Buy 1 higher strike Call
Example:
Buy 22000 CE
Sell 2× 22200 CE
Buy 22400 CE
You earn if market expires at the middle strike.
Max loss = Net debit
Max profit = At middle strike
👉 Best for expiry day premium decay strategies.
Common Mistakes to Avoid
Not understanding strategy risk
Using high-margin strategies without protection
Overtrading in expiry week
Not adjusting trades as market moves
Ignoring volatility impact (IV crush)
🛠 Tools to Use
Option Chain (for strike selection)
IV (Implied Volatility) data
Open Interest (OI)
Strategy Builder platforms (e.g. Sensibull, Opstra, or TradingView)
🎯 Final Thoughts
Advanced options trading isn’t gambling — it’s about smart risk management.
These strategies:
Give you control
Limit losses
Provide flexibility across different market types
BTCUSD 1D Timeframe✅ Current Market Data
Current Price: ~$118,420 USD
Day’s High: ~$119,210
Day’s Low: ~$117,428
Previous Close: ~$118,004
Change Today: +$416 (around +0.35%)
📈 Price Behavior Today
Bitcoin is showing range-bound movement between $117K and $119K after a strong rally in the past few days.
The current price action suggests market indecision, with neither bulls nor bears taking clear control.
Momentum indicators are neutral, with RSI hovering around 52–55, indicating sideways consolidation.
🧠 Key Drivers Behind Price Action
Profit Booking: After recent rallies above $120K, traders are taking profits, keeping the price in check.
Strong Institutional Demand: ETFs and institutional buying continue to offer long-term support to Bitcoin.
Favorable Crypto Regulations: Recent developments in U.S. crypto policies are boosting confidence in Bitcoin as a store of value.
On-Chain Strength: Network health (hash rate, wallet activity, HODL behavior) remains strong, signaling long-term bullishness.
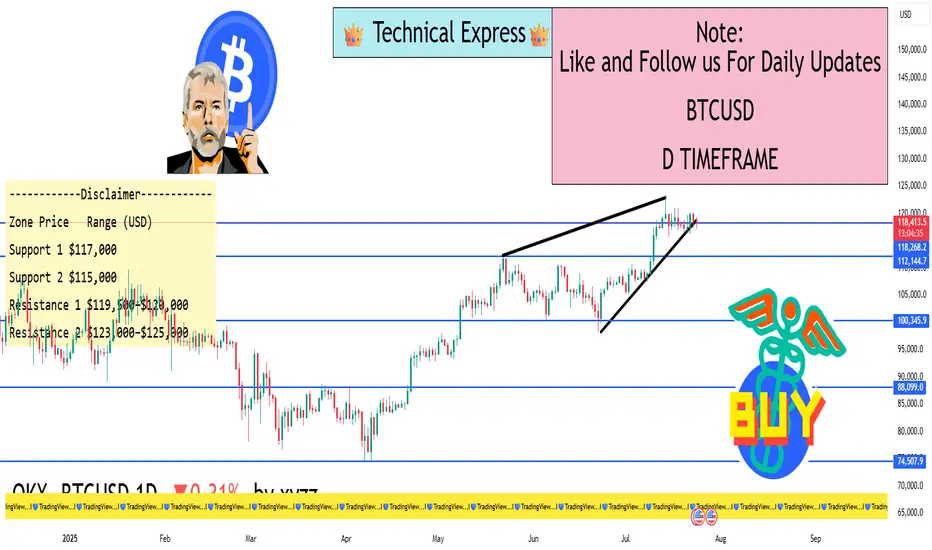
🔍 Technical Levels to Watch
Zone Price Range (USD)
Support 1 $117,000
Support 2 $115,000
Resistance 1 $119,500–$120,000
Resistance 2 $123,000–$125,000
A close above $120K could initiate a bullish breakout targeting $125K–$130K.
A fall below $117K may invite a deeper pullback toward $115K or even $111K in the short term.
🔄 Market Sentiment
Neutral-to-Bullish in the short term.
Strong Bullish in the long-term due to adoption, policy support, and demand.
Investors are cautiously optimistic, awaiting stronger volume and breakout confirmation.
🎯 Outlook Ahead
Short-Term View: Consolidation between $117K–$120K likely to continue unless a strong volume breakout occurs.
Medium-Term View: A confirmed move above $120K may push BTC toward new highs of $130K–$138K.
Risk Zone: If Bitcoin fails to hold $115K, it could enter a corrective phase down to $111K.
✅ Summary
Bitcoin is currently in a sideways consolidation phase, with strong support around $117K and resistance just below $120K. The broader outlook remains positive, but the market is waiting for a fresh trigger—either a breakout above $120K or a breakdown below $115K—for the next decisive move.
SENSEX 1D Timeframe✅ Key Index Data:
Current Level: ~82,200 (as of early afternoon)
Opening: Around 82,780
Day’s High: 82,784
Day’s Low: 82,047
Previous Close: 82,726
Intraday Change: Down ~520 points (–0.63%)
🔍 Market Behavior (1-Day Time Frame)
Opening Session: The Sensex opened flat but slightly negative, quickly slipping below 82,600 as traders booked profits from recent highs.
Mid-Morning Session: The index continued to slide, breaching key support levels near 82,200–82,100.
Support Zone Tested: Sensex touched a low of around 82,047 before bouncing slightly.
Volatility: The index remained volatile due to global weakness and profit-booking in large-cap stocks.
🧠 Technical Insight (1-Day Chart Perspective)
Level Type Range (approx.)
Resistance 82,700 – 82,800
Support 82,000 – 82,050
Trend Bias Weak / Bearish
RSI (1D est.) Around 45–50 (neutral-to-weak zone)
Market Mood Cautious to bearish
📉 What’s Causing the Decline Today?
Weak IT and Banking Stocks: Both sectors are under pressure due to poor Q1 guidance and weak global cues.
Profit Booking: Investors are trimming positions after recent highs, leading to broad-based selling.
Global Uncertainty: Mixed international signals and concerns over trade policies are affecting sentiment.
Lack of Strong Domestic Triggers: No major positive domestic news to support buying.
🎯 What to Watch Next
Short-Term Trend: Watch if Sensex can hold above 82,000. If broken, more downside toward 81,800–81,500 is possible.
Upside Resistance: If recovery comes, resistance will be strong near 82,700–82,800.
Sector Focus: Banks, IT, and auto are likely to drive further movement.

Trading Master Class With Experts🎯 Objective of the Master Class
To turn intermediate or beginner traders into independent, high-probability traders.
To teach institutional strategies, advanced technical analysis, and options trading mechanics in a structured manner.
To prepare you to read price action, understand market psychology, and act with professional-level discipline.
🧑🏫 Who Are the Experts?
The instructors in a true master class are:
Institutional Traders
Full-time Professional Derivatives Traders
Algo Strategists
Portfolio Managers
Ex-Prop Desk Heads or FIIs Participants
These experts bring real P&L experience, not just theoretical certifications. They share their actual setups, mental models, risk frameworks, and do’s and don’ts from years of screen time.
📦 What You Will Learn – Detailed Modules
Module 1: Market Structure Mastery
Institutional order flow
Supply-demand vs. retail S/R
Liquidity traps and smart money movement
Module 2: Price Action + Volume Profiling
Multi-timeframe analysis
Candle psychology + Volume interpretation
How institutions "hide" their entries
Module 3: Advanced Options Trading
Intraday & positional strategies
Greeks mastery: Delta, Vega, Theta, Gamma
Hedging tactics used by professionals
Nifty & Bank Nifty strategy building
Module 4: Institutional Strategy Replication
Intraday straddle/strangle writing
IV crush exploitation during events
Option chain decoding for retail edge
Module 5: Trade Management & Psychology
Risk per trade, max drawdown, win/loss ratio
Building discipline like a hedge fund
Overcoming emotional sabotage in trading
Module 6: Live Market Sessions
Daily planning with expert insights
Live trades with explanation
Review of success/failure transparently
⚙️ Tools & Platforms You’ll Use
Option Chain Analyzers (like Sensibull, Opstra, or Greek tools)
TradingView & charting setup with expert templates
Journaling tools (Edgewonk, Notion)
Algo tools (optional module)
🧩 Who Should Join?
✅ Aspiring Traders (with some basic knowledge)
✅ Traders struggling with consistency
✅ Intraday or options traders wanting a structured framework
✅ Professionals looking to shift to full-time trading
✅ Students of finance or markets seeking practical skills
🏆 Key Benefits
Real strategies shared by real traders
Mentorship: Learn not just from books, but from mistakes and success of mentors
Live sessions to build confidence under pressure
Lifetime recording access in most premium programs
Community access for continuous growth & trade sharing
💼 Career & Income Impact
After attending this masterclass, traders often:
Gain clarity on their trading edge
Improve win-rate and risk-adjusted returns
Start coaching others or creating communities
Join or create proprietary trading setups
📅 Duration & Format
Duration: 1 Week to 6 Weeks (varies by provider)
Format: Live Zoom + Recorded + Assignments
Support: Telegram/Slack group, weekly Q&A, live trading calls
🔚 Final Thoughts
The “Trading Master Class with Experts” is not just another online program. It's a live, applied, market-tested mentorship where real experts guide you step-by-step in mastering trading psychology, strategy, and discipline.
If you're serious about scaling your trading journey, this is the fastest shortcut to reach professional-level execution and understanding.

Technical Class🎯 What is a “Technical Class”?
A Technical Class is a structured learning session or course designed to teach technical analysis – the skill of forecasting price movement in financial markets based on charts, price patterns, indicators, volume, and historical data.
It’s one of the most essential skillsets for traders and investors, especially those involved in stock trading, intraday trading, swing trading, options, forex, or crypto.
📘 Purpose of a Technical Class
The main goal of a technical class is to train participants to:
Read and analyze price charts confidently
Use indicators and tools to generate buy/sell signals
Recognize institutional footprints and volume patterns
Make independent, logic-based trading decisions
Avoid emotional or speculative trades
🧱 What Topics Are Covered in a Technical Class?
✅ 1. Chart Reading Basics
Candlestick types (Doji, Hammer, Engulfing, Marubozu)
Price vs. Volume relationship
Support & Resistance levels
Timeframes: Intraday (5m/15m), Positional (1D/1W)
✅ 2. Price Action Trading
Trend structure: HH-HL / LH-LL sequences
Breakouts & Fakeouts
Supply-Demand zones
Liquidity traps
✅ 3. Technical Indicators
Trend Indicators: Moving Averages (SMA/EMA), MACD
Momentum Indicators: RSI, Stochastic, CCI
Volume Indicators: VWAP, OBV, Volume Profile
Volatility Indicators: Bollinger Bands, ATR
✅ 4. Chart Patterns
Continuation Patterns: Flags, Pennants, Triangles
Reversal Patterns: Head & Shoulders, Double Top/Bottom, Wedges
Range Patterns: Rectangles, Channels
✅ 5. Support & Resistance Mastery
Dynamic (Moving averages, trendlines)
Static (Horizontal S/R, Round numbers)
Institutional S/R zones with Volume & OI
✅ 6. Trend Analysis
Identifying Bullish, Bearish, and Sideways markets
Role of Volume in confirming trends
Using Dow Theory and Market Structure
✅ 7. Advanced Concepts
Divergence (Price vs. RSI/MACD)
Multi-Timeframe Analysis (MTA)
Fibonacci Retracement & Extensions
Chart psychology (why price behaves irrationally)
🧠 Skills You Gain from a Technical Class
How to time entries and exits based on confirmation
How to avoid false breakouts
When to use indicators and when to trust price action
How to combine volume + price for high-probability setups
How to align with smart money and institutional footprints
🎓 Who Should Attend a Technical Class?
✅ New traders wanting a strong foundation
✅ Intraday and swing traders aiming for consistency
✅ Investors looking to time entry/exit better
✅ Option traders who want to read chart behavior
✅ Crypto/forex traders who rely on pure price movement
📈 Real-World Applications
Identify trend reversals before they happen
Spot breakouts with volume confirmation
Align trades with institutional positioning
Reduce overtrading and increase accuracy
Make data-backed decisions, not emotional guesses
⚠️ Common Mistakes Covered in a Technical Class
❌ Overuse of indicators (indicator overload)
❌ Trading without stop-loss
❌ Misreading breakouts and breakdowns
❌ Ignoring volume and confirmation
❌ Lack of patience or plan in trade execution
🔚 Final Thoughts
A Technical Class is more than just learning chart patterns — it’s about understanding how the market thinks, how price reacts, and how you can trade in sync with logic, not emotion.
Whether you're into stocks, futures, options, or crypto — a strong technical foundation increases your edge, reduces losses, and boosts confidence.

Macro + Rate-Sensitive Asset Trading✅ What is Macro + Rate-Sensitive Asset Trading?
In basic terms:
Macro Trading is trading based on big picture economic trends — like inflation, interest rates, GDP growth, central bank policies, and geopolitical risks.
Rate-Sensitive Asset Trading focuses on those assets that react strongly when interest rates change, like:
Government bonds
Bank stocks
Real estate investment trusts (REITs)
Gold
Growth tech stocks
Commodities
Currency pairs (like USD/INR, EUR/USD)
Together, macro and rate-sensitive asset trading means analyzing global and national economic data to predict movements in specific assets and sectors.
🧠 Why is This So Important?
Because big players (FII, DII, Hedge Funds) move billions of dollars based on these macro themes.
Imagine this:
If inflation spikes → Central bank may raise interest rates
If rates go up → Bond yields rise → Bank profits rise
At the same time → Real estate slows down, gold may fall, tech stocks may suffer
And the currency (like USD or INR) may strengthen or weaken
As a trader, understanding these domino effects lets you ride big, high-conviction trades that can last for days, weeks, or even months.
🏛️ Who Controls Interest Rates?
Central banks — like the Federal Reserve (USA) or RBI (India) — adjust interest rates to control inflation and support economic growth.
Rate Hike = Borrowing becomes expensive = Slows the economy
Rate Cut = Borrowing becomes cheaper = Boosts growth
Market participants react even to expectations of these changes.
So, successful traders often read between the lines of central bank speeches, economic releases, and policy statements.
🧮 Examples of Rate-Sensitive Assets
Let’s break them down one by one:
1. Banking Stocks (HDFC Bank, ICICI Bank, SBI, Axis)
Banks make more profit when interest rates are high.
They charge more on loans and earn better margins.
So, when the RBI hikes rates, banking stocks usually go up.
📈 Trade Idea: Buy banking stocks on rate hike expectations, especially when inflation is rising.
2. Bonds and Bond Yields
Bond prices move inversely to interest rates.
When rates go up, bond prices go down, and yields go up.
Traders use this to position in debt instruments or short-duration bonds.
📉 Trade Idea: Short long-duration bonds when interest rates are expected to rise.
3. Gold and Silver
Gold is a non-interest-bearing asset.
When rates rise, bonds become more attractive → People shift from gold to fixed income → Gold falls
But during high inflation or crisis, gold can also rise as a hedge.
⚖️ Trade Idea: If real interest rates (adjusted for inflation) rise → Sell gold. If inflation is rising faster than rates → Buy gold.
4. Tech and Growth Stocks (Rate-Sensitive Equities)
High-growth companies (like tech startups or innovation companies) often rely on borrowing.
Rising interest rates increase their cost of capital.
This can compress future profits, and stock prices fall.
📉 Trade Idea: Avoid high-P/E or growth stocks during rising rate cycles. Favor value or dividend-paying stocks.
5. Real Estate / REITs
Real estate is interest-rate sensitive because home loans, EMIs, and mortgages get costlier.
When rates rise, property demand slows, and REITs (real estate investment trusts) fall.
📉 Trade Idea: Short REITs or reduce allocation during rate hike cycles.
6. Currency Pairs (Forex)
When a country hikes rates, its currency becomes stronger because it offers better returns to foreign investors.
For example, if the US Fed raises rates, the USD strengthens against INR, EUR, JPY, etc.
📈 Trade Idea: Go long on USD/INR or USD/JPY when Fed is expected to hike.
📌 How Traders Use This Information (Practical Steps)
Step 1: Develop a Macro View
Ask: Is the global economy growing or slowing?
Is inflation rising or under control?
What are central banks signaling?
Step 2: Find Asset Classes That React
If inflation rising → Buy banks, sell bonds and gold
If growth slowing → Buy bonds, sell cyclicals, maybe gold
Step 3: Time Your Entry with Technicals
Use charts (e.g., TradingView) to find good levels to enter.
Look for breakout or pullback entries.
Step 4: Manage Risk
Macro trades can move fast and big.
Always use stop losses and size your position smartly.
🧠 Pro Tips From Institutional Traders
Macro moves are slow but deep.
These trades often play out over days or weeks. Be patient.
Market moves on expectations, not news.
Price reacts before the news comes out. Get in early.
Central banks don’t always do what they say.
Learn to interpret tone, not just statements.
Watch global flows.
US rate hikes can affect Indian markets. Always zoom out.
Be aware of cycles.
Every asset class has cycles. Learn when each one outperforms.
⚠️ Risks of Macro and Rate-Sensitive Trading
Data surprises can flip the market instantly
Correlations can break (e.g., gold going up with rates)
Over-trading on news can lead to losses
Requires understanding of multiple asset classes
Long holding periods may tie up capital
📈 Real-Life Example: RBI Hike Cycle in India
Let’s say inflation in India is rising fast — food prices, fuel, etc.
RBI responds by:
Raising repo rates from 6.5% to 7.0%
Goal: Slow down spending and borrowing
What happens?
Banks rally → Nifty Bank goes up
Bonds fall → 10-year yield rises
Real estate cools off
Gold weakens if INR strengthens
Tech stocks underperform
A smart trader could:
Go long on Bank Nifty Futures
Short REITs or real estate stocks
Exit tech or auto sector temporarily
This is a textbook example of macro + rate-sensitive trading in action.
📚 Final Thoughts: Is This For You?
Macro trading with rate-sensitive assets is not for absolute beginners, but it is a powerful approach for intermediate and advanced traders.
✅ Advantages:
Big moves with logic behind them
Insight into how institutions think
Ability to diversify across assets
BTCUSD 1D TIMEFRAME🔍 What's Driving Bitcoin Today
Institutional Adoption Increasing
Major financial institutions — hedge funds, asset managers, corporate treasuries — are heavily investing in Bitcoin. Dedicated crypto prime brokers are stepping up to serve these clients, signaling a growing institutional footprint.
Stable Institutional Holdings
While Bitcoin has touched record highs, recent dips reflect profit-taking rather than panic. That’s healthy consolidation, not a crash.
Regulatory Tailwinds in the U.S.
New laws (like the “Genius” and “Clarity” Acts) are clarifying the status of stablecoins and digital assets, boosting confidence. Political support from the current administration has incentivized institutional participation and even the creation of a national Bitcoin reserve.
Technical Patterns Suggesting Continuation
Bitcoin appears to be forming a bullish flag or pennant consolidation near the $118K–$120K level — suggesting a likely continuation toward $140K–$250K, depending on momentum and catalysts.
🧭 Market Outlook
Short-Term: Slight consolidation or mild pullback (common after sharp rallies). Key support zones are $115K–$118K. A bounce here may drive prices back toward $120K–$123K.
Mid-Term: If bulls hold momentum and institutional inflows persist, the next major upside targets are in the $140K–$200K range.
Long-Term: With long-term models and institutional forecasts in play, targets stretch as high as $250K by year-end, and some ultra-bullish scenarios envision even $500K+ over a longer time horizon.
⚠️ Key Risks to Watch
Breakdowns below $115K could trigger a deeper correction toward $112K–$110K.
Volatility spikes may occur if macroeconomic factors shift, even as regulatory clarity improves.
Caution from macro critics: Some thought leaders warn of bubble-like conditions, advising risk management.
✅ Summary
Bitcoin remains in a strong bull phase. Today's dip is healthy consolidation after reaching all-time highs. Key support sits between $115K–$118K. A sustained bounce from here could drive a move to $120K–$140K, potentially even higher if institutional flows stay strong. However, a breakdown below that support zone would flip the outlook to neutral or slightly bearish.

RELIANCE 1D TIMEFRAME🧾 Basic Market Overview
Open: ₹2,990
High: ₹3,012
Low: ₹2,943
Close: ₹2,956
Change: Down by ~₹34 (approx. -1.13%)
Today, Reliance started strong but faced immediate selling near the ₹3,000 mark, resulting in a negative close. The price remained weak for most of the session, and closed near the day’s low, which is a bearish sign.
🕯️ Candlestick Formation
The candle formed on the daily chart resembles a strong bearish candle — possibly a long red candle or bearish engulfing if it closes below the previous day’s close. This shows:
📈 Trend Overview
Short-Term Trend: Weak — downward momentum building
Medium-Term Trend: Sideways to slightly bullish
Long-Term Trend: Bullish — still intact unless price breaks ₹2,850
Today’s weakness has not yet broken long-term structure, but short-term traders should be cautious.
🔮 What Could Happen Next?
✅ Bullish Recovery:
If Reliance moves back above ₹3,000 and sustains with volume, it can retest ₹3,050–₹3,080
A bullish engulfing or reversal pattern needed for upside confirmation
⚠️ Bearish Continuation:
If it breaks below ₹2,940, more downside is possible toward ₹2,915–₹2,875
Traders may take short positions below this level with tight stop-loss
🔄 Consolidation:
If the price holds between ₹2,940 and ₹3,000, expect sideways movement or base building before a big move
🎯 Strategy Suggestions
For Intraday Traders:
Watch ₹2,940 – ₹3,000 levels closely
Short below ₹2,940 with a target of ₹2,915
Long above ₹3,000 only if backed by strong buying
For Swing Traders:
Avoid new longs until daily candle shows strength
Consider fresh buys near ₹2,900–₹2,915 with SL below ₹2,875
Wait for a breakout above ₹3,050 to confirm bullish reversal
For Investors:
No need to panic; long-term uptrend still valid
Add in dips if it reaches ₹2,875–₹2,850 with confirmation
Fundamental strength supports medium-to-long-term outlook
📌 Summary
Reliance showed bearish sentiment today, breaking below the short-term support of ₹2,975 and closing weak at ₹2,956. It’s trading between a critical support zone of ₹2,940–₹2,915 and facing resistance around ₹3,000–₹3,020.
Short-term: Bearish bias
Medium-term: Neutral to weak bullish
Long-term: Still bullish unless ₹2,850 breaks decisively
Traders should be cautious and wait for confirmation before taking aggressive positions.
Buyers attempted a push above ₹3,000 but failed.
Bears took over the session.
Closing near the day’s low suggests strong downside momentum.
Technical ClassA Technical Class for Trading is a structured learning program that helps aspiring traders understand how to analyze financial markets using technical analysis. Unlike guessing market movements or relying on news, technical analysis is a science of price behavior, built on charts, patterns, indicators, and market psychology. This class is essential for anyone who wants to become a self-reliant trader in stocks, options, futures, forex, or crypto.
✅ What You Learn in a Technical Trading Class
A good technical trading class teaches how to analyze price action, spot trading opportunities, and apply disciplined risk management. Here’s what’s typically covered:
📈 1. Introduction to Technical Analysis
What is Technical Analysis?
Difference between Technical and Fundamental Analysis
Importance of studying price action and volume
Types of traders: Day Trader, Swing Trader, Positional Trader, Scalper
🕯️ 2. Candlestick Chart Reading
Candlestick charts tell stories of price movement and trader psychology.
You'll learn:
Structure of a candlestick (open, high, low, close)
Key single candlestick patterns (Hammer, Doji, Marubozu)
Dual & triple patterns (Engulfing, Morning Star, Evening Star)
How to use candles to detect reversals or continuations
📊 3. Chart Types and Timeframes
Line chart vs Bar chart vs Candlestick chart
Timeframe selection for different trading styles:
Intraday (5 min, 15 min)
Swing (1 hour, 4 hour)
Positional (Daily, Weekly)
📌 4. Support and Resistance
What are support and resistance levels?
How to identify major levels using price action
Role of psychological round numbers
Breakouts and false breakouts
How to use them for entry, exit, and stop-loss
📉 5. Trend Analysis
Understanding the direction of the market is critical.
You will learn:
How to spot uptrends, downtrends, and sideways markets
How to draw trendlines correctly
Using price structure: Higher Highs / Higher Lows
Tools like Moving Averages to confirm trends
📐 6. Chart Patterns
Chart patterns help forecast future moves.
Key patterns covered:
Reversal Patterns: Head & Shoulders, Double Top/Bottom
Continuation Patterns: Flags, Pennants, Triangles
Breakout strategies and volume confirmation
⚙️ 7. Technical Indicators
Indicators help confirm entries and manage trades.
Most-used indicators:
Moving Averages (SMA/EMA)
Relative Strength Index (RSI)
MACD (Moving Average Convergence Divergence)
Bollinger Bands
Volume analysis
How to combine indicators for smarter entries
⏳ 8. Time, Volume & Volatility
Importance of volume spikes
Volatility analysis for risk management
Understanding market sessions and timing your trades
🎯 9. Risk Management
This is where most traders fail. A technical class teaches:
How much to risk per trade (1–2%)
Risk-to-reward ratios
Where to place a stop-loss
How to avoid revenge trading
Capital preservation first, profit later
🧠 10. Trading Psychology
Handling emotions: Greed, Fear, Impatience
Importance of discipline and patience
Building confidence through planning
Developing a trading journal and sticking to rules
⚡ 11. Practical Strategy Building
The real power of a technical class lies in combining all the knowledge to build strategies:
Trend-following strategy
Reversal setups
Breakout/breakdown trades
Momentum-based trades
Intraday vs swing setups
📚 Benefits of Joining a Technical Class
Learn systematic trading instead of gambling
Avoid common beginner mistakes
Practice through live market examples
Prepare to move toward professional-level trading
Save time by learning from expert mentors
🔎 Who Should Take a Technical Class?
Aspiring full-time or part-time traders
Stock market beginners
Intraday traders, swing traders, or positional investors
Option traders who want to improve timing
Anyone who wants clarity and structure in their trading
📌 Final Thoughts
A Technical Class for Trading is not just about indicators and charts. It’s about learning a structured, rule-based approach to understanding the market. It empowers you to make trading decisions confidently and helps you grow from a beginner to a skilled, strategy-driven trader.
Whether you’re trading stocks, Bank Nifty, Nifty50, or even crypto — technical analysis is your foundation. Learn it well, practice with discipline, and your chances of success in the markets will dramatically improve.

Institutional Trading StrategiesWhat is Institutional Trading?
Institutional trading means the buying and selling of stocks, futures, options, and other financial instruments by large organizations. These organizations are often:
Mutual Funds
Pension Funds
Hedge Funds
Banks and Insurance Companies
Foreign Institutional Investors (FII)
Domestic Institutional Investors (DII)
Unlike retail traders who trade with small amounts of capital, institutional players move huge sums of money, sometimes trading in crores or billions in a single day.
Why Do Institutions Trade Differently?
Institutions have massive capital, so their approach is completely different:
They can’t enter or exit a stock quickly without moving its price.
They focus more on long-term positions or large short-term trades.
They use advanced tools like algorithms, high-frequency trading, and exclusive market data.
In simple words: they trade like whales in the ocean, while retail traders are like small fish.
Core Institutional Trading Strategies Explained
1. Order Flow and Volume Analysis
Institutions often leave their footprint in the market by how much they buy or sell. This is visible through volume spikes and order flow. Retail traders can track this by:
Watching unusual volume on a stock
Monitoring delivery percentage (for cash segment)
Using indicators like VWAP (Volume Weighted Average Price) to see where large trades are happening
Institutions use volume as a key indicator because when big money flows in, prices generally follow.
2. Order Block and Supply-Demand Zones
Institutions don’t buy stocks in one go. They accumulate positions slowly within certain price ranges. These areas are called:
Order Blocks – zones where large buying or selling has happened in the past.
Supply-Demand Zones – areas where the market reacts due to prior institutional activity.
When price comes back to these zones, you will often see a strong bounce (demand) or rejection (supply).
3. Breakout and False Breakout Manipulation
Institutions are masters of manipulation. They often cause:
False Breakouts to trap retail traders.
Breakdown traps to collect positions cheaply.
You will see prices breaking key levels (like support or resistance), triggering retail stop losses, and then reversing sharply. Institutions use liquidity from these retail stop losses to enter or exit positions.
4. Volume Weighted Average Price (VWAP) Strategy
Most institutions benchmark their trades around VWAP.
When prices are above VWAP, the bias is bullish.
When prices are below VWAP, the bias is bearish.
Institutions often buy when price retraces to VWAP after a breakout and sell when it tests VWAP after a breakdown. VWAP acts like a fair value line for many large traders.
5. Liquidity Hunting and Stop Loss Fishing
Institutions need liquidity to place large orders. So they create fake moves:
Push prices higher to make retail buy, then sell into it.
Push prices lower to trigger retail stop-losses and then reverse the price upwards.
This is why retail traders often feel the market is “hitting my stop-loss and then moving in my direction”.
6. Options Data Analysis
Institutions hedge their cash and futures positions using options:
High Open Interest (OI) at certain strike prices indicates important levels.
Sudden OI build-up can show institutional call writing (bearish) or put writing (bullish).
Institutions use Option Selling strategies because time decay (theta) works in their favor.
Retail traders can track option data to understand institutional bias, especially around expiry.
7. Algorithmic Trading (Algo Trading)
Institutions use computers (algos) to execute trades based on pre-defined rules:
Speed: Algos trade in microseconds.
Precision: No emotions, just system-based entries and exits.
Scalability: Handles thousands of orders simultaneously.
You can’t compete with algos on speed, but you can follow the flow by watching patterns like sudden large candles without news or price bouncing off VWAP repeatedly.
8. Fundamental Catalysts Trading
Institutions also trade based on news, earnings, and economic data:
Positive quarterly results → gradual accumulation before the news
Interest rate changes → repositioning in banking stocks
Government policy changes → entering sectors like infrastructure or defense
They often buy early before the public knows and sell after retail traders start entering.
9. Sector Rotation Strategy
Institutions rotate money between sectors:
Moving from IT to Banks
From FMCG to Auto
From Metal to Pharma
Retail traders get stuck chasing one stock, while institutions follow where big sector money is flowing. You can track sector indices (like Nifty Bank, Nifty Auto) to ride these moves.
10. Index Balancing Strategy
In indices like Nifty 50 or Sensex, institutions adjust portfolios based on:
Index addition/removal
Rebalancing due to quarterly reviews
Passive fund flows
Stock prices often jump or fall sharply around these events, giving smart traders easy trading opportunities.
How to Identify Institutional Activity as a Retail Trader
Look for unusual volume spikes
Watch for rejection or breakout around order blocks
Use VWAP as a guidance tool
Track option chain data before key events
Follow sector rotation via index charts
Watch price-action near important news events
Practical Tips for Retail Traders
Trade less, trade better: Institutions don’t chase every small move, neither should you.
Wait for confirmation: Let institutions show their hand through volume before entering.
Avoid emotional trades: The market is designed to make you emotional — don’t fall for it.
Risk management is king: Institutions have risk teams; you must use stop-loss.
Never blindly follow tips: By the time you hear news, institutions are already in or out.
Why Institutional Strategies Work Better
Institutions follow a data-driven approach backed by:
Risk management policies
Trained analysts
Large capital to manage volatility
No emotional trading
Use of technology (Algos)
Retail traders who respect market structure and trade alongside institutions improve their win rate dramatically.
Final Thoughts
Institutional Trading is all about structure, discipline, and patience. It’s not about guessing but about observing market behavior — where are the big players active? Why is volume rising? Where is liquidity flowing?
You don’t need huge capital to benefit from institutional strategies. You simply need to follow the footprints, avoid traps, and focus on high-probability trades.
Option Trading Advanced Strategies📌 Introduction: Why Go Beyond Basic Options?
Basic option strategies like buying calls or puts, or even covered calls, offer simplicity—but they don’t fully unlock the potential of options as a strategic tool.
When you enter the advanced territory, you gain the power to:
Profit in sideways markets
Neutralize directional risks
Create high-probability income
Minimize drawdowns
Take advantage of volatility shifts
Advanced strategies require you to understand multi-leg positions, greeks, risk/reward shaping, and market timing.
Let’s break it all down into clear, real-life explanations.
🧩 1. Iron Condor – Profit in Range-Bound Markets
🔍 What is it?
An Iron Condor involves selling a call spread and a put spread at the same time, expecting the stock/index to stay in a tight range.
🔧 Construction:
Sell 1 OTM Call
Buy 1 further OTM Call
Sell 1 OTM Put
Buy 1 further OTM Put
All with same expiry.
🎯 Ideal Market View:
Market is range-bound
You expect low volatility
No major event expected
💰 Max Profit:
Occurs when stock expires between the two short strikes
⚠️ Max Loss:
Happens when stock moves beyond outer strikes
✅ Why use it?
Generates monthly income
Defined risk
High probability if used smartly
⚖️ 2. Butterfly Spread – Profit from Precision
🔍 What is it?
The Butterfly Spread is a neutral strategy where the trader expects the stock to close near a specific price.
🔧 Construction (Call Butterfly):
Buy 1 ITM Call
Sell 2 ATM Calls
Buy 1 OTM Call
All with same expiry.
🎯 Ideal Market View:
You expect stock to move very little
Great for expiry day setups or low-volatility trades
💰 Max Profit:
When stock closes exactly at strike price of sold calls
⚠️ Max Loss:
When price moves significantly up or down
✅ Why use it?
Cheap entry cost
Controlled risk
Can return 200–300% with precise movement
🌀 3. Calendar Spread – Play on Time and Volatility
🔍 What is it?
A Calendar Spread profits from time decay and implied volatility expansion.
🔧 Construction:
Sell 1 Near-Term Option
Buy 1 Longer-Term Option
Same strike, same type (Call or Put)
🎯 Ideal Market View:
Expect stock to stay around strike price in short term
Expect volatility to increase
💰 Max Profit:
When the short-term option decays and stock remains near the strike
⚠️ Max Loss:
If stock makes a strong move or IV drops unexpectedly
✅ Why use it?
Good for earnings events
Plays time + volatility
Low capital strategy
💡 4. Ratio Spread – When You Want a Controlled Gamble
🔍 What is it?
A Ratio Spread involves selling more options than you buy (like buying 1 Call and selling 2 Calls). It’s directional but nuanced.
🔧 Construction (Call Ratio Spread):
Buy 1 ATM Call
Sell 2 OTM Calls
You can reverse for puts if bearish.
🎯 Ideal Market View:
Expect a mild bullish move, not a breakout
Moderate volatility
💰 Max Profit:
When stock closes near the short strike
⚠️ Max Risk:
If stock moves too much upward, losses can be unlimited (unless hedge is applied)
✅ Why use it?
High reward-to-risk if market behaves
Can be converted into a risk-free structure using debit/credit adjustments
🏹 5. Straddle and Strangle – Playing Big Moves
🔍 What is it?
Straddle and Strangle are volatility-based strategies.
Straddle = Buy Call + Buy Put at same strike
Strangle = Buy OTM Call + Buy OTM Put
🎯 Ideal Market View:
Expect a big move but unsure of direction
Perfect for events: earnings, budget, Fed announcements
💰 Max Profit:
When market makes a big move, either up or down
⚠️ Max Loss:
When market stays flat
✅ Why use it?
Useful before news or big breakout
Non-directional but aggressive
🧮 6. Delta-Neutral Trading – Profit Without Direction
🔍 What is it?
Delta-neutral trading aims to neutralize directional risk (delta = 0) using a combination of options and/or futures.
💡 Example:
Sell ATM Call + Buy underlying stock in proportion so total delta = 0
Or balance long and short options across strikes
🎯 Ideal Market View:
Expect volatility or time decay
No strong directional bias
✅ Benefits:
Income generation regardless of market direction
Hedged and flexible
🔁 7. Rolling Strategies – Actively Adjust for Profit
🔍 What is it?
Rolling means shifting an existing position to a new strike or expiry to manage risk or lock profit.
Use Cases:
Roll down puts in falling market
Roll up calls in bull trend
Roll to next expiry to extend time decay
✅ Benefits:
Dynamic control
Prevents stop-loss triggers
Protects profits in trending markets
🛑 Risk Management Tips for Advanced Traders
Always define max loss – Use spreads, not naked trades
Check IV before trading – High IV = sell premium; Low IV = buy premium
Position sizing – Never go all-in on a strategy
Use alerts and automation – Advanced strategies need fast reaction
Avoid illiquid options – Stick to Nifty, Bank Nifty, liquid stocks
Paper trade first – Test complex strategies without real money
📈 Real-Life Example – Iron Condor on Nifty
Let’s say Nifty is at 24,300 and expiry is 7 days away. You expect Nifty to stay between 24,000 and 24,600.
Trade Setup:
Sell 24,000 Put
Buy 23,800 Put
Sell 24,600 Call
Buy 24,800 Call
Net credit: ₹50–60
Max Profit: ₹50 if Nifty stays between 24K–24.6K
Max Loss: ₹150 if market breaks either side
This gives a 1:3 risk-reward with 70%–75% probability.
💬 Final Thoughts
Advanced option strategies aren’t about gambling—they’re about precision, hedging, and income generation with structure. They offer you more control than simple buying/selling.
But with more power comes more responsibility:
Know your market view
Know the structure of your strategy
Know when to adjust or exit
Once you understand how to read volatility, manage risk with Greeks, and construct defined-risk trades, options can become your most flexible and profitable tool in the market.
Sensex 1D Timeframe
📈 Sensex (BSE 30) Today’s Overview (1D Time Frame)
Opening Level: Sensex opened higher around 82,350 to 82,500 points, continuing the positive momentum from previous sessions.
Intraday High: Reached around 82,530 in the first half of the session.
Intraday Low: Dropped to approximately 82,170–82,200 in the afternoon session.
Current Trading Range: Mostly trading between 82,200 and 82,500 levels, with a slight upward bias.
Previous Close: Around 82,180–82,200.
Net Change: Trading +0.2% to +0.3% higher, showing slight gains.
🔍 Key Market Drivers Today
Positive Impact:
Strong earnings from banking stocks, especially HDFC Bank and ICICI Bank, are boosting index strength.
Eternal Group (parent of Zomato) surged significantly, adding positivity to market sentiment.
Low volatility today, with India VIX falling, indicating reduced fear in the market.
Negative Impact:
Realty, PSU Banks, and Media sectors underperformed, capping higher gains.
Profit booking seen in auto and pharma stocks, causing minor mid-session dips.
📝 Technical Summary
Trend: Overall uptrend remains intact, with minor intraday corrections.
Support Levels: Immediate support around 82,170–82,200 zone.
Resistance Levels: Strong resistance around 82,500–82,550, breakout beyond which could take Sensex toward 83,000.
Volatility: Low volatility suggests possible slow and steady upward movement
✅ Summary Conclusion
Today, Sensex is mildly positive, driven by financial sector strength and earnings momentum. Some sector rotation is visible with pockets of weakness in PSU and Realty stocks. Volatility remains low, supporting a controlled trading session with limited intraday swings.

Banknifty 1D Timeframe📈 Bank Nifty – Market Overview
Opening Price: Opened strong near 57,250–57,300.
Intraday High: Touched around 57,286 in early trading hours.
Intraday Low: Dropped towards 56,730 during mid to late session.
Current Trading Range: Between 56,730 and 57,280, with a mild negative bias.
Previous Close: Around 56,953.
Current Loss: Trading -0.3% to -0.5% lower compared to previous close.
🔍 Key Drivers Today
Private Banks Hold Strength: Stocks like HDFC Bank and ICICI Bank showed resilience, limiting the downside.
PSU Banks Under Pressure: Public sector banks including SBI, PNB, and Canara Bank underperformed, causing the index to drift lower.
Profit Booking Seen: After an early positive move, intraday profit booking pulled the index back.
Low Volatility: Reduced intraday swings, though a narrow downtrend was visible after the first hour.
📊 Technical Picture
Support Zone: Strong support is visible around 56,730–56,700. A breach could see a quick move toward 56,500–56,000.
Resistance Zone: Resistance remains at 57,250–57,300. If this level is crossed, the next upside target is around 57,500–57,700.
Trend Bias: Neutral to bearish for the day due to selling pressure after opening strength.
✅ Summary Conclusion
Bank Nifty is showing slight weakness today, mainly dragged by public sector banks. The index gave up early gains, but private banks kept the fall in check. Current range is 56,730–57,280. Watch for either a bounce above 57,300 or a break below 56,700 for the next clear trend direction.

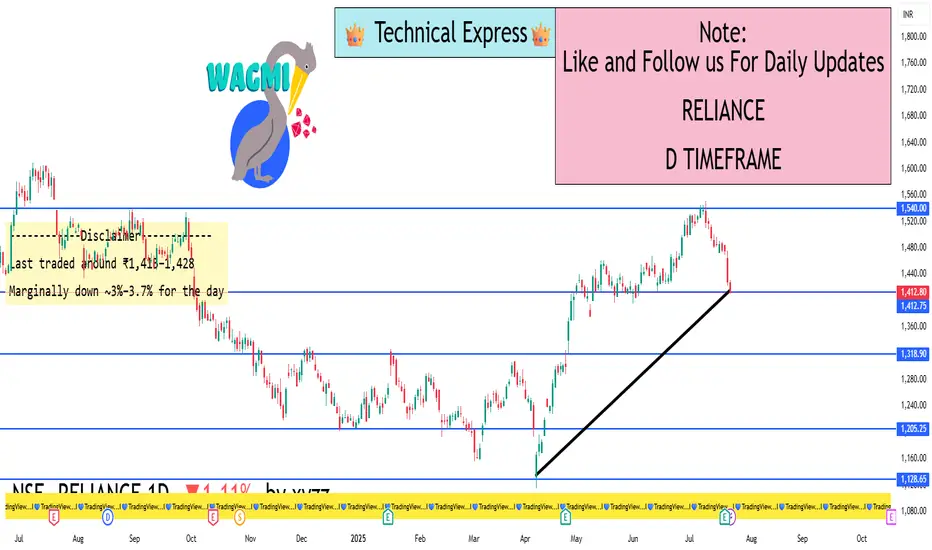
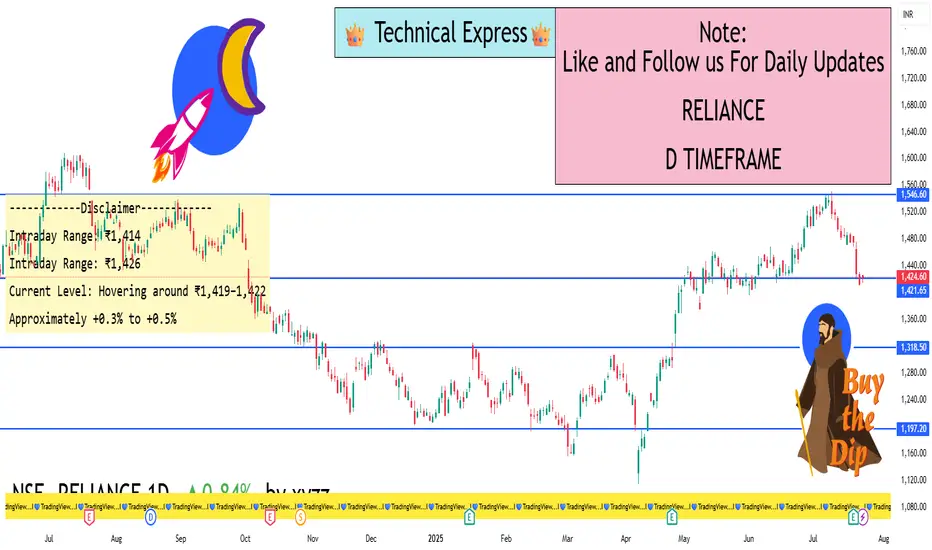
Reliance 1D Timeframe📊 Reliance Industries – Intraday Overview
Previous Close: ₹1,428.6
Opening Price: Opened slightly lower around ₹1,427–₹1,431.
Intraday High: Approximately ₹1,432 during early session.
Intraday Low: Dropped towards ₹1,410 during the mid-session.
Current Trading Price: Trading near ₹1,415, showing around 0.9% to 1% decline from the previous close.
🔍 Key Reasons for Movement Today
Post-Earnings Pressure: After recent earnings, Reliance faced profit booking as some investors booked gains following a previous rally.
Sector Weakness: Energy and telecom segments showed subdued strength while retail remained flat.
Heavy Volume: Trading volume remained above average, suggesting active participation from institutions and retail traders.
📈 Technical Snapshot
Immediate Support Zone: ₹1,410–₹1,412. If this breaks, next support could be near ₹1,400.
Immediate Resistance Zone: ₹1,430–₹1,432. A breakout above this may lead towards ₹1,440–₹1,450.
Trend Positioning: Reliance is currently below its short-term (20-day) moving average, indicating mild short-term weakness but no major breakdown.
💡 Intraday Strategy Levels
Scenario Trigger Point Expected Move
Bullish Reversal Above ₹1,432 Potential upside towards ₹1,445–₹1,450
Neutral/Bearish Between ₹1,410–₹1,430 Consolidation zone with limited moves
Breakdown Risk Below ₹1,410 Could slide to ₹1,400 or even ₹1,390 short-term
✅ Summary Conclusion
Reliance is trading with a mild negative bias, with price action holding between ₹1,410–₹1,432. The overall short-term structure remains weak after intraday profit booking, but key support is holding near ₹1,410. Watch for recovery above ₹1,432 for any bullish reversal or break below ₹1,410 for further downside.