A Change of Character (ChoCh) in Smart Money ConceptA Change of Character (ChoCh) in Smart Money Concept signals a potential trend reversal, and Dabur India Ltd trading near ₹498 on the hourly chart is showing such a setup, hinting at a possible shift from bearish to bullish momentum.
📘 What is Change of Character (ChoCh)?
Definition: In Smart Money Concept (SMC), a Change of Character occurs when price action breaks the most recent structural high/low in the opposite direction of the prevailing trend.
Mechanics:
In a downtrend, ChoCh is confirmed when price breaks a recent swing high.
In an uptrend, ChoCh is confirmed when price breaks a recent swing low.
Purpose: It highlights the first sign of a trend reversal, often before a full Break of Structure (BoS) confirms the new trend.
🔑 Importance of ChoCh in Trading
Early Signal: ChoCh acts as the initial footprint of institutional order flow shifting direction.
Risk Management: Traders use ChoCh to tighten stops or prepare for entries aligned with the new trend.
Multi-Timeframe Relevance: On higher timeframes, ChoCh can mark major reversals; on lower timeframes, it signals short-term opportunities.
Strategic Edge: Recognizing ChoCh allows traders to position themselves ahead of retail participants who wait for later confirmations.
📊 Dabur India Ltd – Current Opportunity
Current Price: ₹497.50 (slightly up from previous close of ₹495.65).
Hourly Chart Setup: The stock is forming a ChoCh, suggesting a potential end to the recent downtrend.
Implication: If Dabur sustains above ₹498 and builds higher lows, it could mark the beginning of an uptrend phase.
Opportunity:
Aggressive traders may look for early long entries near current levels.
Conservative traders may wait for a Break of Structure (BoS) above a significant resistance to confirm trend reversal.
Risk Consideration: False ChoCh signals can occur; hence, volume confirmation and stop-loss placement below recent swing lows are crucial.
🚀 Final Takeaway
The Change of Character (ChoCh) is a powerful Smart Money Concept tool that helps traders spot early trend reversals. Dabur India Ltd’s hourly chart showing ChoCh near ₹498 is a potential bullish opportunity, but traders should confirm with price action and volume before committing.
Daburindia

KOTAKBANK 1D Time frame📍 Current Price
₹1,972.30 (unchanged from previous close)
Short-Term Outlook
Bullish Scenario: A sustained move above ₹2,000 could lead to a test of the 52-week high around ₹2,301.90.
Bearish Scenario: A drop below ₹1,950 may signal a potential pullback toward ₹1,900.

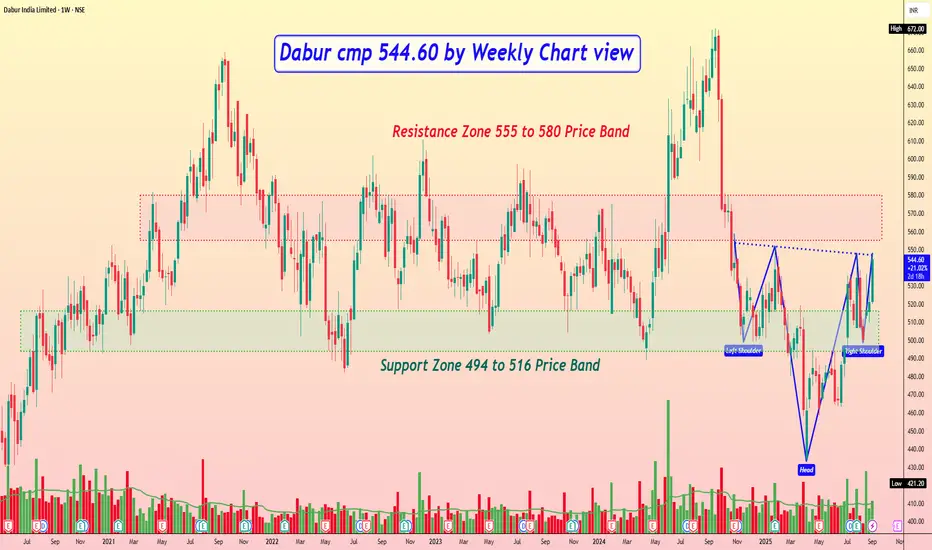
Dabur cmp 544.60 by Weekly Chart viewDabur cmp 544.60 by Weekly Chart view
- Support Zone 494 to 516 Price Band
- Resistance Zone 494 to 516 Price Band
- Breakout probable basis ongoing Support Zone test retest
- Closely considerate Bullish Head & Shoulders with Resistance Zone neckline
- Volumes are seen spiking well above average traded quantity over the past few weeks
- Favorably trending Technical Indicator signals shown by BB, EMA, MACD, RSI, SuperTrend
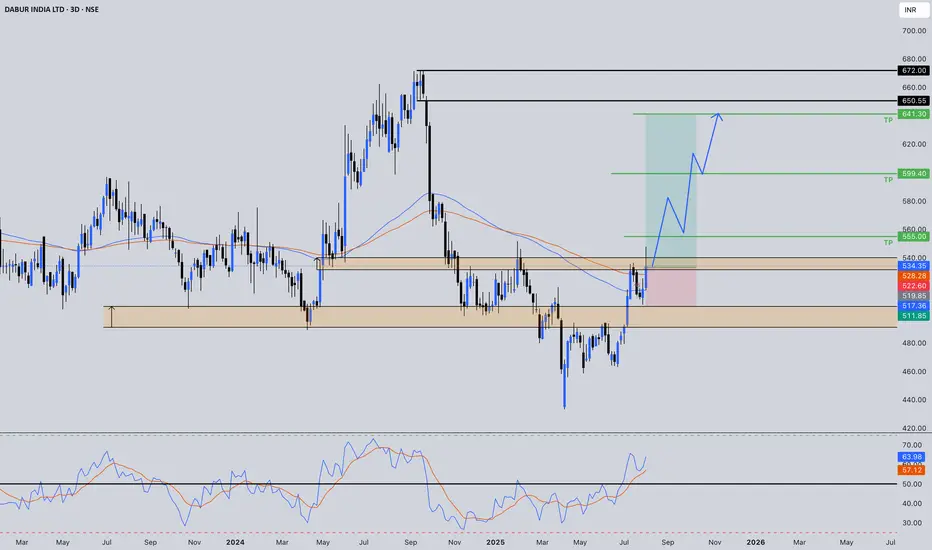
DABUR INDIA: Ready to Fly! ⚡️Price Analysis:
1️⃣ Price showing strength.
2️⃣ Price structure is bullish.
3️⃣ Good momentum is expected.
✨ Key Observations:
➡️ RRR favourable at CMP.
➡️ Reversal is confirmed.
⚠️ Disclaimer: This is NOT a buy/sell recommendation. This post is meant for learning purposes only. Views are personal. Please, do your due diligence before investing.⚠️
💬 Share your thoughts in the comments below! ✌️
🔥 Trade Safe! ✅ 🚀
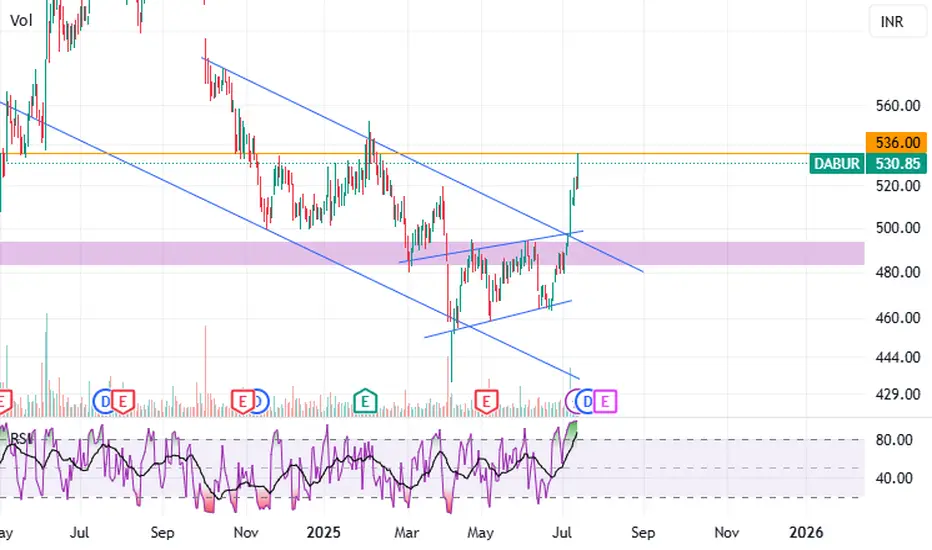
DABUR INDIA LTDDABUR – Falling wedge breakout, bullish reversal signal. This pattern forms after a downtrend and suggests the end of selling pressure. Around the 480–500 zone, the stock consolidated multiple times. This acted as a demand/support zone, which has now been broken decisively to the upside. There is a spike in volume supporting the breakout, which confirms that buyers are stepping in with strength.
Current Price: 530.85
Buy above 540 (past swing high) – Support Zone 535 (previous breakout point).
Buy on Dips: Ideal buy entry between 510–520 if the stock pulls back slightly. Support Zone: 498
Target after breakout at 555 and 575 levels is possible
Is Dabur on the Verge of a Big Move? The Chart Holds the Answer!Hello Everyone!
I hope you all are doing great in life and in your trading journey! Today, I’ve brought you a stock that’s as sweet as honey. Yes, you guessed it right, I’m talking about India’s best honey and Ayurvedic products selling company — DABUR.
Dabur has always been known for its strong product lineup in the FMCG sector, with their products being staples in every Indian household. Let's dive into the technical setup and trading idea for Dabur and see if it's ready to provide us with some sweet returns!
Looking at the weekly chart of Dabur India Ltd., the stock has been showing clear price action within well-defined zones. Currently, Dabur is testing a historically strong support zone around the 510-495 range, a level that has previously acted as a reliable bounce area. This zone is crucial to watch, as a hammer candle has formed at this support, signaling a potential bullish reversal . If this support holds again, it could provide a strong buying opportunity.
The strong resistance zone near 660 marks the final target for this move, with a possible upside of around 37.94% . The stock is also showing potential for a swing trade as it approaches a reversal from the support. Keep an eye on price action around these levels to manage your risk effectively.
Disclaimer:- This analysis is for educational purposes only. Please trade responsibly and consult a financial advisor before making any decisions.
If you found this analysis helpful, don’t forget to like, follow, and share your thoughts in the comments below! Your support keeps me motivated to share more insights. Let’s grow and learn together—happy trading!

Dabur cmp 525.35 by Daily Chart viewDabur cmp 525.35 by Daily Chart view
- Support Zone 500 to 510 Price Band
- Resistance Zone 531 to 538 Price Band
- Volumes seem to be gradually moving up by positive demand based buying
- Back to Back Bullish Rounding Bottoms formed and/or a VCP pattern too may be considered based on how one observes by neckline at Resistance Zone for fresh breakout

DABUR : 15%+ Upside Potential - Bulls on the way for reversal!⚡Price Analysis:
1️⃣ Strong Demand zone
2️⃣ Price structure is bullish.
3️⃣ Price needs to close above 533 in weekly only then good momentum can be expected
4️⃣ RRR is favorable.
✨ My Expectations:
➡️ Aggressive early entry can be planned at CMP.
➡️ Confirmations are still pending
➡️ 1:3RRR can be expected
1H TF:
- Anticipating a strong trendline break...
⚠️ Disclaimer: This is NOT a buy/sell recommendation. This post is meant for learning purposes only. Views are personal. Please, do your due diligence before investing.⚠️
💬 Drop your thoughts below in the comments section if you liked this analysis!✌️
🔥Happy trading!✅🚀

Dabur India Stock at a Critical JunctureDabur India Ltd., a leading FMCG player, is showing an interesting technical setup on its weekly chart.
Key Highlights:
Strong Support: The stock has consistently respected a long-term ascending trendline since 2012.
Triangle Pattern: A descending triangle is forming, signaling potential breakout or breakdown.
Current Level: Trading at INR 507.50, near critical support at the trendline.
Outlook:
Bullish Case: A breakout above the triangle could target INR 680.
Bearish Case: A breakdown below INR 480 may signal further downside.

DABUR - LONG TRADE IN FUTURESSymbol - DABUR
DABUR is currently trading at 522
I'm seeing a trading opportunity on buy side.
Buying DABUR Futures at 522
I will add more long position at 510, if comes.
Holding with SL of 503
Targets I'm expecting are 542 - 560 & above.
Disclaimer - Do not consider this as a buy/sell recommendation. I'm sharing my analysis & my trading position. You can track it for educational purposes. Thanks!

DABUR FOR 27% UPSIDEWe will execute half quantity now and half quantity on dips Dabur looks promising on the charts there are several peers which are giving a strong competition to Dabur but in the long run the growth potential is big.
Charts are up for a buy call.
NOTE: Holding are there in this stock on the lower levels, Having positions around 500

DABUR - SWING TRADE ON BUY SIDESymbol - DABUR
Dabur is currently trading near support zone of 500 - 510.
DABUR CMP - 506
I am initiating long positions in April Futures.
My SL would be 498 & Targets would be 525 & 540
It may move slow but it should move up from here.
Disclaimer - Do not consider this as a buy/sell recommendation. I'm sharing my analysis & my trading position. You can track it for educational purposes. Thanks!

Dabur Long Term TargetsThis is a Weekly chart. Here are some observations:
1. Price has been in a downtrend since Oct 2021 forming a large cup potentially finishing around Jun 2025 with neckline at ₹650
2. The red trendline still has to be broken to officially get into the uptrend
3. The recent green trendline has been breached following the healthy Quarterly results posted yesterday
4. Price has touched levels of 500 multiple times suggesting it to be a strong support zone
5. Multiple resistance levels on the way up particularly at 565, 600 and 650. All of them can be used as short term targets as well
6. Final target at 800 based on the cup (500 to 650)
Growth Drivers:
1. Economy has faced high inflation in recent times reflecting in the downtrend of stock performance
2. Consumer companies are reporting rural uptick in sales
3. Global consensus of rate cuts in 2024/2025
4. India’s growing population and per capita income
Verdict:
Considering both the macroeconomic factors and the fundamental/technical combination of Dabur, it seems like it has bottomed out at around 500 and is ready for the uptrend likely to hit ₹800 in the coming years. A handle formation is likely at ₹650, so the earnings have to be tracked closely. Happy trading!

DABUR (BO with volume)DABUR is moving aggressively for a breakout. Moving out of this triangle will lead to another high.
NOTE: I'm not a SEBI REG. Study before investing.

FMCG Stock near breakout Buy Dabur above 550
SL 535 15Rs SL
Target 1: 572
Target 2: 580
Target 3: 595
Duration 1-2 Months
Return about 8 %

Dabur India, BullishDabur India shows bullish setup with confluence of multiple patterns. The stock is trading below and
approaching #200EMA which is important support / resistance level. The stock has given 5month
trendline breakout, along with W-pattern and is also forming rounding bottom pattern. The key levels
to watch out are indicated in the chart.

Dabur India, Bullish, Target 680The chart of Dabur India shows successful completion of rounding pattern (as explained in previous idea) and now forming Cup-Holder pattern within S/R zone. On breakout, the stock
may reach the level of 680 which is the next technical target after rounding bottom pattern.
This is not any buy/sell recommendation, just chart pattern based technical analysis.

#DABUR... Looking good 22.05.23 frm now#DABUR... ✅▶️
Intraday as well as swing trade
All levels given in charts ...
IF good potential seen then we work in options also
if activate then possible a huge movement Keep eye on this ...
We take trade only when it activates...
Possible to give good target
TRADING FACTS

Dabur India Proper Correction and BreakoutThere are sometimes when a stock completes its correction, makes a textbook chart pattern and start an up-move. This is what I have observed in NSE:DABUR on weekly charts. What a beautiful structure and just the right time to break-out. It even tested the 200 EMA on weekly and spend considerable time in forming its pattern.
Now these patterns can be tricky with stop losses sometimes. Hence, my plan is to simplify this for you. Keep Targets of 645 and Stop Loss at 580. Go Long.
Disclaimer: All information is shared for educational purpose only.

DABUR - Ichimoku Bullish Breakout Stock Name - Dabur India Limited
Ichimoku Cloud Setup :
1). Today's close is above the Conversion Line
2). Future Kumo is Turning Bullish
3). Chikou span is slanting upwards
All these parameters are showing bullishness at Current Market Price
and more bullishness AFTER crossing 571
#This is not Buy and Sell recommendation to any one. This is for education purpose and a helping hand to learn trading in Market.
# Cloud Trading
# Ichimoku Cloud
# Ichimoku Followers
I hope you all like my analysis.
Please do share your thoughts into comment section.
Please give a like, share & subscribe for daily analysis.

Nifty FMCG can be sector of the weekNifty FMCG can be sector of the week clean fresh breakout -
Tata consumer / Godrej Consumer / Marico / Dabur / ITC / HUL looks good use the dips

DABUR INDIA LTD - Forming Reverse Flag PatternDabur India Ltd is forming a Reverse Flag Pattern and it is about to give a breakout at 528.
Based on the pattern, one can enter around 528 after the breakout and target can be set around 487 with Stoploss of 540.
This gives us risk to reward ratio of 3.3. Pattern is forming on hourly chart.
Disclaimer:
This idea is only for education purpose, Please consult your financial advisor.
I am not SEBI registered.

Dabur at 200 EMA WeeklyDabur is trading at its 200 EMA on weekly chart. It has formed Bullish Harami Candlestick pattern also. It has strong Open Interest Support (MAY 2023) at 500. RSI is currently taking support from 40 levels.
Support: 500
Resistance: 550
