Nifty - 22 May 2023Expecting NSE:NIFTY to continue it's Uptrend.
Target 1 -> 18245
Target 2 -> 18285
Trade or invest according to your analysis. This is just my view.
<----- 3MRT Trading ----->
Daily Charts

TRIDENT Daily looking bullishTRIDENT Daily looking bullish.. It has trendline breakout/Inverted head and shoulder breakout structure with 200 ema on daily candle support.
Good to buy at retracement near 34 for target of 44 with sl below 32

INTELLECT Daily looking bullishINTELLECT Daily has inverted head n shoulder breakout with 200 ema support on daily candle.
Good to buy at retracement near 500 for targets of 588,631 with sl below 478

ANDREWYU Daily looking bullishANDREWYU Daily has trendline breakout with 200 ema support on daily candle.
Good to buy at 25.25 for target of 33.70 with sl below 21.80

daily chart analysisnifty after a short-term downtrend rallied to make a close above 18000. this pullback rally is a two-legged rally. which is indicating the shorts being covered and not the trend reversal. this makes the rally to be suspicious about the up move recently made by Nifty. so trade cautiously to be long on nifty till it makes a close above 18145 after a dip to 17600.
Note:-Any trade long on nifty to be with strict stop loss.
enjoy trading..........

Patel Engineering looking bullishPatel Engineering daily has trendline breakout/ Inverted head n shoulder breakout. Good to buy at 19.90 for target of 26 with sl below 18

DISHTV Daily looking bullishDISHTV Daily has trendline breakout. Daily candle is bullish candle which is closed above 200 ema. Good to buy at 15 for target of 24 with sl below 12.30. The SL is kept at zone low. Today's candle closing is imp. It should maintain closing above 200 ema. But as the RR is good good to bet on it at 15 rs.


MAHSEAMLES Daily looking bullishMAHSEAMLES Daily has trendline breakout with 200 ema support on daily candle, Good to buy at 364 for target of 447 with sl below 321

GPPL Daily looking bullishGPPL Daily has trendline breakout/inverted head n shoulder breakout. Good to buy at 108-109 range for target of 124,175 with sl below 105

ZENSARTECH Daily looking bullishZENSARTECH Daily has rounded bottom breakout with 200 ema support on daily candle. Good to buy at retracement near 252 for targets of 323,395 and long term target of 538 with sl below 244

TCS Daily looking bullishTCS Daily has inverted head and shoulder breakout. Good to buy at 3529 for target of 4043 with sl below 3436

MANINFRA Daily looking bullishMANINFRA Daily has trendline breakout with 200 ema support on daily candle. Also it made double bottom with rsi divergence.
Good to buy at 82.50 for target of 99 with sl below 78

TATA MOTORS -- Daily Trendline BreakoutTATA MOTORS -DAILY CHART SETUP- Trendline breakout .
1. Tata motors on daily chart setup seen trendline breakout on last heikin ashi daily candle AT above 417-418 level
2. 200 HMA seen above 405 level . short term resistance broken above 400, from then stock seen up-trend .
3. currently stock trading above 44, 200 HMA bullish technical indicators.
4. RSI seen moving upword direction and move above 60 , above wma .
5. Golden cross of 44 and 200 HMA seen.
6. BUY can initiate @419 short term Target 430-450 and 6 month target 480-500 stop loss at 395
THIS IDEA IS FOR EDUCATIONAL PURPOSE .. ** trade at oen risk .!!
**** comments are welcome .
HAPPY TRADING. !!

My Elliotical Approach to XAUUSD Short.Hello traders!
1. We see 5 distinct waves each with their own seperate qualities as clearly mentioned on the chart.
2. We see and ending diagonal in wave v , which was followed by a swift and sharp wave (A).
3. Wave (A) retraced 61.8% which also happens to be a major resistance of the XAUUSD market on the daily tf.
4. Wave (A) also divides in 5 waves which I have not marked on the chart. This is so, because wave 1 and wave 2 of wave (A) seem to have operlapped a bit with wave 2 retracing close to 100% of wave 1 . This can happen in highly leveraged markets. For those who are new to Elliot Wave Theory, wave 2 should not retarce more than 100% of wave 1.
5. Wave B of a correction consists of 3 waves of which 2 waves are impulsive. B is considered elliotically non-tradable . But it components are impulsive and some part of it can definitely be traded.
6. Important resistance and support zones on the chart also point towards reversal of the XAUUSD market.
7. We do have to wait for the formation of wave 1 and wave 2 of (A) wave for confirmation .
8. Definitive targets and invalidation points will come in existence after confirmation.
Do use proper risk management.
Happy Trading!
Profits,
Market's Mechanic.

TDPOWERSYSTEMS looking bullish, Good retest of trendlineTDPOWER SYSTEMS Daily had trendline breakout, now it has done good retest of trendline. Hammer formation. Good to buy at 134.50 for targets of 149,179 with sl below 125.
Good to add up to existing qty

AUDUSD Sell Trade opportunityAUDUSD Sell Trade opportunity
Currently, the market is on the Fibonacci 0.61 level, there is a bearish candle indicating that it is a good level for a retracement. I am expecting that the market will retrace to the next support level indicated on the chart.

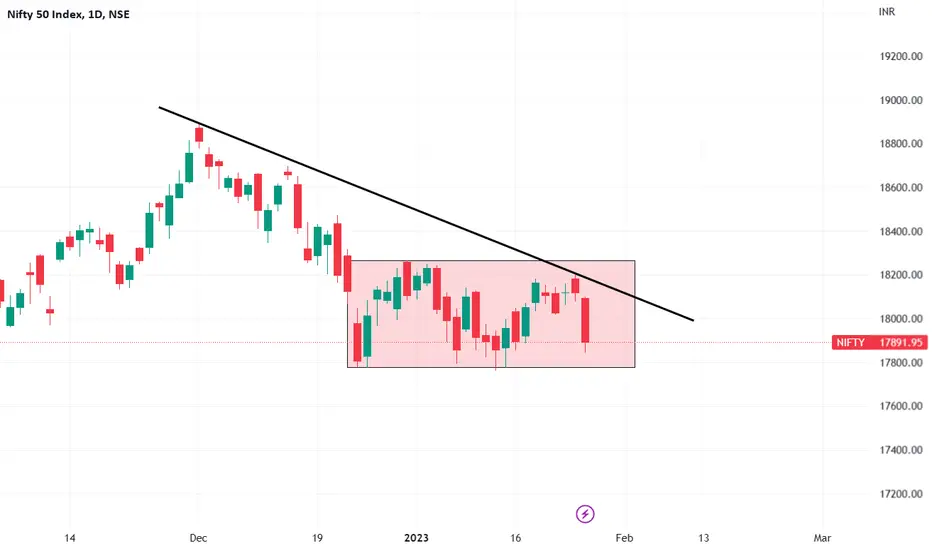
NIfty Daily ConsolidationConsolidation IN nifty, It is in a range whenever this box breck any side that side move will big.
Please take your decisions before enter to any trade.
ALPA Daily looking bullishALPA Daily has trendline breakout, good to buy at retracement near 73 for target of 108 with sl below 59

HINDALCO -- Daily Trendline Breakout HINDALCO --DAILY TRENDLINE BREAKOUT --CHART SETUP
1. Hindalco seen Daily trendline breakout at last closing session .
2. currently stoock trading at upper channel higher high and higher low formation seen on daily chart after sharp fall towards 320 sub level .
3. channel support seen at 360 sub level and resistance at 480 level of channel .
4. trix line seen crossover at center line ( o line ) and move at upword direction which is bullish signal
5. one can buy at 400-405 level for positional target 425-450-480 + ( 1-2 Month ) Stop loss can place bellow channel support at 355
** THIS IDEA IS FOR EDUCATIONAL PURPOSE ** trade at own risk.!
HAPPY TRADING . !!

TDPOWER SYSTEMS Daily looking bullishTDPOWER SYSTEMS Daily has trendline breakout with good retest of trendline. Good to buy at 137 for targets of 149,179 with sl below 130

GEEKAY WIRES Daily looking bullishGEEKAY WIRES Daily has trendline breakout with 200 ema support on daily candle. cmp 92, Dont buy at cmp. Wait for retracement near 85 to buy for target of 112,147 with sl below 70

SIGACHI Daily looking bullishSIGACHI Daily has inverted head and shoulder breakout, with 200 ema support on daily candle. Not good to buy at cmp 340 . Wait for retracement near 310 for buying for target of 425 with sl below 282
