BUYER FOMO: BREAK ALL THE RULES📌 GOLD – Trading Plan OANDA:XAUUSD
Follow Signals On weekend Linda published you got SELL PLAN 3720 +120PIPS
Absolutely that up first down after:
1. Market Context (H1)
Main trend: Bullish (following several upward BOS).
The price has just broken the peak and created new liquidity above the 3715 – 3720 zone.
Below, there are CP Orders + FVG at 3693 / 3669 / 3650 → the price may retrace to test demand before continuing to rise.
Above: the 3749 – 3750 zone is a strong resistance, likely to see liquidity sweeps.
2. Main Scenario – BUY with the trend
Entry 1: CP ORDER + Trend Timing
Zone: 3693 – 3695.
Stoploss: 3685.
TP1: 3715.
TP2: 3730+.
R:R ratio: ~1:3.
Entry 2: Deeper CP ORDER
Zone: 3669 – 3670.
Stoploss: 3660.
TP1: 3710.
TP2: 3730+.
R:R: ~1:4.
Entry 3: Final FVG
Zone: 3650 – 3655.
Stoploss: 3640.
TP: 3710 – 3720.
This is the final entry; if it breaks, consider the trend reversed.
3. Alternative Scenario – SELL counter-trend (scalp)
Entry Sell
Zone: 3749 – 3750 (resistance + liquidity).
Stoploss: 3757.
TP1: 3730 – 3735.
TP2: 3695 – 3670 (if selling pressure is strong).
Confirmation required on M5/M15:
MSS down.
Bearish engulfing.
Long wick rejection.
4. Capital Management
Total risk for the day: max 3 – 4% of the account.
Each trade risk 1 – 1.5%.
Prioritize Buy, Sell is just a small scalp.
If the price hits TP1 → move SL to entry, let the rest run.
5. Notes
Main trend: Bullish, don't attempt too many counter-sells.
Only sell when clear signals appear at 3749 – 3750.
The 3693/3669 mark is a key zone → if it breaks strongly, wait for trend confirmation.
Dailyanalysis

Gold 1H – Should We Hold or Fade Liquidity at 3800?On the 1-hour timeframe, gold is trading near 3,776 within a corrective channel. Premium liquidity remains clustered above 3,800–3,798, while discount demand is positioned at 3,725–3,727. Recent BOS (Break of Structure) signals confirm bullish intent, but engineered sweeps into premium zones are still likely before price retraces toward discount levels.
Today’s headlines on the Federal Reserve’s cautious approach and ongoing geopolitical tensions in the Middle East are reinforcing safe-haven demand. However, intraday volatility may continue to produce liquidity grabs before clear direction is established.
________________________________________
📌 Key Structure & Liquidity Zones (1H)
• 🔴 SELL GOLD LIQUIDITY 3,800–3,798 (SL 3,807):
Premium resistance where liquidity sweeps may cause rejections towards 3,770 → 3,760 → 3,755.
• 🟢 BUY ZONE 3,725–3,727 (SL 3,720):
Discount demand in line with BOS, with upside targets at 3,740 → 3,760 → 3,775.
________________________________________
📊 Trading Ideas (Scenario-Based)
🔻 Sell Setup – Liquidity Run (3,800–3,798)
• Entry: 3,800–3,798
• Stop Loss: 3,807
• Take Profits:
o TP1: 3,770
o TP2: 3,760
o TP3: 3,755
🔺 Buy Setup – Discount Demand (3,725–3,727)
• Entry: 3,725–3,727
• Stop Loss: 3,720
• Take Profits:
o TP1: 3,740
o TP2: 3,760
o TP3: 3,775+
________________________________________
🔑 Strategy Note
With the Fed’s cautious stance and geopolitical risks supporting gold, the broader bias remains buy-the-dip. At the same time, fading engineered sweeps into premium liquidity zones can offer tactical short-term opportunities. Expect volatility around 3,800 liquidity runs before retracements into well-defined discount zones.

Gold 1H – Fed Signals & Geopolitics Keep Bulls on the MoveGold on the 1H timeframe is trading around 3,705–3,710 after a strong breakout, staying within a rising channel. Liquidity is concentrated above at the premium resistance zone near 3,716–3,718, while demand is positioned lower at 3,687–3,689 and deeper at the FVG zone 3,654–3,656. Recent dovish signals from the Fed following last week’s rate cut, coupled with rising geopolitical tensions, continue to bolster safe-haven demand. However, upcoming U.S. inflation data and Fed speakers could trigger engineered moves into premium supply before retracements into discount demand zones.
________________________________________
📌 Key Structure & Liquidity Zones (1H):
• 🔴 SELL ZONE 3,718–3,716 (SL 3,725): Premium resistance where liquidity sweeps may cause short-term rejections targeting 3,710 → 3,700 → 3,690.
• 🟢 BUY ZONE 3,687–3,689 (SL 3,680): Near-term demand zone aligned with channel structure, offering a pullback entry targeting 3,695 → 3,700 → 3,715+.
• 🟢 FVG BUY ZONE 3,654–3,656 (SL 3,647): Deeper discount support, attractive for longer setups targeting 3,670 → 3,685 → 3,700+.
________________________________________
📊 Trading Ideas (Scenario-Based):
🔺 Buy Setup – Pullback to Demand (3,687–3,689)
• Entry: 3,687–3,689
• Stop Loss: 3,680
• Take Profits:
TP1: 3,695
TP2: 3,700
TP3: 3,715+.
🔺 Buy Setup – FVG Sweep (3,654–3,656)
• Entry: 3,654–3,656
• Stop Loss: 3,647
• Take Profits:
TP1: 3,670
TP2: 3,685
TP3: 3,700+
🔻 Sell Setup – Premium Liquidity Run (3,716–3,718)
• Entry: 3,718–3,716
• Stop Loss: 3,725
• Take Profits:
TP1: 3,710
TP2: 3,700
TP3: 3,690.
________________________________________
🔑 Strategy Note
The Fed’s dovish stance and safe-haven flows from geopolitical risks are sustaining bullish momentum, but intraday structure suggests smart money may first engineer stop-runs into premium resistance before retracing toward demand. Maintain buy-the-dip bias at defined support zones, while cautiously fading liquidity sweeps near 3,716–3,718. Volatility could increase as markets await fresh U.S. inflation data and Fed policy remarks.

GOLD – Breakout / Swept High – Where to BUY?1. Market Overview
Gold prices are consolidating around 3655 – 3660 after showing a short-term bearish structure.
On the H1 chart, we can see clear supply and demand zones:
• Liquidity Buy Zone near 3640 (potential demand area).
• Imbalance / Supply Zone around 3670 – 3680.
The broader higher-timeframe trend is still bullish, but in the near term the market is retesting liquidity levels.
________________________________________
2. Key Levels & Zones
• Liquidity Buy Zone: 3640 – 3645 → important support.
• Sell Scalp Zone / Imbalance: 3670 – 3680 → short-term resistance.
• Higher High Target (HH): 3700 – 3710 → strong higher-timeframe resistance.
• Long-term Support: 3620 – 3630.
________________________________________
3. Main Trading Scenarios
🟢 Long Setup (with trend)
• Wait for price to revisit the Liquidity Buy Zone (3640 – 3645).
• If bullish reversal signals appear (pin bar, engulfing candle, etc.), consider entering a Long position.
🎯 Targets:
• Short-term: 3678 (trendline break retest).
• Mid-term: 3700 – 3710 (higher high).
🔴 Short Setup (scalp only)
• If price pushes into the Sell Scalp Zone (3670 – 3680) and faces strong rejection → take a Short scalp.
• 🎯 Target: 3640 – 3645.
⚠ Note: Shorts go against the main bullish trend, so they should be managed quickly and not held for long.
________________________________________
4. Trade Management Notes
• Focus on Long trades near support, as higher timeframe bias is still bullish.
• Short positions should only be taken as scalp setups near resistance.
• Risk control: limit risk to 1–2% per trade, avoid holding trades against the main trend.
________________________________________
📌 Conclusion
Gold (XAUUSD) is currently testing the descending trendline and resistance zone.
• A successful breakout may lead price towards 3700+.
• Otherwise, the market is likely to dip back into 3640 before starting the next bullish leg.

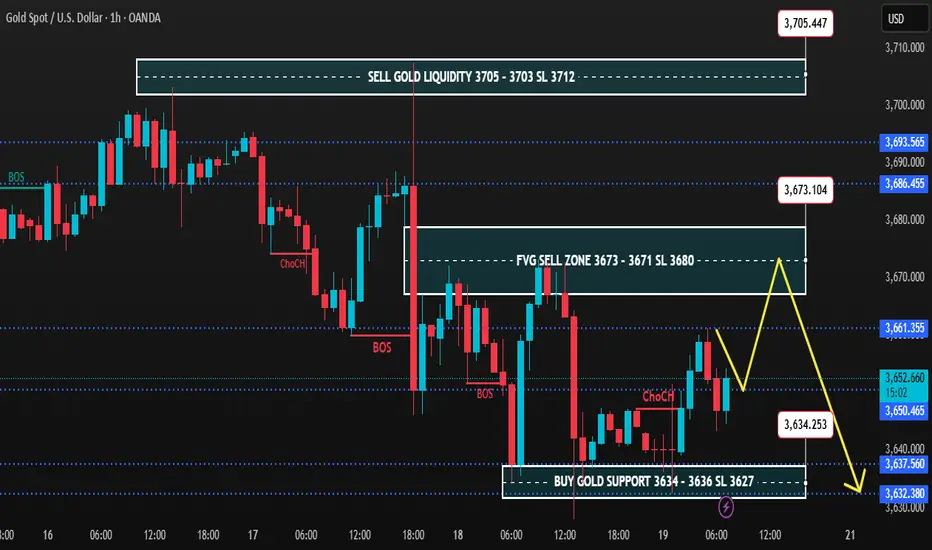
Gold 1H – Risk of Premium Sweeps Before ReversalOn the 1H timeframe, gold is consolidating after consecutive BOS and ChoCH signals, showing rejection from premium levels. The market is oscillating between the fresh FVG sell zone at 3,673–3,671 and the deep discount support at 3,634–3,636. Liquidity remains positioned above 3,705 and below 3,632, keeping scope for engineered sweeps before a clearer directional move emerges.
________________________________________
📌 Key Structure & Liquidity Zones (1H):
• 🔴 FVG SELL ZONE 3,673 – 3,671 (SL 3,680)
Premium intraday pocket for rejection, targeting 3,660 → 3,650 → 3,640.
• 🔴 SELL GOLD LIQUIDITY 3,705 – 3,703 (SL 3,712)
Major premium liquidity trap, likely to precede continuation lower towards 3,690 → 3,675 → 3,660.
• 🟢 BUY GOLD SUPPORT 3,634 – 3,636 (SL 3,627)
Discount demand zone, aiming for recovery towards 3,645 → 3,660 → 3,670 if defended.
________________________________________
📊 Trading Ideas (Scenario-Based):
🔻 Sell Setup – FVG Rejection (3,673–3,671)
• Entry: 3,673 – 3,671
• Stop Loss: 3,680
• Targets:
TP1: 3,660
TP2: 3,650
TP3: 3,640
👉 Expect engineered liquidity grab into the FVG before downside extension.
🔻 Sell Setup – Premium Liquidity Sweep (3,705–3,703)
• Entry: 3,705 – 3,703
• Stop Loss: 3,712
• Targets:
TP1: 3,690
TP2: 3,675
TP3: 3,660
👉 Smart money may sweep highs near 3,705 before resuming bearish leg.
🔺 Buy Setup – Discount Reversal (3,634–3,636)
• Entry: 3,634 – 3,636
• Stop Loss: 3,627
• Targets:
TP1: 3,645
TP2: 3,660
TP3: 3,670
👉 High risk-reward opportunity if gold defends discount demand; suitable for counter-trend scalps.
________________________________________
🔑 Strategy Note
Gold remains under pressure below 3,673–3,705, favouring short setups into premium sweeps. However, close attention is needed at 3,634–3,636, as buyers may attempt to accumulate and reclaim structure. Best practice: trade smaller lots until the New York session provides confirmation of direction.
Gold 1H – Retail Sales Impact Before FedOn the 1H chart, Gold is holding near 3,682 after showing a clear Break of Structure. Liquidity is now seen both above the premium resistance at 3,700 and below the Fair Value Gap demand around 3,669–3,667. With U.S. Retail Sales data due at 19:30 IST today, intraday volatility is expected, but overall positioning is still cautious ahead of the Federal Reserve’s interest rate decision later this week. Traders can look for liquidity sweeps towards premium levels before retracements into demand zones.
________________________________________
📌 Key Structure & Liquidity Zones (1H):
• 🔴 SELL ZONE 3,700 – 3,698 (SL 3,707): Premium resistance likely to trigger rejection towards 3,690 → 3,680 → 3,670.
• 🟢 FVG BUY ZONE 3,669 – 3,667 (SL 3,660): Fair Value Gap demand zone for retracements, targeting 3,680 → 3,690 → 3,700+.
• 🟢 BUY SUPPORT 3,641 – 3,639 (SL 3,632): Deep discount support, targeting 3,655 → 3,670 → 3,685+.
________________________________________
📊 Trading Ideas (Scenario-Based):
🔺 Buy Setup – FVG Reclaim (3,669–3,667)
• Entry: 3,669 – 3,667
• Stop Loss: 3,660
• Targets:
TP1: 3,680
TP2: 3,690
TP3: 3,700+
👉 Look for a liquidity sweep into the FVG zone before New York session begins.
🔺 Buy Setup – Discount Sweep (3,641–3,639)
• Entry: 3,641 – 3,639
• Stop Loss: 3,632
• Targets:
TP1: 3,655
TP2: 3,670
TP3: 3,685+
👉 A good risk-to-reward opportunity if price sweeps stops below structure before Retail Sales release.
🔻 Sell Setup – Premium Liquidity Run (3,700–3,698)
• Entry: 3,700 – 3,698
• Stop Loss: 3,707
• Targets:
TP1: 3,690
TP2: 3,680
TP3: 3,670
👉 Expect engineered stop-runs into premium supply before fading lower.
________________________________________
🔑 Strategy Note
While Retail Sales data may bring short-term price swings, market attention is focused on the Fed. Smart Money is likely to trap both sides of liquidity: fading premium near 3,700–3,698 while accumulating buys at 3,669–3,667 and 3,641–3,639. Trade with smaller positions and confirm with H1 closes before entries.

Gold 1H – Dollar Strength Weighs Ahead of US DataGold on the 1H chart is testing deeper demand zones near 3,612–3,614 after repeated liquidity sweeps into 3,678 and 3,702. Sellers continue to defend premium supply zones, with engineered stop-runs fading quickly. Today’s US data releases and renewed dollar strength keep gold vulnerable to further downside unless discount demand zones show strong defence.
________________________________________
📌 Key Structure & Liquidity Zones (1H):
• 🔴 SELL SCALP 3,678 – 3,680 (SL 3,685)
Premium intraday pocket for rejection targeting 3,675 → 3,670 → 3,665.
• 🔴 SELL ZONE 3,704 – 3,702 (SL 3,711)
Major premium supply trap for engineered sweep before continuation lower toward 3,670 → 3,655 → 3,640.
• 🟢 BUY GOLD SUPPORT 3,616 – 3,618 (SL 3,610)
Fresh deep discount demand zone, targeting recovery into 3,630 → 3,645 → 3,655+ if defended.
________________________________________
📊 Trading Ideas (Scenario-Based):
🔻 Sell Setup – Intraday Premium Rejection (3,678–3,680)
• Entry: 3,678 – 3,680
• Stop Loss: 3,685
• Take Profits:
TP1: 3,675
TP2: 3,670
TP3: 3,665
👉 Expect engineered liquidity grab into premium before NY session.
🔻 Sell Setup – Higher Premium Trap (3,704–3,702)
• Entry: 3,704 – 3,702
• Stop Loss: 3,711
• Take Profits:
TP1: 3,670
TP2: 3,655
TP3: 3,640
👉 Smart money may sweep highs near 3,704 before extending bearish leg.
🔺 Buy Setup – Discount Reversal (3,616–3,618)
• Entry: 3,616 – 3,618
• Stop Loss: 3,610
• Take Profits:
TP1: 3,630
TP2: 3,645
TP3: 3,655+
👉 Strong bounce potential if dollar retraces post-data; favourable risk/reward from deep demand.
________________________________________
🔑 Strategy Note
With US data and dollar strength in focus, gold remains heavy below 3,678–3,704. Favour short setups into premium sweeps, but monitor 3,612–3,614 closely for signs of accumulation. Trade lighter size until direction clarifies post-news.

Gold 1H – Fed Decision Looms After $3,700 BreakOn the 1H timeframe, Gold is consolidating around 3,675 after sweeping through the key $3,700 level. Price briefly touched 3,702 before retreating back into the 3,670s, showing engineered liquidity runs on both sides. With the Fed policy decision expected at 1 AM VN time, volatility is likely to spike. The market remains supported by easing USD, central bank flows, and geopolitical tensions, but short-term positioning indicates possible liquidity grabs before a clear directional move.
________________________________________
📌 Key Structure & Liquidity Zones (1H)
• 🔴 SELL SCALP 3,696 – 3,694 (SL 3,703)
Premium supply pocket for engineered rejection targeting 3,690 → 3,685 → 3,680.
• 🟢 FVG BUY ZONE 3,674 – 3,665 (SL 3,660)
Fair Value Gap demand zone for retracement into structure, targeting 3,685 → 3,695 → 3,700+.
• 🟢 BUY SUPPORT 3,636 – 3,638 (SL 3,630)
Deep discount accumulation zone targeting 3,655 → 3,670 → 3,680+.
________________________________________
📊 Trading Ideas (Scenario-Based)
🔺 Buy Setup – FVG Reclaim (3,674–3,665)
• Entry: 3,674 – 3,665
• Stop Loss: 3,660
• Take Profits:
o TP1: 3,685
o TP2: 3,695
o TP3: 3,700+
👉 Look for liquidity sweep into FVG before NY session/Fed.
🔺 Buy Setup – Deep Discount (3,636–3,638)
• Entry: 3,636 – 3,638
• Stop Loss: 3,630
• Take Profits:
o TP1: 3,655
o TP2: 3,670
o TP3: 3,680+
👉 High risk-to-reward setup if stops are hunted before Fed decision.
🔻 Sell Setup – Premium Trap (3,696–3,694)
• Entry: 3,696 – 3,694
• Stop Loss: 3,703
• Take Profits:
o TP1: 3,690
o TP2: 3,685
o TP3: 3,680
👉 Expect engineered stop-runs into premium before fading lower.
________________________________________
🔑 Strategy Note
Gold’s break above $3,700 highlights strong bullish sentiment, but the Fed decision risk suggests smart money may sweep liquidity both ways. Stay flexible: short from premium zone (3,696–3,694), and defend longs at demand zones (3,674–3,665 and 3,636–3,638). Use lighter position sizing until post-Fed clarity emerges.

FOMC XAUUSD: Time to Hold Super SELL before FOMC🟡 XAUUSD Daily Trading Plan – Ahead of FOMC
📊 Market Context
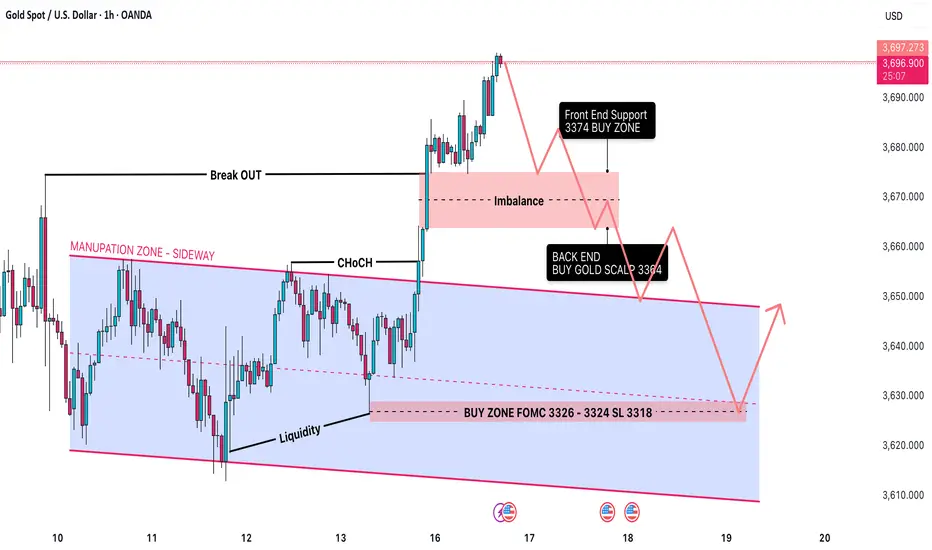
Gold (XAUUSD) has recently moved out of its accumulation/manipulation zone and is now trading in the 3,684–3,690 range.
The market structure is bullish after a Change of Character (CHoCH) followed by a Break of Structure (BOS).
Still, imbalances remain below the present price level, suggesting the possibility of a retracement before further upside continuation.
Liquidity pools are forming around 3,721–3,725, which increases the risk of false breakouts (liquidity traps) near the FOMC.
🔎 Technical Analysis (SMC Perspective)
Structure: Bullish bias on H1/H4, confirmed by higher highs and BOS.
Imbalance Zone: 3,674 → 3,664 (likely to be revisited).
Liquidity Pools:
Buy-side liquidity: 3,721–3,725 (Sell Zone).
Sell-side liquidity: 3,626–3,624 (Equal Low Zone).
🔑 Key Levels
Resistance / Sell Zones
3,686.88 (Immediate resistance)
3,721–3,725 (Liquidity Sell Zone)
Support / Buy Zones
3,668 (Front End Buy – imbalance retest)
3,656–3,654 (Back End CP Buy Zone)
3,626–3,624 (Equal Low Liquidity Zone)
✅ Priority Scenario – BUY
Entry 1
Buy Limit: 3,668 (Front End Zone – imbalance retest)
SL: 3,661
TP: 3,690 → 3,700 → 3,721
Entry 2
Buy Limit: 3,656–3,654 (Back End CP Buy Zone)
SL: 3,648
TP: 3,690 → 3,700 → 3,721
Entry 3
Buy Limit: 3,626–3,624 (Equal Low Liquidity)
SL: 3,618
TP: 3,690 → 3,700 → 3,721
🔻 Alternative Scenario – SELL (Counter-trade)
If the price touches 3,721–3,725 (Liquidity Zone) before revisiting the lower buy zones → look for rejection patterns.
Enter SELL if bearish confirmation appears.
SL: 3,730
TP: 3,698 → 3,690 → 3,676
⚠️ Risk Management & Notes
Expect high volatility during FOMC – liquidity traps are very likely.
Reduce lot size before the news release to minimise risk.
Take trades only with confirmation (avoid blind buys/sells).
Main directional bias: Bullish as long as 3,648 holds.
Gold 4H Outlook – Buy the Dip or Fade the Drop?On the 4H timeframe, Gold is consolidating just below 3,600 after a strong bullish rally. The current structure shows price pausing near premium levels, with liquidity building both above 3,600 and below 3,530. This indicates engineered sweeps are likely before the next major move.
📌 Key Structure & Liquidity Zones (4H):
🔼 Buy Zone 3,572 – 3,574 (SL 3,565): Fresh demand zone at intraday discount; potential continuation level.
🔽 Sell Scalp Zone 3,530 – 3,526 (SL 3,537): Short-term supply/pivot area; scalp opportunity if rejection happens.
📍 Liquidity Magnet 3,603 – 3,605: Upside imbalance area likely to get filled.
📊 Trading Ideas (Scenario-Based):
🔺 Buy Setup – Demand Zone Reaction
Entry: 3,572 – 3,574
Stop Loss: 3,565
Take Profits:
TP1: 3,585
TP2: 3,595
TP3: 3,605
👉 Demand block in line with bullish order flow. Watch for a liquidity sweep and rejection to fuel trend continuation.
🔻 Sell Scalp Setup – Short-Term Reaction
Entry: 3,530 – 3,528
Stop Loss: 3,537
Take Profits:
TP1: 3,520
TP2: 3,510
TP3: 3,500
👉 Intraday supply/pivot area. Best suited for quick scalp trades against the trend, targeting downside liquidity.
🔑 Strategy Note
Overall bias stays bullish, but intraday shorts can work for scalping purposes. The cleaner setup is to buy from 3,572–3,574 for continuation towards 3,600+. Smart money may attempt a liquidity sweep at 3,530 before pushing higher.

Gold 1H – Breakout Liquidity Trap Ahead of ExpansionGold on the 1H timeframe is consolidating around 3,652 after sweeping discount liquidity and reclaiming structure. Price has tapped the breakout zone and is currently trading between the scalp supply in premium and the higher liquidity pools. The structure indicates engineered moves into 3,656–3,658 or deeper liquidity around 3,672–3,674 before the next expansion. Discount demand remains protected at 3,614–3,612.
________________________________________
📌 Key Structure & Liquidity Zones (1H):
• 🔴 SELL ZONE 3,672 – 3,674 (SL 3,679): Premium supply pocket for engineered rejection, targeting 3,660 → 3,650 → 3,640.
• 🔴 SELL SCALP 3,656 – 3,658 (SL 3,663): Short-term premium sweep zone for intraday liquidity grabs, targeting 3,645 → 3,640.
• 🟢 BUY ZONE 3,614 – 3,612 (SL 3,607): Discount demand block aligned with bullish order flow, targeting 3,630 → 3,640 → 3,655.
________________________________________
📊 Trading Ideas (Scenario-Based):
🔻 Sell Setup – Premium Scalp Rejection
• Entry: 3,656 – 3,658
• Stop Loss: 3,663
• Take Profits:
TP1: 3,645
TP2: 3,640
👉 Intraday scalp opportunity if price sweeps into shallow premium liquidity.
🔻 Sell Setup – Deeper Premium Sweep
• Entry: 3,672 – 3,674
• Stop Loss: 3,679
• Take Profits:
TP1: 3,660
TP2: 3,650
TP3: 3,640
👉 Expect an engineered sweep into higher premium before reversal.
🔺 Buy Setup – Discount Demand Reaction
• Entry: 3,614 – 3,612
• Stop Loss: 3,607
• Take Profits:
TP1: 3,630
TP2: 3,640
TP3: 3,655
👉 A high R:R trade if price retraces to the protected demand before expansion.
________________________________________
🔑 Strategy Note
Smart money is likely to manipulate both premium and discount zones near the breakout point. The directional bias favours:
• Scalp sells at 3,656–3,658
• Swing sells at 3,672–3,674
• Discount buys at 3,614–3,612
Strict risk management is essential — expect liquidity sweeps on both sides before the actual expansion.

Gold 1H – Fed Week: Liquidity Sweeps Before FOMCGold on the 1H timeframe is range-bound around 3,643 after a series of ChoCH/BOS prints. Liquidity is stacked above the intraday buy zone at 3,658–3,656 and higher at 3,676–3,678, while discount liquidity sits near 3,615–3,613. With markets pricing a possible Fed cut this week and the dot-plot in focus, expect engineered spikes into premium followed by mean reversion before any sustained move.
________________________________________
📌 Key Structure & Liquidity Zones (1H):
• 🔴 SELL ZONE 3,676 – 3,678 (SL 3,683): Premium resistance for an engineered sweep/rejection targeting 3,665 → 3,655 → 3,645.
• 🟢 BUY ZONE 3,658 – 3,656 (SL 3,651): Intraday demand within prior consolidation targeting 3,665 → 3,670 → 3,675+.
• 🟢 BUY SUPPORT 3,615 – 3,613 (SL 3,610): Discount demand at the base of structure targeting 3,630 → 3,645 → 3,655+.
________________________________________
📊 Trading Ideas (Scenario-Based):
🔺 Buy Setup – Intraday Reclaim (3,658–3,656)
• Entry: 3,658 – 3,656
• Stop Loss: 3,651
• Take Profits:
TP1: 3,665
TP2: 3,670
TP3: 3,675+
👉 Look for a sweep into the zone and an H1 close back above 3,656 to confirm order-flow continuation.
🔺 Buy Setup – Deep Discount Sweep (3,615–3,613)
• Entry: 3,615 – 3,613
• Stop Loss: 3,610
• Take Profits:
TP1: 3,630
TP2: 3,645
TP3: 3,655+
👉 High R:R if liquidity runs into protected demand before the New York session.
🔻 Sell Setup – Premium Sweep to Resistance (3,676–3,678)
• Entry: 3,676 – 3,678
• Stop Loss: 3,683
• Take Profits:
TP1: 3,665
TP2: 3,655
TP3: 3,645
👉 Expect a stop-run above recent highs into premium; invalidate on a firm H1 close above 3,683.
________________________________________
🔑 Strategy Note
Into Fed week, smart money often runs both sides of the book. Bias today favours: discount buys at 3,658–3,656 and 3,615–3,613, and a premium fade at 3,676–3,678. Use reduced size, wait for structure confirmation, and avoid holding through any unexpected Fed headlines or USD spikes.

Gold 1H – Demand Sweep Before Premium ExpansionGold on the 1H chart is currently consolidating near 3,644 after multiple Change of Character (ChoCH) moves, signalling engineered liquidity grabs. Price has formed clear demand footprints around 3,620 and deeper at 3,593, while premium supply is positioned between 3,673–3,680. This suggests a likely retracement into discount demand zones before expansion towards premium liquidity levels.
________________________________________
📌 Key Structure & Liquidity Zones (1H):
• 🔼 Buy Zone 3,620 – 3,618 (SL 3,613): Fresh demand block aligned with bullish order flow.
• 🔼 Buy Zone 3,593 – 3,591 (SL 3,596): Deeper liquidity sweep zone, offering strong risk-to-reward.
• 🔽 Sell Zone 3,673 – 3,671 (SL 3,680): Premium supply pocket, likely to trigger short-term liquidity grabs.
________________________________________
📊 Trading Ideas (Scenario-Based):
🔺 Buy Setup – Shallow Demand Reaction
• Entry: 3,620 – 3,618
• Stop Loss: 3,613
• Take Profits:
TP1: 3,635
TP2: 3,650
TP3: 3,665+
👉 Expect a bounce from shallow demand before retesting premium supply.
🔺 Buy Setup – Deeper Liquidity Sweep
• Entry: 3,593 – 3,591
• Stop Loss: 3,596
• Take Profits:
TP1: 3,610
TP2: 3,625
TP3: 3,645+
👉 Suitable for swing traders targeting higher R:R after liquidity engineering.
🔻 Sell Setup – Premium Rejection
• Entry: 3,673 – 3,671
• Stop Loss: 3,680
• Take Profits:
TP1: 3,660
TP2: 3,650
TP3: 3,635
👉 Scalp trade opportunity at premium supply; overall bias remains bullish, so risk should be managed tightly.
________________________________________
🔑 Strategy Note
The broader bias is bullish, but smart money may drive price into 3,620 or even 3,593 demand zones before expansion. Cleaner setups favour buying dips, while shorts from 3,673 are counter-trend scalps with limited scope.

Gold 1H – CPI Liquidity Play Before ExpansionGold on the 1H timeframe is consolidating near 3,633 after multiple ChoCHs and engineered liquidity grabs. With today’s CPI release, price is expected to sweep both premium and discount liquidity zones. The structure suggests engineered spikes toward 3,688–3,691 or dips into 3,595–3,592 before expansion.
________________________________________
📌 Key Structure & Liquidity Zones (1H):
• 🔴 SELL ZONE 3,643 – 3,645 (SL 3,650): Premium supply pocket for short-term rejection.
• 🔴 SELL ZONE 3,688 – 3,691 (SL 3,696): Premium sweep zone targeting 3,680 → 3,670 → 3,660 → 3,650 with extended open target at 3,625.
• 🟢 BUY ZONE 3,595 – 3,592 (SL 3,587): Discount demand zone targeting 3,615 → 3,625 → 3,635 → 3,645 with extended open target at 3,685.
________________________________________
📊 Trading Ideas (Scenario-Based):
🔻 Sell Setup – Premium Rejection (Intraday)
• Entry: 3,643 – 3,645
• Stop Loss: 3,650
• Take Profits:
TP1: 3,630
TP2: 3,620
TP3: 3,600
👉 Scalp opportunity if CPI spikes price into this supply zone.
🔻 Sell Setup – CPI Premium Sweep
• Entry: 3,688 – 3,691
• Stop Loss: 3,696
• Take Profits:
TP1: 3,680
TP2: 3,670
TP3: 3,660
TP4: 3,650
Open: 3,625
👉 Expect engineered CPI move into premium liquidity before reversal.
🔺 Buy Setup – CPI Discount Sweep
• Entry: 3,595 – 3,592
• Stop Loss: 3,587
• Take Profits:
TP1: 3,615
TP2: 3,625
TP3: 3,635
TP4: 3,645
Open: 3,685
👉 Ideal entry if CPI drives gold into deep discount demand before expansion.
________________________________________
🔑 Strategy Note
CPI will dictate volatility and smart money may sweep liquidity both sides. Key bias favours:
• Scalp sells at 3,643–3,645
• Deeper swing sells at 3,688–3,691
• High R:R buys at 3,595–3,592
Risk management is essential — expect fake-outs before expansion.

Gold 1H – Buy the Dip, Watch 3,687 Premium SupplyOn the 1-hour chart, Gold is trading above 3,650 after a clear break of structure. Price has created demand footprints near 3,636 and deeper at 3,594, while resistance is seen around 3,670 and premium supply is at 3,687–3,689. This indicates a possible engineered retracement into discount demand zones before a move towards liquidity above 3,688.
📌 Key Structure & Liquidity Zones (1H):
• 🔼 Buy Zone 3,636 – 3,634 (SL 3,630): Fresh demand block in line with bullish flow.
• 🔼 Buy Zone 3,594 – 3,592 (SL 3,587): Deeper discount demand, strong base for buyers.
• 🔽 Sell Zone 3,687 – 3,689 (SL 3,694): Premium supply zone, possible liquidity sweep.
📊 Trading Ideas (Scenario-Based):
🔺 Buy Setup – Demand Block Reaction
• Entry: 3,636 – 3,634
• Stop Loss: 3,630
• Take Profits:
TP1: 3,650
TP2: 3,665
TP3: 3,680+
👉 Expect retracement into discount demand before price continues bullish.
🔺 Buy Setup – Deeper Demand Test
• Entry: 3,594 – 3,592
• Stop Loss: 3,587
• Take Profits:
TP1: 3,610
TP2: 3,625
TP3: 3,640+
👉 Best for swing buyers seeking higher risk-reward on a deeper liquidity grab.
🔻 Sell Setup – Premium Rejection
• Entry: 3,687 – 3,689
• Stop Loss: 3,694
• Take Profits:
TP1: 3,670
TP2: 3,655
TP3: 3,640
👉 Short-term liquidity grab at premium levels, good only for scalping with strict risk.
🔑 Strategy Note
Overall bias remains bullish, but smart money may push price into 3,636 or even 3,594 demand zones before expanding higher. Safer setups are buying dips; short positions at 3,687 should be treated only as quick scalps.

Gold 1H – Smart Money Plays Below 3,600Gold on the 1H timeframe is consolidating close to 3,600 after sweeping short-term liquidity. Price is currently forming imbalance around intraday highs, while demand is positioned lower at 3,565. This structure suggests engineered moves designed to trap both buyers and sellers before the next expansion.
________________________________________
📌 Key Structure & Liquidity Zones (1H):
• 🔼 Buy Zone 3,565 – 3,563 (SL 3,560): Discount demand block, aligned with bullish order flow.
• 📍 Scalp Sell Zone 3,594 – 3,596 (SL 3,601): Intraday rejection pocket; scalp opportunity.
• 🔽 Sell Zone 3,630 – 3,628 (SL 3,637): Premium supply zone, suitable for liquidity sweep reaction.
________________________________________
📊 Trading Ideas (Scenario-Based):
🔺 Buy Setup – Demand Block Reaction
• Entry: 3,565 – 3,563
• Stop Loss: 3,560
• Take Profits:
o TP1: 3,585
o TP2: 3,595
o TP3: 3,600+
👉 Expectation is for liquidity sweep into discount demand before resuming bullish trend.
🔻 Sell Scalp Setup – Intraday Reaction
• Entry: 3,594 – 3,596
• Stop Loss: 3,601
• Take Profits:
o TP1: 3,592
o TP2: 3,590
o TP3: 3,585 → 3,580 → 3,570 → 3,560
👉 Short-term liquidity pocket; scalp trades only with strict risk control.
🔻 Sell Setup – Premium Rejection
• Entry: 3,630 – 3,628
• Stop Loss: 3,637
• Take Profits:
o TP1: 3,610
o TP2: 3,600
o TP3: 3,590
👉 Targeting liquidity lying below intraday lows; best for quick short opportunities.
________________________________________
🔑 Strategy Note
Overall bias remains bullish, but smart money may engineer a sweep of 3,626–3,630 supply before driving price back into 3,565 demand. Cleaner setup is to buy dips, while sell scalps are short-lived opportunities.

Gold 05/09: Ready to Scalp the Drop or Buy the Dip?🟢 Market Context
Gold is currently showing a short-term bearish setup after a ChoCH (Change of Character) near 3,536.556. The market is rejecting supply and forming liquidity sweeps around the 3,531–3,533 zone. Expect price to pull lower towards demand areas before the next bullish leg.
📍 Key Levels & Trade Plan
🔴 Intraday Sell (Scalp Opportunity)
• Entry: 3,531 – 3,533
• Stop Loss: 3,535
• Target: 3,485
🟢 Swing Buy Zones
Buy Zone 1: 3,475 – 3,477
o Stop Loss: 3,470
o Target: 3,508 – 3,526
Buy Zone 2 (Deeper Discount): 3,441 – 3,443
o Stop Loss: 3,435
o Target: 3,500+
⚖️ SMC Bias
• Short-term: Bearish scalp from supply zone.
• Mid-term: Looking for liquidity grab and bullish reversal at demand zones.
• Long-term: Maintaining bullish order flow as long as deeper demand (3,441) holds.

Gold 04/09 – Smart Money Setup: Sell Scalp, Prep for Buy Zones🟢 Market Context
Gold is currently reflecting a short-term bearish setup after a Change of Character (ChoCH) near 3,536.556. The market is reacting from supply and creating liquidity sweeps around the 3,531–3,533 zone. We anticipate the price to move lower towards demand areas before the next upward push.
📍 Key Levels & Trade Plan
🔴 Intraday Sell (Scalp Trade)
Entry: 3,531 – 3,533
Stop Loss: 3,535
Target: 3,485
🟢 Swing Buy Zones
Buy Zone 1: 3,475 – 3,477
Stop Loss: 3,470
Target: 3,508 – 3,526
Buy Zone 2 (Deeper Discount): 3,441 – 3,443
Stop Loss: 3,435
Target: 3,500+
⚖️ SMC Bias
Short-term: Bearish scalp from supply zone.
Mid-term: Expecting liquidity grab and bullish reversal at demand zones.
Long-term: Bullish order flow intact as long as deeper demand (3,441) is respected.

Gold 03/09 – Smart Money Playbook: Buy the Dip, Sell the High🟢 Market Context
Gold continues to show a bullish trend with multiple BOS (Break of Structure) and ChoCH (Change of Character) confirmations. The price is currently consolidating around the 3,533–3,540 range, with a noticeable FVG (Fair Value Gap) below. The market is likely to sweep liquidity before making another upward move.
📍 Key Levels
• Resistance (Sell Zones): 3,564 | 3,575–3,576 | 3,586 | 3,595
• Support (Buy Zones): 3,528 | 3,508 | 3,494 | 3,480–3,478 | 3,468
🛠️ Trade Ideas
✅ Buy Zone (Intraday Swing)
• Entry: 3,480 – 3,478
• SL (Stop Loss): 3,473
• TP (Take Profit): 3,485 – 3,490 – 3,500 – 3,515 – 3,520 – 3,530
📌 Expectation: Price is expected to fill the FVG and react from the demand zone before resuming its upward trend.
✅ Buy Scalp (Quick Reaction)
• Entry: 3,501 – 3,503
• SL (Stop Loss): 3,491
• TP (Take Profit): 3,510 – 3,525 – 3,545 – 3,550
📌 Expectation: A short-term liquidity grab above the 3,500 psychological level, leading to a bullish push.
❌ Sell Zone (Countertrend Play)
• Entry: 3,575 – 3,573
• SL (Stop Loss): 3,582
• TP (Take Profit): 3,565 – 3,555 – 3,545 – 3,530 – 3,520
📌 Expectation: A strong supply zone where smart money may target liquidity before a price reversal.
🔑 SMC Insights
• BOS confirms a bullish bias, but the price may pull back to address the FVG imbalance.
• Liquidity is likely to be present around 3,480–3,500 before a push towards 3,575 or higher.
• High probability of buying at demand zones (dips) and selling at extreme supply zones.

Will Gold Return to 3400?Market Context
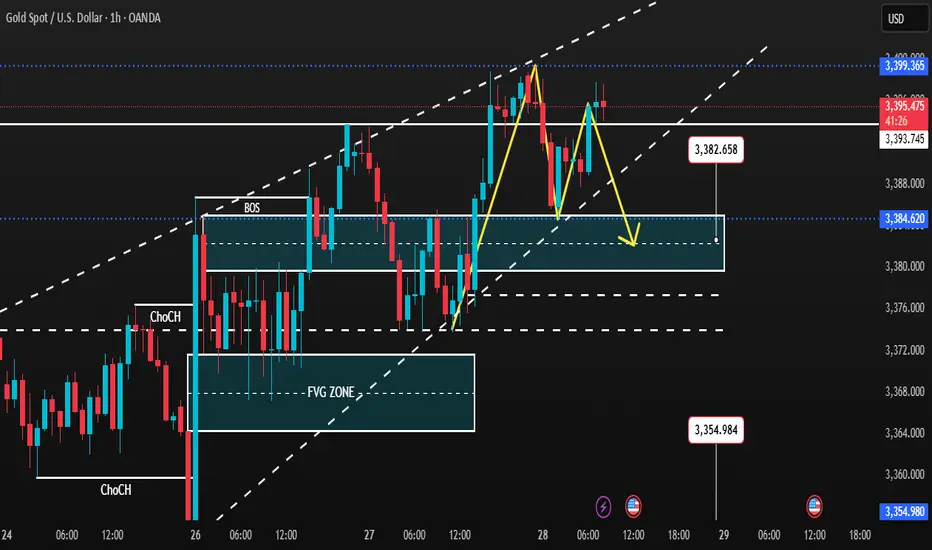
Price has registered multiple bullish break of structure, confirming short-term bullish momentum.
A supply zone around 3449 – 3451 may trigger liquidity-driven reactions.
The fair value gap between 3360 – 3310 is still open and could pull price down before continuation.
Key Levels
Supply Zone: 3449 – 3451
Buy Zone 1: 3396 – 3400 (Stop Loss: 3390)
Buy Zone 2: 3310 – 3315 (Stop Loss: 3303)
FVG Zone: 3360 – 3310
Trading Scenarios
Primary Buy Setup
Entry: 3396 – 3400
Stop Loss: 3390
Target: 3449 – 3460 liquidity sweep
Secondary Buy Setup
Entry: 3310 – 3315
Stop Loss: 3303
Target: 3396 – 3449
Counter-trend Sell
Entry: 3449 – 3451, provided rejection is visible
Stop Loss: above 3458
Target: 3400 demand
Summary
The overall bias stays bullish with two key demand zones in play: 3400 for a shallow retracement and 3310 for a deeper liquidity sweep. Short positions near supply remain valid only as quick counter-trend trades.

Gold 29/08: Smart Money Looks at 3444 or 3395 LevelsMarket Context (SMC View):
Gold faced rejection from the 3423 liquidity zone and is now pulling back.
Demand is seen near 3397–3395, which can give a bounce if price tests it.
Premium supply zones above 3422 and 3442 are good areas to look for selling opportunities.
🔼 BUY SCENARIO
Buy Zone: 3397 – 3395
Stop Loss: 3389
Targets: 3405 → 3415 → 3425
🔽 SELL SCENARIO 1 (Price Action)
Sell Zone: 3422 – 3424
Stop Loss: 3430
Targets: 3412 → 3400
🔽 SELL SCENARIO 2 (Swing)
Sell Zone: 3442 – 3444
Stop Loss: 3452
Targets: 3425 → 3412 → 3400
📌 Conclusion & Notes
Bias: Buy near 3397–3395, then watch for possible liquidity grabs at 3422–3424 or a bigger sweep near 3442–3444 to go short.
Key Levels: 3422–3424 is the first intraday supply zone, while 3442–3444 is the major swing sell zone.
Tip: Wait for rejection candles or confirmation before selling.
Risk: Gold is very volatile; use strict stop losses and manage capital carefully.

Divergence has appeared at H4 – TOP IS ABOUT TO BE FORMEDGold SMC Daily Plan – 28/08
Market Context (SMC view):
Gold is trading near 3395–3396 after a sharp bullish rally. Early bearish divergence is visible on H4, hinting at a short-term top.
Key resistance is at 3400 – a clean breakout above may trigger liquidity sweep towards 342x–343x, retesting the old ATH.
On the downside, if 3370 support breaks, price may correct deeper into 335x BUY zone for a strong bullish setup.
Key Levels:
Resistance: 3396–3400 (Sell Zone), 342x–343x (Liquidity sweep area)
Support: 3370, 3354–3352 (Buy Zone), 3325 (SL for longs)
SMC Zones & Liquidity Pools:
BUY ZONE 1: 3354–3352 (below liquidity sweep under 3370)
SL: 3347
TP: 3365 → 3375 → 3385 → 3395 → 3400+
BUY ZONE 2: 3380–3382
SL: 3374
TP: 3390 → 3400 → 3415 → 3430 → 3450+
SELL ZONE: 3408–3410 (above recent high)
SL: 3416
TP: 3390 → 3380 → 3375 → 3360
Trading Plan & Scenarios:
Sell Setup (Primary Bias – Divergence Play):
Look for liquidity grab above 3396–3399 (into resistance).
Enter short with SL above 3403.
Partial profits at 3390–3380–3375; keep runner towards 3360 if support breaks.
Buy Setup (Counter Play – Break & Retest):
If price dips into 3354–3352 BUY zone, wait for bullish confirmation (choch/BOS on lower TF).
Enter long with SL below 3347.
Targets: 3365 → 3375 → 3385 → 3395 → 3400+
Confluences:
H4 bearish divergence signalling possible exhaustion at top.
Liquidity pools above 3396 and below 3370 remain untapped.
FVG and imbalance align with 335x buy zone.
Gold 27/08: Smart Money Targets 3405 or Sweeps 3355?Gold SMC Daily Plan – 27/08
Market Context (SMC View):
Price is consolidating around 3378, holding the liquidity trendline with multiple BOS and ChoCH, indicating strong smart money activity.
Key resistance: 3393–3406 (supply & liquidity pool).
Key support: 3352–3358 (demand zone) with an Order Block (OB) near 3325.
A possible liquidity sweep could happen above 3405 or below 3355 before confirming the next trend move.
📊 Key Liquidity Zones & Entries
✅ Sell Zone: 3402–3406
SL: 3410
TP: 3390 → 3380 → 3360
✅ Buy Zone 1: 3352–3358
SL: 3345
TP: 3360 → 3375 → 3385 → 3395
✅ Buy Zone 2 (intraday pullback): 3376–3380
SL: 3370
TP: 3385 → 3395 → 3405
SMC Scenarios for 27/08
Scenario 1 – Liquidity Grab at Resistance:
If price sweeps 3402–3406, look for fake breakout signals.
Short from this zone with the TP levels mentioned above.
Scenario 2 – Buy on Dip (Demand Zone):
If price retraces deeper to 3352–3358, wait for bullish confirmation to go long.
If price respects the trend and holds 3376–3380, consider intraday buy opportunities.
SMC Notes:
Focus on buying dips unless a liquidity grab occurs first at 3402–3406.
Keep an eye on price action near the trendline & OB at 3325 for potential high-probability reversal setups.
