Stock Analysis - chart pattern analysis & fundamepinchStock Analysis - step by step for Algoquant Fintech Ltd.
Chart & Price Action Analysis (Weekly Chart)-:
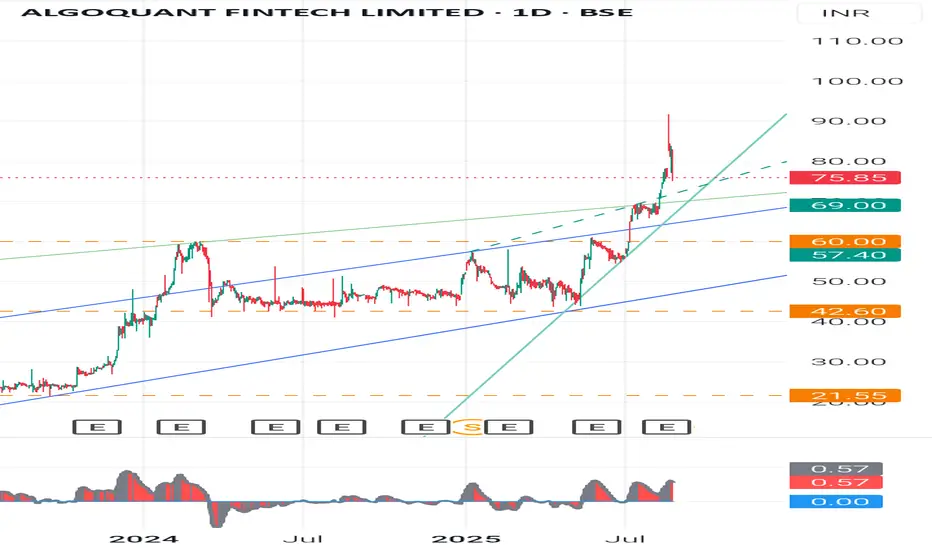
-Current Price: 78.95 (-3.84%)
+Recent Move: Stock gave a strong breakout above its long consolidation channel ( 42- 69).
-Candlestick: The latest candle is a long wick candle after a strong breakout - This signals profit booking after a sharp rally.
- Support Levels
69 - Recent breakout retest zone
60 - Strong support from previous swing highs
42.6 - Major base support (long-term)
- Resistance Levels
85- 88 - Immediate resistance (due to long upper wick supply)
100+ - Psychological round level
120 - Next major target if momentum sustains
🕯️ Candlestick & Swing Analysis
Pattern: Breakout candle with long wick - suggests short-term profit booking, but trend remains positive.
Swing Trend: Stock formed higher highs & higher lows since mid-2023, a sign of strong uptrend.
Risk: If it falls below 69 on weekly closing, trend may weaken.
- Fundamental Comparison (with Fintech peers like Infibeam Avenues, IndiaMart, and small fintech players)
Metric Algoquant Fintech Infibeam Avenues IndiaMart Intermesh
P/E Ratio Very High (Loss-making / low EPS stage) -38x -45x
Revenue Growth Very high (small base effect) Moderate Stable
Debt Low Low Very Low
Business Stage Emerging (High growth, high risk) Mid-sized, stable Established, B2B stronghold
👉 Learning: Algoquant is in an early stage compared to peers - higher growth potential but also higher risk.
📘 Basic Learnings for Students (Investment Education)
1. Candlestick Learning - Long upper wicks after breakout = profit booking - watch for retest of breakout levels.
2. Swing Analysis - Trend is up as long as higher highs-higher lows structure is maintained.
3. Chart Pattern - Breakout from long channel = momentum can continue if volumes sustain.
4. Fundamental Insight - Always compare with industry peers on P/E, revenue growth, debt, margins.
5. Risk Management - In emerging companies, volatility is high. Always keep a stop-loss.
⚠️ Disclaimer
This analysis is for educational purposes only. It is not investment advice. Stock markets are subject to risks. Please do your own research (DYOR) or consult a SEBI-registered advisor before investing.
#Algoquant #FintechStocks #StockMarketIndia #TechnicalAnalysis #CandlestickPatterns #SwingTrading #InvestingForBeginners #FundamentalAnalysis #StockMarketEducation #DYOR
Dailyanalysis
GBPCHF – Could This Be the Start of a Bullish Comeback?Looking at GBPCHF right now, it feels like the market is finally speaking my language.
After an extended downtrend, price has landed on a major support zone visible on the higher timeframes — a zone that’s been tested and respected multiple times before. We're now seeing early signs of rejection from that area, and I’m eyeing a potential move back up toward 1.1000.
What makes this setup stand out isn’t just the technicals — it’s the patience behind the play. I waited for the sell-off to complete, for price to return to a proven zone, and now I’m watching for signs of strength to kick in. This type of setup? I’ve seen it play out time and time again in my previous chart work.
Drop your thoughts in the comments — do you see the same potential, or are you taking a different side of the trade?

Jul 18: EUR/CAD Daily ViewEUR/CAD is trading in Monthly curve EQ. If we see a uptrend in Daily/4Hour we can plan a Long trades till Daily Supply. We are in a low of Daily Demand we should be anticipating strong upside move for few days.
Todays Plan:
Look for good 1H/4H setup for the upside.

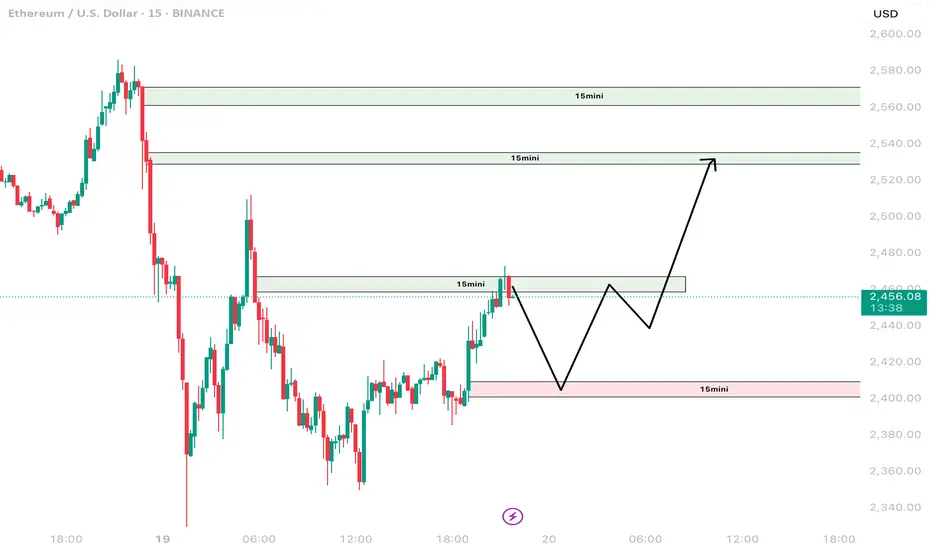
ETHEREUM | Technical Analysis 20th May 2025Hi,
I am sharing my daily view on ethereum for 20th May, 2025.
If you like my analysis then please share and like this post.
Disclaimer: This is only for educational purpose.
Thanks.
EUR/USD - 02/04/2025🔥 D1:
🔹 In my view, the Daily supply zone is still holding price well.
🔹 I'm leaning towards a bearish scenario, but need lower timeframes to confirm.
🔥 H4:
🔹 Price has broken structure (BOS) and might retrace to the H4 supply zone (~1.0900-1.0920) before continuing down.
🔹 If it reacts well in this zone, I'll look for sell opportunities following the main trend.
⚠ Note: USD might be volatile before tomorrow’s news, so stay alert.
📊 Plan:
✅ Wait for price to reach the H4 supply zone and confirm a reaction before entering.
✅ Manage risk properly, avoid jumping in too early.
💹 If you share the same view, wait for signals and let's trade together! 🔥🔥🔥

Gold Next Move 3200?🔎 15-Minute Chart (Intraday Analysis)
50 EMA as Dynamic Support:
Price is respecting the 50 EMA (red line), indicating bullish strength.
📈 Support Levels:
$3,099 & $3,087 - Strong support zones for a possible bounce.
$3,071 - Deeper support if price pulls back further.
• Current Price Action:
• Price is pushing higher but approaching resistance.
📌 Conclusion: If the 50 EMA holds, price could continue its upward move. If it breaks, we may see a pullback toward $3,099 or lower.
🔎 1-Hour Chart (Short-Term Targets & Ranging Market)
⚠️ Breakout from Ranging Market:
• Price was consolidating in a range around $3,098 - $3,120 before breaking out.
Fibonacci Targets:
• 1st Target: $3,141 (already reached).
• 2nd Target: $3,162 (next potential level).
Support & Resistance Levels:
📉 Resistance: Near $3,141 - $3,162 (Fib targets).
📈 Support: Around $3,098 and $3,087 (marked with red and green lines).
📌 Conclusion: The breakout is bullish, and if price holds above $3,141, it may push toward $3,162. A break below $3,098 could signal a retracement.
🔎 4-Hour Chart (Trend & Key Levels)
Trend: Strong uptrend inside an ascending channel.
Buy Entry & Exit Points:
• A Buy was placed near the lower trendline.
• Buy Exit was taken at a key resistance level before a pullback.
• POI (Point of Interest) Level:
• A demand zone (light blue area) around $2,980 - $3,000, where price previously reacted.
Moving Averages:
• The 50 EMA (red line) is acting as a dynamic support.
• The 200 EMA (blue line) is providing long-term support.
Resistance & Support Levels:
📉 Resistance: Near $3,150 (upper trendline).
📈 Support: Around $3,059 and $2,980 (marked green lines).
📌 Conclusion: Price is moving towards the upper trendline. If it breaks, we could see more bullish momentum. If rejected, a pullback toward POI is likely.
🔹 Overall Market Summary & Trading Plan
✅ Bullish Bias: Price is in an uptrend on multiple timeframes.
✅ Next Resistance: $3,150 - $3,162 (watch for rejection or breakout).
✅ Pullback Zone: $3,098 - $3,087 (potential buy area).
🚨 Risk Management: If price breaks below $3,087, a deeper retracement may occur.
📌 Trade Idea:
🟢 Long Entry: On pullbacks to $3,098 - $3,087.
🎯 Target: $3,150 - $3,162.
❌ Stop Loss: Below $3,071 for risk control.
👉 Always follow TP/SL to protect your capital and maximize profits!
Stay tuned for updates once the confirmations are in place!
Please support me with your likes and comments to motivate me to share more analysis with you and share your opinion about the possible trend of this chart with me !
📢 Best Regards , Silver Wolf Traders Community
Disclaimer: This is for educational purposes only.
Always trade responsibly and manage your risk effectively

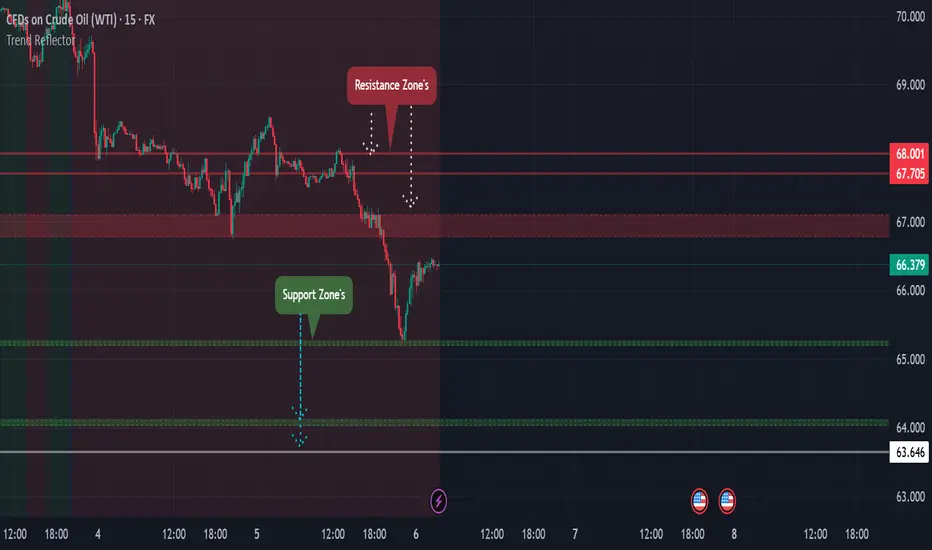
USOIL chart pattern for upcoming session of Thursday 15M TFIn the last session USOIL closed at 66.379 (2.4%) down and made of low of 65.208 , i've looked the chart on every TF and i've figured out some important levels of the crude ,on looking at the closing and price action formed our Near and major resistance zone is 66.795 - 67.090 this is a big zone but major zone and after that we've got the next resistance at 67.705 and the next one is 68.000 -68.105 , while looking at the chart in higher TF now market is going to compress or outburst for alternative scenario we've got some support zone's 65.259 - 65.200 is the level of support zone and it's also almost the low level of last session after that next support we've got on looking at every TF is 64.040 - 64.140 and after that 63.646 is the level which hold's some support , these are the level's which i got while studying the chart until new one is formed so we've to very clear here watch out every zone and level and look how price react's to it i've already told you how to trade in rejection and continuation pattern in our previous idea's ( and yeah sorry for typing mistake of level's and zone's in last USOIL idea published ) and i request every follower to avoid trading in news time ,now let's see how market react's on these levels.
#CANTABIL - Breakout Soon Candidate! /Feb'25/ 📊 Script: CANTABIL
Key highlights: 💡⚡
📈 C.E.S.T – refer image
🟢 If you have any questions regarding the setup, please feel free to leave your inquiries in the comments, and I will respond promptly.
BUY ONLY ABOVE 315 DCB
⏱️ C.M.P 📑💰- 284
🟢 Target 🎯🏆 – NA%
⚠️ Stoploss ☠️🚫 – NA%
⚠️ Important: Always Exit the trade before any Event.
⚠️ Important: Always maintain your Risk & Reward Ratio.
✅#Boost, #Like & #Follow to never miss a new idea! ✅
Disclaimer: I am not SEBI Registered Advisor. My posts are purely for training and educational purposes.
Eat🍜 Sleep😴 TradingView📈 Repeat 🔁
Happy learning with MMT. Cheers!🥂

GOLD (XAUUSD) Daily Update !!!Gold prices are showing resilience after finding support in the $2,725-$2,730 zone. The metal is currently trading near its minor resistance at $2,770, indicating potential for further gains. A breakout above this level could open the path toward the $2,790 mark, which remains a significant barrier. On the downside, gold may see a correction toward the $2,750-$2,745 region, but these levels are likely to serve as buying opportunities...
Selling pressure is likely to emerge near $2,770 if the price fails to break higher. However, given the strong support at lower levels, downside moves may be limited....

Analysis of Banknifty for 14 jan 2025Today bank nifty broke its 48,800 support level. Next possible support will be between 46,900 to 46,300

Euro Weekly SetupEURUSD weekly setup suggesting major short.
charts shows some rally on long expected just to enter short from level 1.05900 for target 1.03350

NHPC 1D T FNSE:NHPC is near a demand zone which has multiple touch points making it stronger. This can be traded either up or down. We can wait for confirmations from the price and then we can get into the trade
Disclaimer:- This analysis is only for educational purpose. Please always do your own analysis or consult with your financial advisor before taking any kind of trades

JIOFIN 1D TFNSE:JIOFIN , In the previous post discussed the stock broke a demand zone with strong bearish candle, but is now forming a stong bullish candle.This could be possible liquidity grab. This is a risky entry but could be traded for a 1:1.5 R:R.
We have discussed this more on our previous post. You can view the previous post by clicking the attachment below this post.
Disclaimer:- This analysis is only for educational purpose. Please always do your own analysis or consult with your financial advisor before taking any kind of trades

NTPC 1D TFNSE:NTPC has broken a trend line which I have posted in previous post. The stock could be have been traded in two ways.
Trade 1:
Entering the market as soon as the stock broke the trend line.
The stock has reached 1:1.5 and is running in profit.
Trade 2:
Waiting for another bearish candle or a retracement. The stock formed another bearish candle and If I have traded below that the stock is running in profit and I am waiting for the market to achieve a 1.5 reward.
We have discussed this more on our previous post. You can view the previous post by clicking the attachment below this post.
Disclaimer:- This analysis is only for educational purpose. Please always do your own analysis or consult with your financial advisor before taking any kind of trades

JIOFIN 1D TFAs we discussed in the previous posts NSE:JIOFIN has broken down a strong demand zone. A trade can be taken here with good profits.
We have discussed this more on our previous post. You can view the previous post by clicking the attachment below this post.
Disclaimer:- This analysis is only for educational purpose. Please always do your own analysis or consult with your financial advisor before taking any kind of trades

GAIL 1D TFNSE:GAIL has retraced from a demand zone and has gained liquidity and is coming down again. We could take entry with a R;R of 1:1.5. And the possibility of this trade winning is more as there are many confirmations associated with this one.
Disclaimer:- This analysis is only for educational purpose. Please always do your own analysis or consult with your financial advisor before taking any kind of trades

TATASTEEL 1D TFAs discussed in the previous post NSE:TATASTEEL was moving around a trend line which it has broke down now. The stock could be traded with strong confirmations only.
We have discussed this more on our previous post. You can view the previous post by clicking the attachment below this post.
Disclaimer:- This analysis is only for educational purpose. Please always do your own analysis or consult with your financial advisor before taking any kind of trades

TATAPOWER 1D TFNSE:TATAPOWER broke a trend line and is moving around a demand zone. The market need strength to break this demand zone hence waiting for the entry is good. If the market breaks the demand zone with a good candle or if a retracement occurs the entry could be taken.
We have discussed this more on our previous post. You can view the previous post by clicking the attachment below this post.
Disclaimer:- This analysis is only for educational purpose. Please always do your own analysis or consult with your financial advisor before taking any kind of trades

VEDANTA 1D TFNSE:VEDL has broken down a trend line pattern with a good bearish candle. The trade could be taken with a good risk and reward.
Disclaimer:- This analysis is only for educational purpose. Please always do your own analysis or consult with your financial advisor before taking any kind of trades

PFC 1D TFWe've spoke about NSE:PFC forming a triangular pattern in the previous post. Now the stock is moving up breaking the triangular pattern. But I would wait for a retracement or another strong bullish candle in order to enter this trade.
We have discussed this more on our previous post. You can view the previous post by clicking the attachment below this post.
Disclaimer:- This analysis is only for educational purpose. Please always do your own analysis or consult with your financial advisor before taking any kind of trades

POWERGRID 1D TFIn the previous post, I've posted that NSE:POWERGRID is in a demand zone and will retrace. But the market hit stoploss in that trade. Now we can clearly see that NSE:POWERGRID has gained liquidity and moving up. Though a strong bullish candle can be seen. This is a risky entry. Hence be cautious and look for confirmations before entering the trade.
We have discussed this more on our previous post. You can view the previous post by clicking the attachment below this post.
Disclaimer:- This analysis is only for educational purpose. Please always do your own analysis or consult with your financial advisor before taking any kind of trades

NTPC 1D TFAs discussed in the previous post, NSE:NTPC has broke down a trend line and is moving down. But i would wait for multiple confirmations (a retracement for example) in order to enter this stock. As the trendline is not too strong, waiting for a strong confirmation is good before entering the trade
We have discussed this more on our previous post. You can view the previous post by clicking the attachment below this post.
Disclaimer:- This analysis is only for educational purpose. Please always do your own analysis or consult with your financial advisor before taking any kind of trades

BEL 1D TFAs we discussed in the previous post, NSE:BEL is trading in parallel zone pattern and can break out at any moment.As nifty is also moving up from an support zone I hope the chart will move on the upside. With proper confirmations this trade could be taken with a good R:R.
The link to the previous post is attached below..
Disclaimer:- This analysis is only for educational purpose. Please always do your own analysis or consult with your financial advisor before taking any kind of trades
