NAZARA TECHNOLOGIES - Bullish Flag & Pole Breakout (Daily T/F)Trade Setup
📌 Stock: ( NSE:NAZARA )
📌 Trend: Strong Bullish Momentum
📌 Risk-Reward Ratio: 1:3 (Favorable)
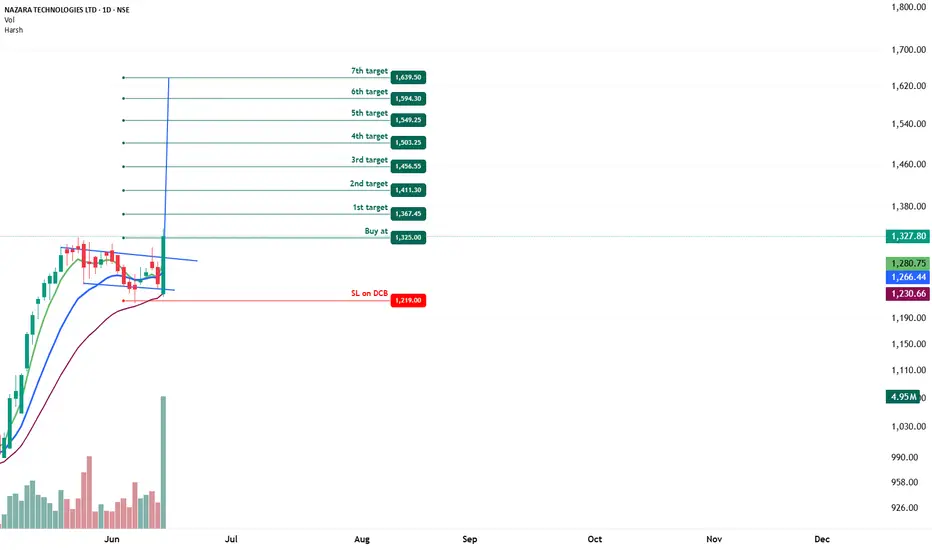
🎯 Entry Zone: ₹1325.00 (Breakout Confirmation)
🛑 Stop Loss: ₹1219.00 (Daily Closing Basis) (-12 % Risk)
🎯 Target Levels:
₹1367.45
₹1411.30
₹1456.55
₹1503.25
₹1549.25
₹1594.30
₹1639.50 (Final Target)
Technical Rationale
✅ Bullish Flag & Pole Breakout - Classic bullish pattern confirming uptrend continuation
✅ Strong Momentum - Daily RSI > 60, Weekly RSI >60 mONTHLY rsi ABOVE 60
✅ Volume Confirmation - Breakout volume 4.95M vs previous day's 946.53K (Nearly 4.5x surge)
✅ Multi-Timeframe Alignment - Daily and weekly charts showing strength
Key Observations
• The breakout comes with significantly higher volume, validating strength
• Well-defined pattern with clear price & volume breakout
• Conservative stop loss at recent swing low
Trade Management Strategy
• Consider partial profit booking at each target level
• Move stop loss to breakeven after Target 1 is achieved
• Trail stop loss to protect profits as price progresses
Disclaimer ⚠️
This analysis is strictly for educational purposes and should not be construed as financial advice. Trading in equities involves substantial risk of capital loss. Past performance is not indicative of future results. Always conduct your own research, consider your risk appetite, and consult a financial advisor before making any investment decisions. The author assumes no responsibility for any trading outcomes based on this information.
What do you think? Are you watching NSE:NAZARA for this breakout opportunity? Share your views in the comments!
Dailybreakoutpattern
Flag Breakout in PSU Metal Stock with 20% upsideHi,
NSE:SAIL has given a Bullish Flag Breakout on Daily charts with very good volume.
MACD is also on the bullish side on daily, weekly and monthly time frames.
RSI is also on the bullish side on daily and weekly time frames.
In the current market scenario I am expecting that the bullish momentum will continue.
Complete price projection like entry, stoploss and targets mentioned on the charts for educational purpose.
Please share your feedback or any queries on the study.
Disclaimer: Please consult your financial advisor before making any investment decision.

Daily Bullish Flag Breakout in CSB BANKHi,
NSE:CSBBANK has given a Bullish Flag Breakout on Daily charts with very good volume.
MACD is also on the bullish side on daily and monthly time frames. RSI is also on the bullish side on daily and weekly time frames.
In the current market scenario I am expecting that the bullish momentum will continue.
Complete price projection like entry, stoploss and targets mentioned on the charts for educational purpose.
Please share your feedback or any queries on the study.
Disclaimer: Please consult your financial advisor before making any investment decision.
