Hindalco AnalysisThere was a Breakout in channel pattern in the daily time frame + triangle pattern breakout.
.
Planning on shorting it for intraday tomorrow.
Dailychart

ASIANPAINTS ----- Daily Chart Analysis I HAVE DONE ANALYSIS ON ASIAN PAINTS BEFORE.... IT WORKED WELL CHECK IT OUT TOO GUYS !
we have a clear trendline breakout with a spiking volume
wait for retracement and then enter for LONG.
There is a clear support zone check it out too before entering
follow #tradethetip for more amazing educational analysis analysis

Bought ULTRACEMO ----- Daily Analysis 1.resistance breakout with huge volume
2.retracement is almost done
3. look for buying opportunities only
4. bullish hammer pattern is formed at lower trendline
follow #tradethetip

Daily Bajaj Finance Ltd Wolfe Wave Chart Daily Bajaj Finance Ltd Wolfe Wave Chart
Strong Resistance At Current High : 3125
Strong Sell Sign At Point : 2950-2975 Near
Take Profit 1 : 2700
Take Profit 2 : 2500
Stoploss : 3125 ( Current High)
Please Note :
1. Always do trading as per your Reward to Risk ratio means Never risk more than you can afford to lose on a single trade.
2. Please keep patience & wait for the levels means Sit and wait for the right opportunity.
3. Request to like & follow for more such ideas of technical analysis learning.
4. The idea sharing is for educational purpose only.
5. In case any suggestion advice required feel free to ask .
Thank You !

Axis Bank Creates the Triangle PatternAxis Bank Creates the triangle pattern on a daily basis last if Break the 370 then take support near 350 and go up but in upside very low chance if this time break 350 then come to 325-300 and if go up then cross and close above 415 then come to 440 and cross with volume then come to 465-480 in next session so take this level in your mind and trade.

Aurobindo Pharma Limited - Beyond 52 Week HighAUROPHARMA
Aurobindo Pharma Limited had breached prior 52 Week High 734.80 successfully. Increased volume backing the momentum.
Technical Indicators are Bullish.
Time-trend Indicator is Bullish.
Currently, the stock is moving in a rising channel. Once it breaks out of the channel with Volume, a further upmove is expected.
Swing Low of 698 is the nearest Support.
KEEP AN EYE!! #B+
#tradingedge_academy #SMTA_institute

MOTHERSUMI technical analysis. Possible down move.Hello Trader, Here is the full analysis of MOTHERSUMI:
1) On the Daily chart we can see it as formed butterfly pattern and is inside raising wedge ( Bearish pattern ).
2) Price is testing a strong resistance zone and can test this zone for up move and if it fails then on the basis of butterfly and strong resistance one can look for short.
How can you support me:
1) Like my idea.
2) Follow me for more analysis
Feedback:
Please share your feedback in comments and this will help me to improve my drawing and analysis
M

Bajaj Auto - ShortBajaj Auto is in a DT in Weekly / Daily TF, and is taking support on Daily support of 2417. this support line has been tested several times, and therefore has become important support.
if this support breaks and the candle sustains, it would be a good candidate to go short.

Elliott Wave : Nifty 50 - Motive phaseI have plotted only motive phase & will update for corrective phases. I think NIFTY will make the bottom around the 6800 zone. While forecasting the exact bottom is nearly impossible but we can use it to take short term positional trade.
In two of my previous Nifty 50 charts, I have described how bearish candlestick is forming near Elliott wave 4. This further boost our confidence to take short positions.
Assumption:
I am assuming the fall between Feb 10 to 13 March 2020 was biggest fall of this Elliott Wave.


BTC USD DAILY ANALYSISBTC USD DAILY ANALYSIS
IF YOU LIKE THIS ANALYSIS THEN PLEASE SUPPORT BY CLICK ON LIKE
THANKS

Sell Opportunity in USDJPYPrice rejected at key level and printed a Price Action bar. expecting move upto 101. Keep the 1st target is 104.960 and then move the SL to BE.

tata global , near the first support of 369 !!!Looks weak for currently- closing basis must be above 370 then only a good option to long other wise , bearish for the short term.
support zone , 369-68
T

IShort


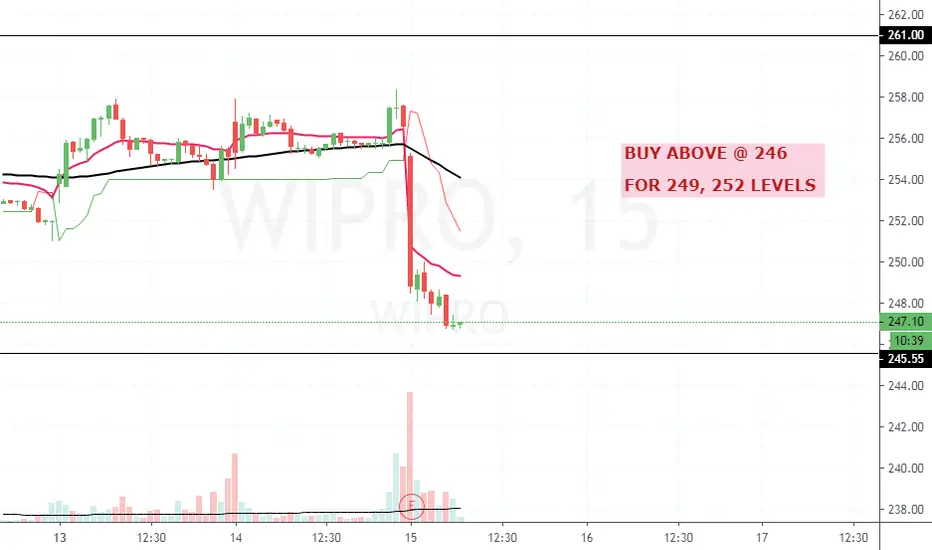
LONG WIPROON VERY STRONG DEMAND ZONE SO MAY GET BUYERS AND AGAIN RETEST MENTIONS LEVELS IN A BOUNCE. LEVELS MENTIONS ON CHART.

ICICI BANK SHORT ICICI BANK FORM DARK CLOUD COVER CANDLE PATTERN ON DAILY CHARTS WHICH IS VERY BEARISH SIGNAL.
THOSE WHO WANT TO TRADE LEVELS ARE MENTIONS ON CHART.

N


INDUSIND BANK LIMITED EDUCATIONAl IDEADaily chart making Lower Highs, expecting more downward momentum for September series.
Trade Plan :-
- Only consider shorting/buying put options if close below 1400.
- If above condition satisfied, Buy 1350 put option for September expiry (CMP 45). Target - 57 / 66 / 70.
- Keep SL if daily close of spot above 1450.
- View negated if price closed above 1450 before entering.
Enter and exit only based on above conditions.
P.S :- This is published only in interest of educational purpose.
