Gold 29/08: Smart Money Looks at 3444 or 3395 LevelsMarket Context (SMC View):
Gold faced rejection from the 3423 liquidity zone and is now pulling back.
Demand is seen near 3397–3395, which can give a bounce if price tests it.
Premium supply zones above 3422 and 3442 are good areas to look for selling opportunities.
🔼 BUY SCENARIO
Buy Zone: 3397 – 3395
Stop Loss: 3389
Targets: 3405 → 3415 → 3425
🔽 SELL SCENARIO 1 (Price Action)
Sell Zone: 3422 – 3424
Stop Loss: 3430
Targets: 3412 → 3400
🔽 SELL SCENARIO 2 (Swing)
Sell Zone: 3442 – 3444
Stop Loss: 3452
Targets: 3425 → 3412 → 3400
📌 Conclusion & Notes
Bias: Buy near 3397–3395, then watch for possible liquidity grabs at 3422–3424 or a bigger sweep near 3442–3444 to go short.
Key Levels: 3422–3424 is the first intraday supply zone, while 3442–3444 is the major swing sell zone.
Tip: Wait for rejection candles or confirmation before selling.
Risk: Gold is very volatile; use strict stop losses and manage capital carefully.
Dailychart

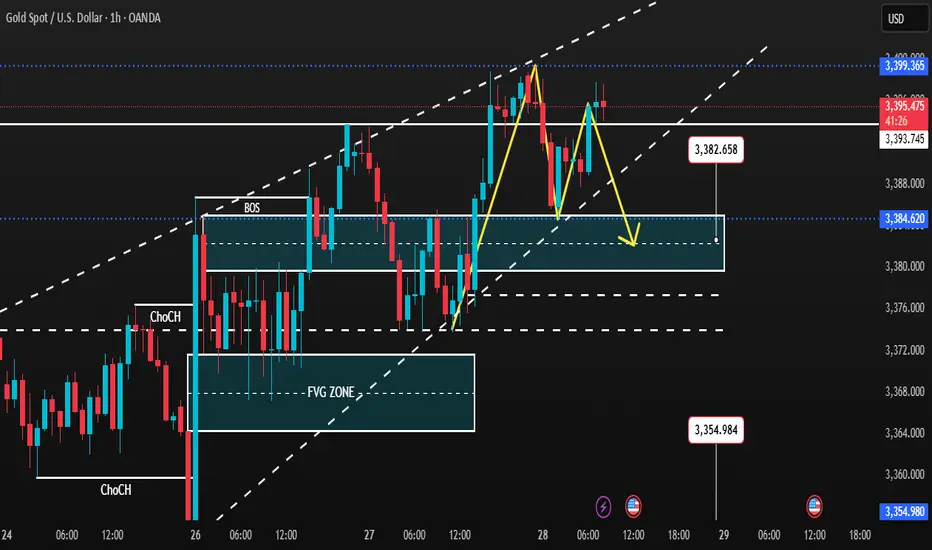
Divergence has appeared at H4 – TOP IS ABOUT TO BE FORMEDGold SMC Daily Plan – 28/08
Market Context (SMC view):
Gold is trading near 3395–3396 after a sharp bullish rally. Early bearish divergence is visible on H4, hinting at a short-term top.
Key resistance is at 3400 – a clean breakout above may trigger liquidity sweep towards 342x–343x, retesting the old ATH.
On the downside, if 3370 support breaks, price may correct deeper into 335x BUY zone for a strong bullish setup.
Key Levels:
Resistance: 3396–3400 (Sell Zone), 342x–343x (Liquidity sweep area)
Support: 3370, 3354–3352 (Buy Zone), 3325 (SL for longs)
SMC Zones & Liquidity Pools:
BUY ZONE 1: 3354–3352 (below liquidity sweep under 3370)
SL: 3347
TP: 3365 → 3375 → 3385 → 3395 → 3400+
BUY ZONE 2: 3380–3382
SL: 3374
TP: 3390 → 3400 → 3415 → 3430 → 3450+
SELL ZONE: 3408–3410 (above recent high)
SL: 3416
TP: 3390 → 3380 → 3375 → 3360
Trading Plan & Scenarios:
Sell Setup (Primary Bias – Divergence Play):
Look for liquidity grab above 3396–3399 (into resistance).
Enter short with SL above 3403.
Partial profits at 3390–3380–3375; keep runner towards 3360 if support breaks.
Buy Setup (Counter Play – Break & Retest):
If price dips into 3354–3352 BUY zone, wait for bullish confirmation (choch/BOS on lower TF).
Enter long with SL below 3347.
Targets: 3365 → 3375 → 3385 → 3395 → 3400+
Confluences:
H4 bearish divergence signalling possible exhaustion at top.
Liquidity pools above 3396 and below 3370 remain untapped.
FVG and imbalance align with 335x buy zone.
Gold 27/08: Smart Money Targets 3405 or Sweeps 3355?Gold SMC Daily Plan – 27/08
Market Context (SMC View):
Price is consolidating around 3378, holding the liquidity trendline with multiple BOS and ChoCH, indicating strong smart money activity.
Key resistance: 3393–3406 (supply & liquidity pool).
Key support: 3352–3358 (demand zone) with an Order Block (OB) near 3325.
A possible liquidity sweep could happen above 3405 or below 3355 before confirming the next trend move.
📊 Key Liquidity Zones & Entries
✅ Sell Zone: 3402–3406
SL: 3410
TP: 3390 → 3380 → 3360
✅ Buy Zone 1: 3352–3358
SL: 3345
TP: 3360 → 3375 → 3385 → 3395
✅ Buy Zone 2 (intraday pullback): 3376–3380
SL: 3370
TP: 3385 → 3395 → 3405
SMC Scenarios for 27/08
Scenario 1 – Liquidity Grab at Resistance:
If price sweeps 3402–3406, look for fake breakout signals.
Short from this zone with the TP levels mentioned above.
Scenario 2 – Buy on Dip (Demand Zone):
If price retraces deeper to 3352–3358, wait for bullish confirmation to go long.
If price respects the trend and holds 3376–3380, consider intraday buy opportunities.
SMC Notes:
Focus on buying dips unless a liquidity grab occurs first at 3402–3406.
Keep an eye on price action near the trendline & OB at 3325 for potential high-probability reversal setups.

Gold SMC Playbook 25/08 – Liquidity Hunt at 3400 & 3325Market Context (SMC Perspective)
Price is consolidating near 3367 after a strong impulsive move upward and is currently reacting around a minor resistance area.
Clear ChoCH and BOS patterns indicate bullish intent on the H1 timeframe; however, liquidity pools still lie below 3343 and 3325 (buy-side liquidity).
Imbalance zones spotted: 3343–3341 and a deeper order block zone around 3325–3323.
Key Levels
Resistance (Supply): 3372 – 3382 – 3389
Support (Demand): 3350 – 3342 – 3325
SMC Bias: Mixed – Opportunities to Play Both Long & Short Around Liquidity
🔴 SELL Scenario (Short-Term Liquidity Grab)
Entry: 3400 – 3403 (above local liquidity sweep)
Stop Loss: 3408
Targets:
TP1: 3390 (partial)
TP2: 3380
TP3: 3370
TP4: 3360 (opens 3350 liquidity zone)
Rationale: Expecting a sweep above 3400 into supply, followed by mitigation and a sell-off.
🟢 BUY Scenario (Bullish Continuation from Demand OB)
Entry 1 (Scalp Buy): 3343 – 3341 (reactive zone), SL 3337
Entry 2 (Main OB): 3325 – 3323 (strong OB), SL 3319
Targets:
TP1: 3330
TP2: 3340
TP3: 3350
TP4: 3370 (opens 3390 liquidity)
Rationale: Price may retrace below 3340 to fill imbalance and mitigate the 3325 OB before the next bullish leg.
Execution Plan (SMC Flow):
Wait for a liquidity sweep at highs or lows (above 3400 or below 3325) with proper confirmation.
Look for ChoCH and BOS signals on LTF (M5–M15) around OB zones for entry confirmation.
Trail stop loss after TP1 is hit; take partial profits and hold the remaining position toward the final liquidity target.

GBPCHF – Could This Be the Start of a Bullish Comeback?Looking at GBPCHF right now, it feels like the market is finally speaking my language.
After an extended downtrend, price has landed on a major support zone visible on the higher timeframes — a zone that’s been tested and respected multiple times before. We're now seeing early signs of rejection from that area, and I’m eyeing a potential move back up toward 1.1000.
What makes this setup stand out isn’t just the technicals — it’s the patience behind the play. I waited for the sell-off to complete, for price to return to a proven zone, and now I’m watching for signs of strength to kick in. This type of setup? I’ve seen it play out time and time again in my previous chart work.
Drop your thoughts in the comments — do you see the same potential, or are you taking a different side of the trade?

Gold Analysis 14 Jul 2025This is the revision of the previous post. Forgot to add curves. Gold is in Daily uptrend. Near a weak supply. If it break it will go for fresh Daily supply zone above. Look for Good risk to reward trades for upside on retracement.

Punjab National Bank Flag Breakout Setup📈 Punjab National Bank (PNB) – Flag Breakout Setup
Observed a classic flag pattern on the daily chart after a strong pole move in 2023–24.
✅ Breakout above the channel confirmed with price action near 113.
✅ Entry plan: Watch for daily close >113 with volume.
✅ Stop-loss idea: Below 106.
✅ Target 1: 140 (first swing resistance).
✅ Measured move projection targets up to ~198 possible based on full flag pole.
Volume confirmation and broader market context will guide the actual trade trigger.

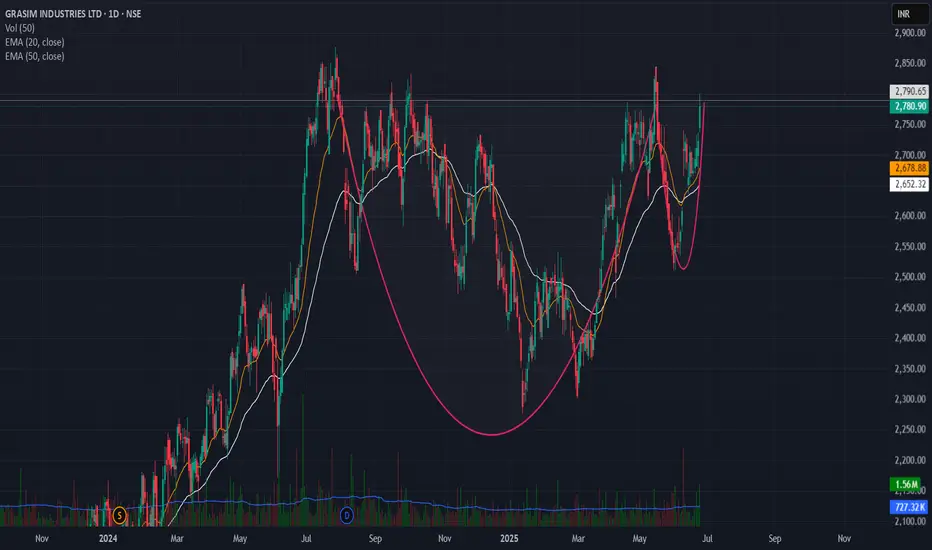
Breakout from cup and handle pattern Grasim Cup and Handle Breakout Setup
Grasim is forming a classic Cup and Handle pattern on the daily chart.
✅ Breakout Level: 2790
🛑 Stoploss: Below 2650 (handle low)
🎯 Target Zone: 3290 (based on depth projection and prior highs)
Pattern Logic:
Rounded cup base indicates accumulation
Handle pullback was shallow with declining volume
Breakout attempt with volume surge
Price above 20 EMA & 50 EMA
RSI > 55 and MACD nearing bullish crossover
#NH - Breakout Soon Candidate / Keep in Watchlist / Feb'25📊 Script: NH
Key highlights: 💡⚡
📈 VCP Formation in Daily chart.
📈 Price gave a good up move.
📈 Went into a Side Ways consolidation for over a Nine months.
📈 Volume spike seen in past
📈 MACD Cross Over.
📈 One can go for Swing Trade.
🟢 If you have any questions regarding the setup, please feel free to leave your inquiries in the comments, and I will respond promptly.
BUY ONLY ABOVE 1415 DCB
⏱️ C.M.P 📑💰- 1357
🟢 Target 🎯🏆 – NA%
⚠️ Stoploss ☠️🚫 – NA%
⚠️ Important: Always Exit the trade before any Event.
⚠️ Important: Always maintain your Risk & Reward Ratio.
✅#Boost, #Like & #Follow to never miss a new idea! ✅
Disclaimer: I am not SEBI Registered Advisor. My posts are purely for training and educational purposes.
Eat🍜 Sleep😴 TradingView📈 Repeat 🔁
Happy learning with MMT. Cheers!🥂

Nifty 50 - Portfolio Colour similar to color of Christmas?Year endings have historically been famous for a big correction and 2024 is no different.
As I had mentioned in my previous idea, 23900, 23300 are crucial support to Nifty and 24300, 24800 are strong resistances
We had seen a good bounce from 23300 to 24780 and then a good fall once 24300 was broken again.
23200-23300 will be a key level to understand next trend for Nifty.
As we can see, there is a confluence of trendlines and demand zone around 23200.
If we see a bear trap forming at this zone, one can expect 25000+ levels in January 2025.
But if 23200 is broken, bloodbath may continue till budget with next key support zones being 22700, 22000, 21500.
Market is going to be volatile as we are going to see a change in lot size of Nifty 50 from new year.
It is better to be sector specific for swing trading.

PowerGrid-1D TimeframeNSE:POWERGRID is in a uptrend in 1 month timeframe. While coming to lower timeframe, it is clear that the chart has touched the support zone for three times and hence we could go for a long position. There are two partial profits too in this analysis.As the higher timeframe chart is in uptrend, having a long position is advicable.
Disclaimer:- This analysis is only for educational purpose. Please always do your own analysis or consult with your financial advisor before taking any kind of trades
NSE:POWERGRID

Zomato 1D TFNSE:ZOMATO is trading near a support zone. Look for multiple confirmations before taking a trade. As Nifty is in retracement zone in 1M TF and has formed a head and shoulder pattern in 1D TF, it has went down for the past few days, but it will soon go up...
Disclaimer:- This analysis is only for educational purpose. Please always do your own analysis or consult with your financial advisor before taking any kind of trades

Tata Power Co - 1D TFNSE:TATAPOWER has been trading near a trend line for a long time as you can see the chart. As Nifty is also in a downtrend in a 1D TF, there is a possibility that this stock could go down. With a proper volume and confirmations this stock could be traded for a good R:R.
Disclaimer:- This analysis is only for educational purpose. Please always do your own analysis or consult with your financial advisor before taking any kind of trades NSE:TATAPOWER

SIKA - Breakout after an yearSIKA - Good breakout observed in the daily timeframe with nice price action. The company has robust sales, profits and growth potential. I see an immediate upside potential of 9% and more.

TECHM - CUP AND HANDLE PATTERN DAILY CHART The stock has formed CUP & HANDLE pattern
on the DAILY chart.
One can enter above 1589 with a strict
Stoploss of 1531
Target 1 - 1629
Target 2 - 1670
Target 3 - 1700
Target 4 - 2150
#SWINGTRADE
#FUNDAMENTALLY STRONG STOCK
What is your view please comment it down and also boost the idea this help to motivate us. All views shared on this channel are my personal opinion and is shared for educational purpose and should not be considered advise of any nature.

ASIAN PAINTS - INVERTED HEAD AND SHOULDER PATTERNThe stock has given breakout of INVERTED HEAD AND SHOULDER pattern & Retested
on the daily chart.
One can enter above 3054 with a strict Stoploss of 2970
Target 1 - 3200
Target 2 - 3280
Target 3 - 3360
#SWINGTRADE
#FUNDAMENTALLY STRONG STOCK
What is your view please comment it down and also boost the idea this help to motivate us. All views shared on this channel are my personal opinion and is shared for educational purpose and should not be considered advise of any nature.

GTPL - Symmetrical Triangle Breakout with Retest - Bullish LongGTPL Hathway Ltd. (NSE: GTPL) has recently broken out of a symmetrical triangle pattern on the daily chart. The breakout has been followed by a successful retest, indicating a strong bullish signal.
A Symmetrical Triangle Breakout would indicate a continuation of prior trend, which is bullish in the long-term, as shown by the Monthly Chart below.
I have also given a possible long-term channel for GTPL. The support at the bottom of the channel has been tested multiple times, as shown. We'll have to see if the top also holds but that is a long time away.
On the Monthly time-frame, the RSI is also on an upward trajectory, as shown.
Please comment with your views on the set-up.
Disclaimer: This analysis is for educational purposes and should not be considered financial advice. Always conduct your own research before making any investment decisions.

AUDUSD Sideway On H4 And Could Be Short In Short Term H1TF H4 BOS latest demand shows h4 trend turning to downtrend.
H1 Uptrend because of CHOCH
Currently price is sideways in supply demand of h1
Entry:
Wait for price to return to Supply zone H1 with engulfing candle confirming or confirming entry in M15 then go Long

Daily Bullish Flag Breakout in UNO MINDAHi,
NSE:UNOMINDA has given a Bullish Flag Breakout on Daily charts with very good volume.
MACD is also on the bullish side on daily, weekly and monthly time frames. RSI is also on the bullish side on daily and weekly time frames.
In the current market scenario I am expecting that the bullish momentum will continue.
Complete price projection like entry, stoploss and targets mentioned on the charts for educational purpose.
Please share your feedback or any queries on the study.
Disclaimer: Please consult your financial advisor before making any investment decision.

Lupin-Don't miss this picture perfect flag breakout!Lupin has given good flag breakout today. A weekly closing above 1700 will confirm the same.
ATH should be minimum target once breakout is confirmed.
Stock has been in a big bull run since 2023 and looks ready for newer ATH.
Pharma stocks have risk of negative US FDA observations impacting the stock prices.

Daily Bullish Flag Breakout in Som DistHi,
NSE:SDBL has given a Bullish Flag Breakout on Daily charts with very good volume.
MACD is also on the bullish side on daily, weekly and monthly time frames. RSI is also on the bullish side on daily and weekly time frames.
In the current market scenario, I am expecting that the bullish momentum will continue.
Complete price projection like entry, stop loss and targets mentioned on the charts for educational purpose.
Please share your feedback or any queries on the study.
Disclaimer: Please consult your financial advisor before making any investment decision.

Asahi Glass-Breakout done, finally?Asahi Glass has been consolidating in cup & handle pattern since few years.
Finally, stock has given daily closing above neckline.
A weekly closing above 615 will confirm breakout.
This breakout will bring momentum in stock and we can see 800 very soon.
Breakout traders can keep this stock in watchlist.
