XAUUSD (Gold) | Technical Outlook | 7th Jan'2026Gold (XAU/USD) is trading near 4,465, witnessing a healthy pullback after testing the 4,500 resistance zone. Despite short-term consolidation, the overall trend remains strongly bullish across Daily, Weekly, and Monthly timeframes. Price continues to hold above key moving averages, indicating buyers are still in control.
Key Levels
Resistance: 4,500 – 4,525 – 4,550
Support: 4,450 – 4,415 – 4,380
Bullish Scenario:
Holding above 4,450 keeps the upside open toward 4,500+. A breakout above 4,505 may accelerate buying momentum.
Bearish Scenario:
A sustained break below 4,440 could trigger a corrective move toward 4,415–4,380, while the broader trend remains bullish above 4,360.
Intraday Strategy:
✔ Buy on dips near 4,450–4,435
✔ Buy breakout above 4,505
✔ Sell only below 4,440 (short-term)
Macro Triggers to Watch:
• US Dollar Index & Bond Yields
• Inflation data (CPI/PPI)
• Fed speeches & FOMC signals
• Geopolitical developments
⚠️ Disclaimer:
This analysis is for educational purposes only. Gold trading involves risk. Always use proper risk management and consult your financial advisor before taking trades.
Daytrading

Gold Structure Update – Bulls Still in Control next 4518++Hello everyone, gold is trading inside a clear rising channel, and the structure remains bullish with higher lows intact. After the recent upside move, price has pulled back toward the lower side of the channel, which is a normal and healthy move in a strong trend.
This pullback is happening exactly where buyers are expected to step in. As long as price holds above the marked support zone, the probability still favors upside continuation, not breakdown. Strong trends usually pause, shake out weak hands, and then continue.
For now, there is no sign of trend failure. Only a clean break and acceptance below support would change the view. Until then, this remains a buy-on-pullback market, not a place to panic or chase.
Key Levels to Watch
Buy Zone: 4466–4463
Stop Loss: Below 4445
1st Target: 4480
2nd Target: 4500
3rd Target: 4518
Bias: Bullish above support
Disclaimer: This analysis is for educational purposes only and should not be taken as financial advice. Please do your own research or consult your financial advisor before investing.
Analysis By @TraderRahulPal | More analysis & educational content on my profile.
If this update helped, like and follow for regular updates.

Gold Rewards Timing, Not Activity🟡 Gold Rewards Timing, Not Activity ⏳✨
Gold is not a market that rewards constant action.
It rewards waiting, observation, and precise timing.
Many traders believe that trading more means earning more. In Gold, this mindset often leads to overtrading, emotional decisions, and unnecessary losses.
⏱️ 1. Gold Moves in Phases, Not Constant Trends
Gold spends a large amount of time in:
consolidation 🔄
slow accumulation 🧩
controlled ranges 📦
During these phases, price appears “boring,” but the market is actually preparing.
Trading aggressively in these conditions usually means trading noise, not opportunity.
🧠 2. Activity Feeds Emotions, Timing Controls Risk
High activity leads to:
impatience 😤
forced entries 🎯
emotional exits ❌
Good timing, on the other hand, comes from:
understanding context 🧭
waiting for price to show intent 📊
acting only when conditions align ✅
Gold punishes impatience faster than most markets.
🏦 3. Institutions Trade Less, But Trade Better
Large players do not chase every candle.
They wait for:
liquidity to build 💧
weak hands to exit 🧹
price to reach meaningful zones 📍
When timing is right, Gold often moves fast and decisively — leaving overactive traders behind.
⚡ 4. Big Gold Moves Come After Quiet Periods
Some of the strongest Gold expansions begin after:
low volatility 😴
reduced participation 📉
trader boredom 💤
This is why patience is not passive — it is strategic.
🧩 Key Insight
In Gold, doing less at the right time often outperforms doing more at the wrong time.
🎯 Final Takeaway
❌ More trades ≠ more profits
✅ Better timing = cleaner execution
🟡 Gold rewards discipline, context, and patience
Master timing, and activity will take care of itself.

Gold Update: Watching Channel Support for ContinuationGuys last trade of the year haha, let's see if we got something in this trade. Gold is trading inside a rising channel, and the overall structure remains positive. After the recent move up, price has pulled back toward the lower side of the channel, which is a normal and healthy behavior in an uptrend.
This pullback is bringing price closer to a key support area, where buyers have previously stepped in. As long as price holds above this support, the probability favors upside continuation rather than a breakdown.
This is not a breakout trade. It is a buy-on-pullback setup, where patience matters more than speed. A clear hold near support is what keeps this setup valid.
Disclaimer: This analysis is for educational purposes only and should not be taken as financial advice. Please do your own research or consult your financial advisor before investing.
Analysis By @TraderRahulPal | More analysis & educational content on my profile.
If this update helped, like and follow for regular updates.

Gold Holds Rising Channel – Upside Targets Still OpenGold is trading inside a clean rising channel, forming clear higher highs and higher lows, which confirms that the overall trend remains bullish. Instead of chasing breakouts, price is now doing what strong trends usually do, pause and consolidate before the next move.
The marked buying zone sits perfectly inside the rising channel and has already acted as a strong demand area. As long as Gold holds above this zone, buyers remain in control and upside continuation remains the higher probability scenario.
Upside targets are aligned with the channel resistance, which adds further confidence to this setup. These types of structures often reward traders who wait for pullbacks rather than reacting emotionally to fast candles.
A breakdown below the marked invalidation level would weaken this bullish view, but until then, the structure favors patience and trend-following.
Key Levels to Watch
Best Buying Range: 4519–4515
1st Target: 4535
2nd Target: 4553
Final Target: 4570
Structure Invalidation: Below 4497
Trend Bias: Bullish above support
Disclaimer: This analysis is for educational purposes only and should not be taken as financial advice. Please do your own research or consult your financial advisor before investing.

XAUUSD: Buy the dip or break to 4,587? MMF strategyXAUUSD (2H) – MMF Intraday Outlook
Market Context
Gold remains in a bullish continuation phase after breaking out of the prior accumulation range. Current price action shows a healthy pullback / rebalancing inside an ascending channel — a typical behavior before the next expansion leg, not a reversal signal.
Structure & SMC
Strong bullish impulse → range formation for liquidity reset.
4,485.981 acts as a key Demand / Bullish OB, where buyers previously stepped in.
Liquidity and upside objective are resting near 4,587.447.
Key Levels
BUY Zone (Demand / OB): 4,486
Mid-range / Pivot: ~4,533
Upside Liquidity Target: 4,587
Trading Plan – MMF Style
Primary Scenario – Trend-Following BUY (Preferred)
If price pulls back into 4,486 and shows acceptance (wick rejection / bullish close),
Then look for BUY continuation:
TP1: range high / intraday resistance
TP2: 4,587
Invalidation: clean 2H close below 4,486 → stand aside and reassess structure.
Alternative Scenario – Break & Retest BUY
If price holds above balance and breaks higher with strong displacement,
Then wait for a break–retest to join continuation toward 4,587.
Avoid chasing price in the middle of the range.
Macro Backdrop
Ongoing dovish Fed expectations and softer yields continue to support gold.
End-of-month liquidity can cause sharp swings → patience and level-based execution are key.
Summary
Short-term bias remains bullish as long as 4,486 holds.
MMF focus today: buy pullbacks into demand, target 4,587 liquidity.

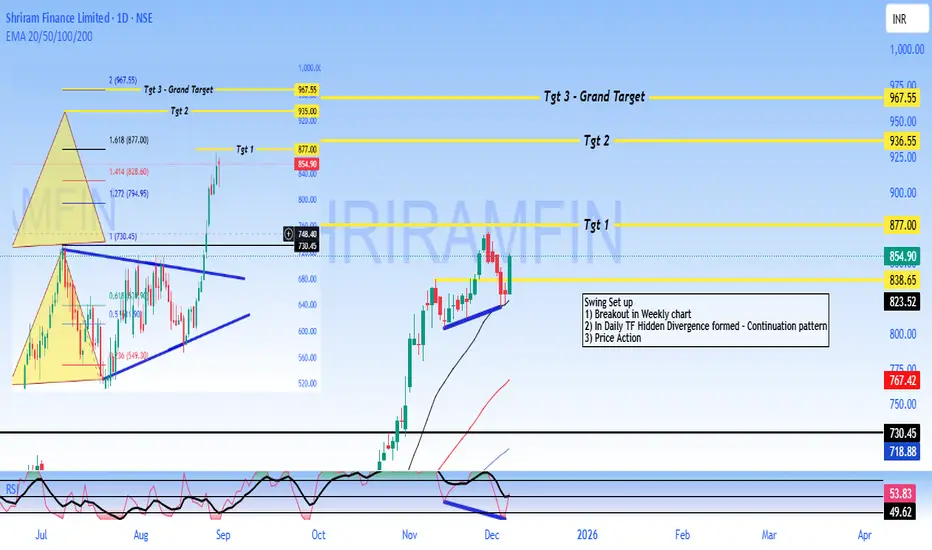
SHRIRAM - Buy - SwingTrading #Shriram Finance Limited - #Technical Analysis
Price: 854.90
#Technical Setup
Pattern: Continuation pattern with bullish hidden divergence following weekly breakout
Key Levels:
- Target 1: 877.00
- Target 2: 936.55
- Target 3: 967.55
- Support: 838 - 825 (critical)
- Major Support: 730.45
#Outlook
The chart shows a swing trading setup with upside potential toward 877 - 967 if support at 838 holds. A break below 825 would invalidate the bullish structure.
DISCLAIMER
This is NOT investment advice. This analysis is for educational purposes only. Trading involves substantial risk of loss. Always conduct your own research and consult a SEBI-registered financial advisor before making investment decisions. Past performance and technical patterns do not guarantee future results. The author assumes no responsibility for any losses incurred.
XAUUSD (Gold) Technical Outlook - 24/12/2025XAUUSD – Gold Technical Snapshot (Intraday)
Gold remains bullish across higher timeframes (Daily–Monthly). Price is trading near 4,492, close to the day’s high, with all major moving averages aligned upward. Momentum indicators support the uptrend, though overbought conditions suggest possible short-term pullbacks.
Key_Levels
Support: 4,480 / 4,465
Pivot: 4,495
Resistance: 4,520 → 4,550 → 4,575
Outlook & Strategy
Bias stays bullish above 4,480
Buy pullbacks near support or breakouts above 4,520
Below 4,465, expect a corrective move toward 4,440–4,410
Disclaimer: This analysis is for educational purposes only and not financial advice. Trading involves risk—always manage your risk and do your own research.

Gold 15-Min Chart: Previous Support should act as Resistance nowHello everyone, Guy's Gold has made a sharp recovery after the recent drop, but i am expecting gold should take resistance in this area. This level has already shown rejection in the past, making it a critical decision area for the market.
The rejection near this zone suggests that sellers are still active. If Gold fails to sustain above this resistance, a pullback toward the lower support areas is likely. Such pullbacks are normal after strong impulsive moves and often provide better clarity for the next direction.
As long as price stays below this resistance, upside looks limited in the short term. A clean breakout and hold above this level is required to shift the bias back to bullish.
Disclaimer: This analysis is for educational purposes only and should not be taken as financial advice. Please do your own research or consult your financial advisor before investing.

Gold After Liquidity Grab: Short side intraday move, R you readyHello Everyone, let's analyse Gold as this once again tested a major resistance zone, but instead of giving a clean breakout, price briefly moved above the level and then quickly reversed. This move was not strength, it was a liquidity grab.
In simple words, smart money pushed price above resistance to trap breakout buyers, collect their stop-loss liquidity, and then bring price back into the range. This is why price failed to hold above the highs and started showing weakness soon after.
Right now, Gold is trading back below resistance, which keeps the short term bias cautious to bearish. If selling pressure continues, price may slowly rotate toward the lower support / demand zone, where buyers could appear again.
This chart is a good reminder that not every breakout is real. Waiting for confirmation always matters more than speed.
Disclaimer: This analysis is for educational purposes only and should not be taken as financial advice. Please do your own research or consult your financial advisor before investing.
Analysis By @TraderRahulPal | More analysis & educational content on my profile.
If this helped you understand price behavior better, like, follow, and share your view in comments.

XAUUSD – Structure Delivered | Buy Complete Sell Phase InitiateThis chart was shared on 12-12-2025 when Gold was holding previous high → flipped support.
That level did exactly what it was supposed to do.
🔹 Buy Logic (12-12-2025):
Previous highs tapped → support confirmed
Strong displacement from the level
Clean bullish structure continuation
Price respected demand and delivered full upside move
🎯 Buy target hit cleanly, no drawdown drama.
Now fast forward ⏩
After the expansion, price reached premium supply / distribution zone, failed to continue higher, and started forming lower highs.
🔻 Current Sell Bias:
Rejection from supply
Bullish structure weakened
Market shifting into retracement / distribution phase
Expecting continuation towards lower imbalance / support zones
This is how the market works:
➡️ Expansion
➡️ Target delivery
➡️ Distribution
➡️ Reversal / retracement
Same chart. Same plan.
Bias changes when structure changes, not when emotions do.
#XAUUSD #Gold #SmartMoney #MarketStructure #TradingView #ValhallaCore

Chumtrades XAUUSD Outlook – Will Gold Continue Sideways Today?🎯 XAUUSD – Sideway Day Before FOMC
1️⃣ Market Context
H4 is clearly moving sideways: small candle bodies – long upper and lower wicks, indicating hesitation before FOMC (occurring the night of the 11th into the morning of the 12th).
The price is currently locked in the H4 range:
Lower boundary: 4176–4180
Upper boundary: 4215–4218
Today I am observing the price moving sideways within this range.
2️⃣ Intraday Trading Strategy
🟢 BUY low – priority
Watch for reactions at the zones:
4180 – 4182
4174 – 4178 (bottom of H4 range)
4155 – 415X (most attractive BUY zone)
→ Short target: 4200 – 4210
→ SL below support zone by 100 pips
🔻 SELL high – priority
Watch for reactions at:
4212 – 4218 (top of H4 range)
4230 – 4233 (strong resistance – most attractive sell zone)
→ Target: return to mid-range 4190 → bottom of range 417X
→ SL above resistance zone by 100 pips
The nearest zone is 4202-4198, this entry can be considered
3️⃣ Expected Movement
Today → Sideways within H4 box 4176 ⇆ 4212.
Just trade according to the range: buy low – sell high.
Expected daily fluctuation range is 50-55 prices.
A true breakout may occur tomorrow or the day after, as the market prepares for this week's FOMC.
📌 Note
Prioritize candle reactions at price zones.
Avoid FOMO in the middle of the range.
Divide positions smaller than usual as the market tightens before major news.
Find this analysis useful?
Press Follow to update the plan daily before trading hours and discuss more effective strategies!
Wishing everyone a day of total victory in trading!

Will GOLD Hold the Key Suppor? Watching for a Push Toward 4195Gold continues to trade within a tight intraday range. The 4180–4175 area is acting as a solid support zone, with buyers consistently stepping in on dips. On the upper side, supply remains active around 4200–4196, keeping price capped for now.
As long as Gold holds above the 4175–4180 support region, there is a reasonable probability of another attempt toward the 4195 level. A clean push above 4196 could open the door for buyers to retest 4200 and potentially higher. However, a breakdown below 4175 would invalidate this short-term bullish bias.
📌 Key Levels
Support: 4180–4175
Resistance / Supply: 4196–4200
Upside Target: 4195+
📈 Bias: Mildly bullish above 4175; neutral-to-bearish if broken.
⛔ Disclaimer: This is not financial advice. Always manage risk and trade based on your own analysis.
Your feedback drives our content and keeps everyone trading smarter. Let’s make those pips together! 🚀
Happy Trading,
– The InvestPro Team

#Bajaj Finance Limited - BUY - Technical Analysis#Bajaj Finance Limited - #Technical Analysis
Price: 1,048.00
#Swing Trading Setup
Pattern: #Range #breakout with #consolidation above breakout zone. #Triangle/Box pattern breakout with target hit. Currently forming double bottom pattern.
Key Technical Points:
1. Range breakout & consolidating above breakout area
2. EMA's sorted & aligned - price trading above all EMAs
3. Triangle/Box pattern breakout - target achieved, now forming double bottom
4. Classic divergence in recent bounce area confirming retracement completion
Target Levels:
- Target 1: 1,103.80
- Swing Target 2: 1,155.00
- Grand Target: 1,225.00
Support: 1,026 - 1,018 (critical zone)
#Outlook
Strong bullish structure with potential upside of 10-17% toward targets. The double bottom formation suggests the retracement phase is complete. Price sustaining above ₹1,048 confirms continuation toward higher targets.
⚠️ DISCLAIMER
This is NOT investment advice. For educational purposes only. Stock trading involves substantial risk. Past performance doesn't guarantee future results. Always do your own research and consult a SEBI-registered financial advisor before investing. Author assumes no responsibility for losses.
#BajajFinance #StockMarket #NSE #TechnicalAnalysis #SwingTrading #IndianStockMarket #Trading #FinTwit #ChartAnalysis #StocksToWatch #TradingView #MarketAnalysis

GOLD IS SETTING UP FOR ANOTHER BULLISH RUN — BUY THE DIP BEFORE November 7, 2025 — GOLD Daily Trading Plan 💰
🎯 Bias: LONG Setup (Buy the Dip)
Gold continues to show bullish market structure after multiple BOS (Break of Structure) confirmations on both intraday and H1 charts.
Price has reacted from the previous demand area 3969–3977, leaving a clean FVG below, suggesting unfilled imbalance and potential liquidity resting underneath.
At the moment, XAUUSD is hovering near 4007, approaching a minor supply zone at 4018–4020. I expect price to potentially sweep liquidity above 4018, then retrace back toward 3975–3969 to form a higher low before continuing its bullish leg.
Key confluences supporting the long bias:
✅ Multiple BOS and CHoCH shifts confirm bullish intent.
✅ FVG + Volume Gap below aligns with a discount zone for entries.
✅ Structural higher low formation still intact as long as price holds above 3965.
📌 Trade Plan:
🟩 Buy Zone: 3977 – 3969
⛔ Stop Loss: 3963 (max 6 points)
🎯 Take Profit 1: 4005
🎯 Take Profit 2: 4018
If price decisively breaks above 4020, expect continuation toward 4035–4040, but intraday traders should secure profits around the 4018 zone.
In case of a deeper retracement, watch for liquidity grabs near 3965–3950 FVG before another bullish push.

GOLD TRAPPED BETWEEN LIQUIDITY ZONES – WAITING FOR SMART MONEY M🧭 DAILY TRADING PLAN – GOLD (XAU/USD)
Date: Oct 31, 2025
Main timeframe: M30 – H1
Strategy: SMC + Liquidity Grab + BOS/CHOCH Confirmation
🎯 Hook:
Gold is currently ranging between two key liquidity zones after a bullish BOS. Will price hunt the weak high or sweep the buy-side liquidity before the next leg?
🌐 MARKET CONTEXT
After a strong recovery from 3960 → 4040, price created a weak high with no significant displacement. The recent rejection from 4037–4039 suggests short-term supply pressure, but overall market structure remains bullish with multiple BOS confirmations.
Current structure shows a liquidity grab → retracement phase before continuation.
📈 TRADING PLAN
Scenario 1 – BUY setup (preferable)
Entry zone: 3996 – 3994
Confirmation: Bullish reaction / CHoCH on lower timeframe (M5–M15)
TP1: 4030
TP2: 4038 (liquidity above weak high)
SL: 3988 (≈ 6$ risk range)
Bias: Continuation bullish leg after mitigation
Alternative BUY zone (deep retracement):
Entry: 3960 – 3958
TP: 4030
SL: 3952
Use only if price sweeps lower liquidity.
Scenario 2 – SELL setup (counter-trade)
Entry zone: 4037 – 4039
Confirmation: M15 bearish CHoCH / rejection candle
TP1: 4010
TP2: 3995
SL: 4045 (≈ 6$ risk range)
Bias: Short-term sell before retest demand
🧩 SUMMARY
Market still shows bullish structure, so buy setups at demand zones are higher probability.
Sell setups should be quick scalps around the weak high, targeting intraday retracement.

DAILY TRADING PLAN — GOLD (XAU/USD) | Pullback Buy Zones 🧭 DAILY TRADING PLAN – GOLD (XAU/USD)
Date: Oct 29, 2025
Main timeframe: M15 – M30
Strategy: SMC + Trendline + Fibo confluence
🧩 MARKET CONTEXT
Price created a BOS at 3983, indicating short-term bullish momentum within an ascending channel. The current structure supports pullback buys from demand / OB zones before targeting key resistance levels 4018 → 4085–4102 (Fibo reaction zone).
🎯 TRADE SETUPS
1️⃣ BUY #1 (Preferred – Retest Trendline / CP)
Entry: 3961
SL: 3955 (6 pts)
TP1: 3983
TP2: 4018
Structure-based retest at 50% trendline + CP zone
2️⃣ BUY #2 (OBS / OB Zone)
Entry: 3934 – 3932
SL: 3928 (6 pts)
TP1: 3983
TP2: 4018
TP3: 4085 – 4102 (extension target)
3️⃣ SELL (Counter-trend only)
Entry: 3992 – 3994
SL: 4000 (6 pts)
TP1: 3934
TP2: 3910
Use only if there is a clear rejection candle around the 3990s zone.
📈 BIAS
Short-term bullish while above 3930–3910.
Watch 3961 / 3932 zones for buy reactions.
Shorts valid only if strong rejection occurs at 3990s.

Candlestick Secrets Traders Never Tell YouDiscover candlestick patterns hidden in plain sight and master their true power like never before
Charts used in this Video are over 3 months old

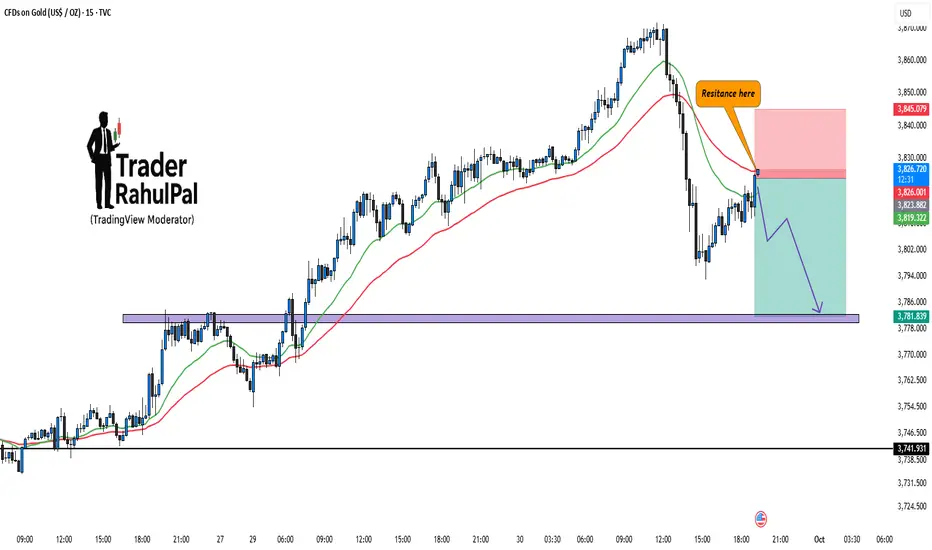
Gold Day Trading Outlook: Resistance Holding! Gold is showing signs of weakness as the resistance around 3860–3865 continues to hold strong, keeping the intraday sentiment tilted to the bearish side. As long as price stays below this band, the market is vulnerable to further downside pressure with immediate support seen near 3827 and an extended target towards 3798. Any minor pullbacks into the 3855–3860 region may attract sellers, maintaining the short-term bearish structure. However, a decisive hourly close above 3865 would invalidate this bearish view and shift the bias back to the upside, opening the door for a possible retest of 3880–3900. Until then, day trading leans bearish with sellers holding the upper hand. Trade safe !

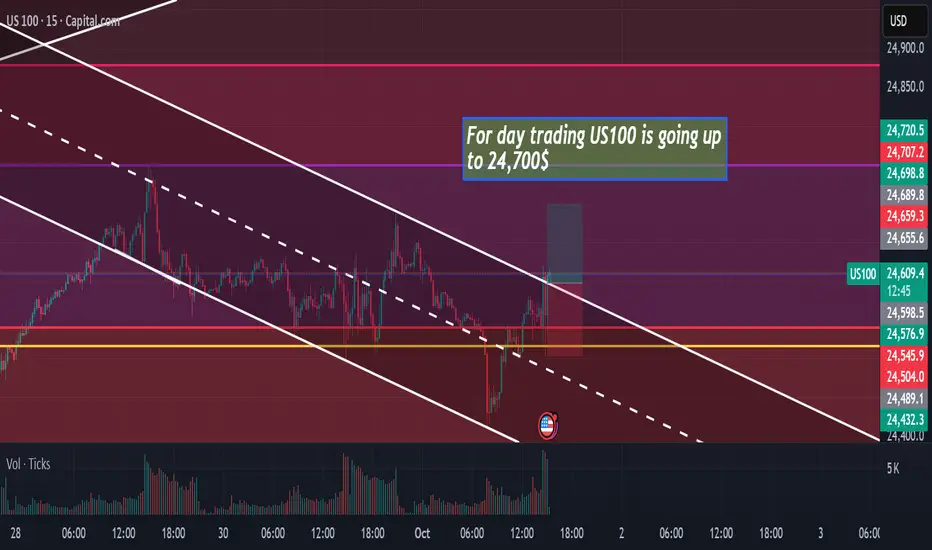
US100 is going UP TO 24,700$hello.
US100 is going up to 24,700$ in few minutes !! it's a buy opportunity on 15MIN time frame
Gold – Resistance at 3840, Contra Move in Play?Gold has approached the 3825 and at high around 3840 resistance zone where sellers are likely to step in. Price rejection from this area can trigger a downside move toward the 3775–3780 support zone.
Currently, the setup favors a contra play, with risk defined above the resistance zone and reward potential aligning with the lower support.
Disclaimer: This analysis is for educational purposes only and should not be considered financial advice. Please do your own research or consult your financial advisor before trading.
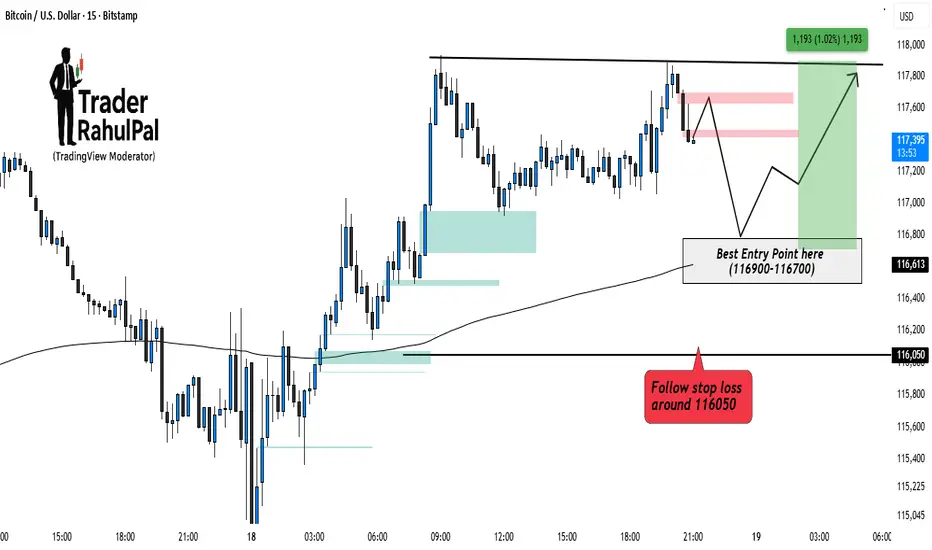
Bitcoin Bullish side Entry Setup Intraday – Key Levels to Watch!Bitcoin is consolidating near its upper resistance zone after a recent bounce. Price action suggests that a pullback into the 116900–116700 range can offer a high-probability entry for buyers. Maintaining a stop loss around 116050 helps to protect against deeper downside risk. As long as this zone holds, the bias remains bullish, with potential upside toward 117800–118000 . Intraday traders should closely watch how price reacts around the entry zone before positioning.
Disclaimer: This analysis is for educational purposes only and should not be taken as financial advice. Please do your own research or consult your financial advisor before investing.
GOLD ANALYSIS IN 30MINHELLO,
there is high probability for gold to reach the 3713$ in few HOURS,
thanks
