Daytrading

adaniport short till PRZ as per their trade setupNSE:ADANIPORTS
after reaching PRZ one can look for reversal too

RETAILERS PUSHED OUT AND NOW PREPARING FOR BEARISH RUNAs you can see clearly , Institutions have gone to take out for liquidity and is now showing signs of reversal. Red line is the resistance and price should fill it before turning bearish. Blue lines are take profit lines.
Disclaimer: I am not a SEBI Registered Advisor. This post is purely for educational purposes only. I will not be responsible for your profit and loss.
Please confirm with your investment advisor.

IPA : I TOLD THIS YESTERDAY , RETAIL KICKED OUTI TOLD INSTITUTIONS ENTERED CREATING NO CHANCE FOR BEARISHNESS. SEE THE PINBAR NOT EVEN A SINGLE CANDLE FORMED BELOW IT

Nifty 50 Direction with Zeta ScannerWatch Zeta Scanner signals working so nicely on Nifty50 Futures chart.
Zeta Scanner generates Buy/Sell signals for you to follow.
When you see a Buy Signal, you may take the Buy position and hold it till either (a) you see a Sell Signal or (b) your Stop Loss is hit which is ideally the low of the candle which precedes the Candle where Buy Signal came, but you may choose any other Stop Loss also like 2% loss of your capital or so on.
When you see a Sell Signal, you may take the Sell position and hold it till either (a) you see a Buy Signal or (b) your Stop Loss is hit which is ideally the HIGH of the candle which precedes the Candle where Sell Signal came, but you may choose any other Stop Loss also which works for you.
It is so simple and it gives very good accuracy.
For free access to back-test this indicator, you may like to contact us.

TESLA: View from Algo Scalping systemHow a tradingview algo indicator easily defines the Tesla scalping. just check...

Crude near Triangle Breakout!!Just check How crude is near triangle breakout. Also check how scalping indicator is providing perfect buy sell signals!!


Godrej Prop - Go long above 908If inside bar (30min) is broken
Go long above 908
SL - 895
Target - open based on RR of 1:2 or 1:1


CiplaMade double bottom, tested support and gave good bounce and now expecting a breakout.
Buy above 731.5 (Intraday).
Please do your analysis. Before trading..

IGLTook breakout beautifully, buy in pullback or safe players buy above 405(Intraday).
Please do your analysis.

Day Trade setup for beginners Simple Trade Setup for Beginners for Day trade
Put three Horizontal Lines after opening.
These are calculated by various ways like Standard Deviation /ATR / Pivot points etc (I use algorithm)
1. Buy Above price in green
2. Open Price e in blue(actual value)
3. Sell Below in red
Second Set of Horizontal Lines
3 Targets of Buy in dark green
3 Targets of SELL in dark red
Place the Trend change timings as vertical lines (before market)
Price chart in Heikin Ashi 1min or 5 Min based on comfort.
Super trend (7,3) on top of this chart
Use the Standard Pivot points (use shaded and not just lines)
If we are on Positional SELL then put a line for BUY reverse number differently as this may be strong resistance/Support
If we are on Positional BUY then put a line for Sell reverse number differently as this may be strong resistance/support.
Things that worked for me.
1. Observe the market action of previous 3-4 days/1 week on the response to these horizontal price lines added.(before market open)
2. Make a note of 15/30 min Super Trend for Resistance/Support levels (before market opens and later as well)
3. Don’t trade in first 30 mins of opening and allow market to stabilize.
4. Not gaining Money is better than losing money and just HOPE is not a strategy.
5. No trade with high leverage /borrowed money and Psychology plays VITAL role in trading.
6. Big Traders try to trap retailers frequently by sudden sell /Buy in big volume to create false trend but Math’s can identify it!.
7. If open price is acting as support then Market tendency is to move UP and if the Open price is acting as resistance then market tendency is to move DOWN.
8. Simple trend lines will give a good amount of information on a 15 min Heikin Ashi chart.
9. Believe in use of Mathematics and Statistics along with any parameter that supports it in consistent manner including Astrology works better.
10. Prepare mentally before a trade. Keep calm, stick to a plan (prepared before trade starts) and no flip flop during trade.
11. Invest time to read about (Standard deviation-Mean-Probability-Skew/volatility/Fibonacci/Heikin Ashi).
12. Price always follows a predictable (yes!!) pattern (identified by Polynomial equations) and everything is scripted by large players.


IGL LONG BET AS PER RSI DIVERGENCE IGL HAS BEEN IN DOWNTREND FOR SOMETIME. NOW THERE IS BULLISH RSI DIVERGENCE ON THE CHART.
IT LOOKS LIKE LONG VOLUME CANDLE CORRESPONDING TO TODAY's LOW PRICE CANDLE HAS EXHAUSTED ALL THE SUPPLY AND AFTER THAT PRICE STARTED MOVING HIGHER.
HENCE IGL LOOKS GOOD ABOVE THE TRENDLINE WITH STOP OF BELOW 381.

3IINFOTECH Cup and handle pattern3IINFOTECH Cup and handle pattern formed in Day Time frame
Buy above 2.95 to CMP 3.25
Stop loss 2.19 below day candle close
Target 4.80
This is education purpose only.

Dileep MP IndicatorMarket profile is a way of analyzing the Institutional trader behavior who are really responsible for trends, doing this we trade along with the Institutional traders who are better informed.
"Value Area" is very Important thing in MP, so were the "Initial Balance", "Opening" "Range" Etc.

CADILAHC - intraday - 11-08-2020Buy above 407
Target - 410 - 415
SL - 402
*Strong resistance near 410-11 keep close watch near this price zone if open gap-up avoid trade for first 5 min
Disclaimer:
All charts are purely for educational and information purpose only.
Invest or Trade with the help of your financial advisor or on your own risk.

CADILAHC - INTRADAY 10-08-2020Buy above 394
Target - 398 - 402
SL - 390
Sell Below 388.75
Target - 385-384
SL 391
Disclaimer:
All charts are purely for educational and information purpose only.
Invest or Trade with the help of your financial advisor or on your own risk.


LOOKS GOOD BUY WITH SMALL STOP BELOW THE TRENDLINE.ITC IS A GOOD BUY WITH A SMALL STOP LOSS BELOW THE TRENDLINE FOR TOMMORROW.

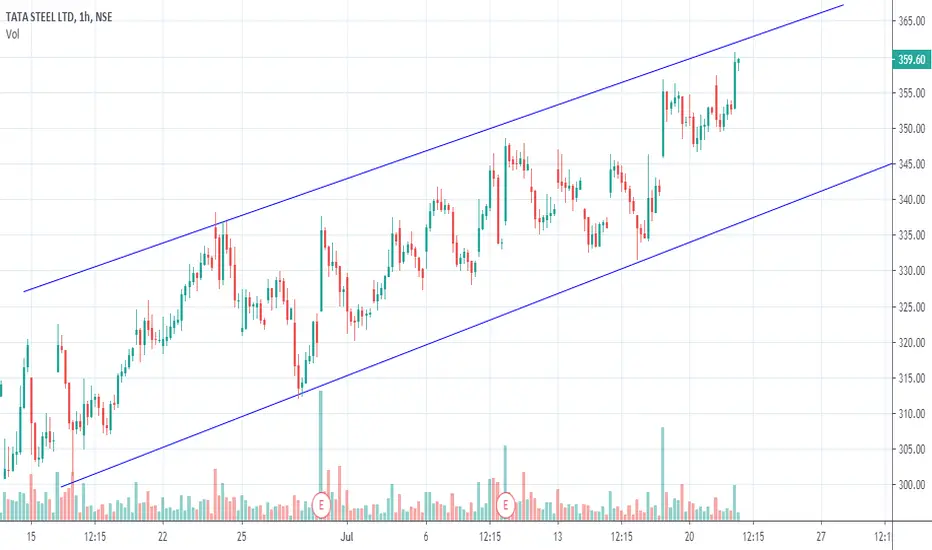
TATA Steel TATA Steel Trading in Parallel Channel
Go long if breaks the pattern or short if resist.
Take this view only for educational purpose. Trade on your own risk.