#INFIBEAM intraday long trade setup (16/12/23)Greetings Folks,
today I have prepared a setup of
NSE:INFIBEAM on NSE
the analysis is as follows-
- the price is in a uptrend momentum right now
- following a weak breakout, price is now retracing to fuel back its efficiency and momentum
- as the price has returned more than 50%, its better to let the price take stable support
- there are 2 possibilities, either the price take support at the trendline or the zone mentioned in chart
- the market is very volatile, trade with light head
don't play with fire, always use a predefined stoploss
Daytrading

BUY URGOCAP SWING TO SHORTTERM INVESTStock made a huge consolidation and made breakout and now Back to Breakout area for retracement.
Conservative Traders wait for Proper PriceAction and execute your trades.
Always Maintain proper RiskReward. Here Maintain Proper Stoploss based on Daily candle closing Basis.

#IDEA long trade idea setup (27/11/23)Greetings Folks,
today I have prepared a setup of NSE:IDEA on NSE
the analysis is as follows-
- the price is in retracing mode
- having retraced more than 50% , price is ready to start moving up again
- i am using the support below for entry not the current range support because the price has some imbalance to be filled and just to be on safer side
don't play with fire, always use a predefined stoploss

#HCC long trade idea setup 22/11/23Greetings Folks,
today I have prepared a setup of HCC on NSE
the analysis is as follows-
- the price is on a good bullish trend with efficient price action
- price is currently forming a triangle pattern
- the trendline has been tested 3 times earlier
- the price also tried to break out the equal high static resistance but failed with a wick only
- now if momentum and volume adds up, the price can break past this resistance
don't play with fire, always use a predefined stoploss

#DISHTV short trade idea setup 21/11/23Greetings Folks,
today I have prepared a setup of DISHTV on NSE
the analysis is as follows-
- the price recently broke out of a descending trendline
- it created a lot of imbalance in the process
- the imbalance is essential to get filled
- the price is also making a bearish pattern i.e head & shoulder
- trade when price break the neck of the pattern
don't play with fire, always use a predefined stoploss

#IDFC long trade idea setup (counter trend) 18/11/23Greetings Folks,
today I have prepared a setup of IDFC on NSE
the analysis is as follows-
- the price faced a sudden downfall due to the RBI negative news
- price broke down the trendline support and has swept all the liquidity from the trendline
swept the liquidity in easy language means sucking the power of trendline and now its baseless
- price has made a huge imbalance which needs to be covered quickly for efficient price action
- take profit is mentioned, don't be greedy as we are counter trend trading
don't play with fire, always use a predefined stoploss

#JPPOWER long trade idea setup 17/11/23Greetings Folks,
today I have prepared a setup of JPPOWER on NSE
the analysis is as follows-
-The price is speculating near the all time high
- price broke a previous minor high with good volume , now retraced successfully
- price already has tapped in my support zone now ready to break past the BSL
- trendline support is also in our confirmation bias
don't play with fire, always use a predefined stoploss

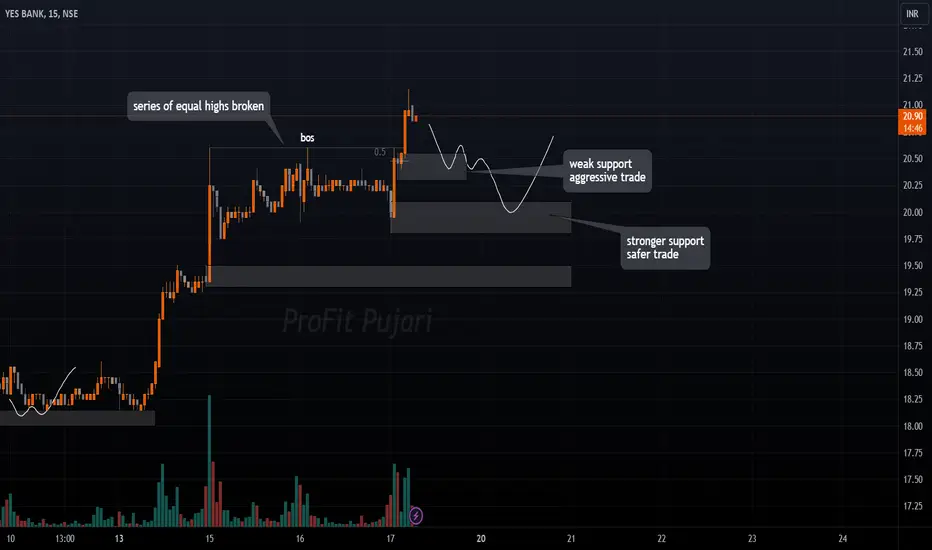
#YESBANK long trade idea setup 17/11/23Greetings Folks,
today I have prepared a setup of YESBANK on NSE
the analysis is as follows-
-the price recently broke out of a series of equal highs
- we are now waiting for a suitable retracement for the trade
- 2 possible support zones, first one is weak and unreliable but it can work out because the stock is accompanied with good volume
- the latter support zone is safer and new traders should use this zone
don't play with fire, always use a predefined stoploss
nifty 50 for days 19784-94 ENTRY LEVEL with the high of stop loss like 40 -50 points but wait n watch then .
level 1 19720-40
level 19750-70 and above

Banknifty for days entry level for long above 44250-270
stop loss level near / below of yesterday low i.e 44160-150 below
target zone is if break yesterday high and add more 200 + points(44400-44600) but carefull expires and all

#USOIL intraday long trade setup Greetings Folks,
today I have prepared a setup of USOIL on TVC
the analysis is as follows-
-the price currently broke out of a range of equal highs, this is a good sign of bullish momentum
- the price is retracing right now, either it can take support from the 50% of retracement or respect the support zone i mentioned in chart
- the safer trade would be the latter one, i have marked the take profits also or you can also use pivot point indicator for exit
don't play with fire, always use a predefined stoploss

#YESBANK LONG TRADE IDEA SETUPGreetings Folks,
today I have prepared a setup of YESBANK on NSE
the analysis is as follows-
- the price is on a roll right now, making good structure along with new higher highs
- the market was slow today, hoping for a retracement for the price to gear up for the next bullish leg
- it CAN retrace deeper than the zone depicted in the chart if index opens negative tomorrow
don't play with fire, always use a predefined stoploss
#SUZLON LONG TRADE IDEA SETUPGreetings Folks,
today I have prepared a setup of SUZLON on NSE
the analysis is as follows-
-the price recently broke out of a bullish pattern
- its currently respecting a static resistance, which will get break in next trading day
- The price respected the previous high as a resistance, price is building up momentum to break past it
- either trade the breakout of high or when price submits to a support zone of BSL as mentioned or the trendline support
don't play with fire, always use a predefined stoploss

#PNB LONG TRADE IDEA SETUPGreetings Folks,
today I have prepared a setup of PNB on NSE
the analysis is as follows-
-the price recently broke out of a bullish pattern
- The price is kinda stretched right now, can use some temporary support for more momentum
- i have marked the most immediate strong support zone
- this trade setup might play in 2-3 days as the support zone is not in reach of price right now
don't play with fire, always use a predefined stoploss

#IFCI LONG TRADE IDEA SETUP Greetings Folks,
today I have prepared a setup of IFCI on NSE
the analysis is as follows-
- The price broke past the previous higher high
- now the price is spectating in a minor, just above the breakout area
- the most immediate minor high failed to break past the previous minor high indicating temporary weakness
- it would be better if the price would consolidate sometime in this minor range and then breakout
don't play with fire, always use a predefined stoploss

#SUZLON LONG TRADE IDEA SETUPGreetings Folks,
today I have prepared a setup of SUZLON on NSE
the analysis is as follows-
-the price recently broke out of a bullish pattern
- its currently respecting a static resistance, which will get break in next trading day
- the above resistance marked is the previous high, if price breaks pass through it the same day, this would indicate that the bullish trend still has power left, if it takes 2-3 trading days to breakout the previous high, dont set the target more than 4-5 % for safety
don't play with fire, always use a predefined stoploss

#NIFTY50 LONG TRADE IDEA SETUPGreetings Folks,
today I have prepared a setup of NSE
the analysis is as follows-
- the price is consolidating in a minor range
- breakout trade is very optimal for such scenario
- if breakout with good volume, can enter without retest, but safer entry will always be waiting for a retest
- there is chance that the trade can go south, so dont get your adrenaline in control
don't play with fire, always use a predefined stoploss

#RPOWER LONG TRADE IDEA SETUPGreetings Folks,
today I have prepared a setup of RPOWER on NSE
the analysis is as follows-
- The price is on a good bullish trend
- its retracing right now for another bullish leg, let the price settle on the support zone, then you can initiate the trade
- be alert about the volume when it approaches the support zone, it should be big buying candles for confirmation
don't play with fire, always use a predefined stoploss

#IDEA LONG TRADE IDEA SETUPGreetings Folks,
today I have prepared a setup of IDEA on NSE
the analysis is as follows-
- The price is on a good bullish trend
- The price is making a famous triangle pattern
- wait for breakout with good volume, if breaks down then wait for price to settle on the support below
don't play with fire, always use a predefined stoploss

#ALKEM LONG TRADE IDEA SETUPGreetings Folks,
today I have prepared a setup of ALKEM on NSE
the analysis is as follows-
- The price is on a good bullish trend
- its time for price to retrace a little to refuel its momentum
- i have marked the immediate support below
- you may also do counter trade short but it would be require high cautiousness
don't play with fire, always use a predefined stoploss

#IDEA SHORT TRADE IDEA SETUP Greetings Folks,
today I have prepared a setup of IDEA on NSE
the analysis is as follows-
- The price has been on a good uptrend, now in my opinion i think price has to retrace to recharge its momentum
- i have marked the nearest support zone for price to settle, but just for safety i have marked another support zone below
- be very cautious if you want to counter trade the trend
don't play with fire, always use a predefined stoploss

The Ultimate Beginners Guide to Day TradingHello everyone My name is d3ffyduck
I am today gonna post some cool and new tips For the beginners in Daytrading.
I am gonna divide things in Chapters so you'll learn it with ease
Read it till the end Hope You learn something
Chapter-1 Timeframe selection
The choice of the best timeframe for chart analysis in day trading can vary depending on a trader's strategy, preferences, and the market being traded. Different timeframes offer varying levels of detail and may suit different trading styles.For Example
1-Minute Chart: This timeframe provides very detailed information, showing price movements within one-minute intervals. I prefer Using it for precise entry and exit points In day trading
5-Minute Chart: Slightly less detailed than the 1-minute chart, the 5-minute chart still offers relatively short-term insights into price movements. I use to determine my momentum for the trade i want to hold for like 1-2hrs only
15-Minute Chart: This timeframe offers a broader view of the market compared to shorter intervals. I prefer it to determine my next day momentum of the market
Chapter-2 Support and resistance Using RSI
I know you all knows the basics for support and resistance but today i will show you the best way. Just open your chart and use RSI Indicator and we are going to mark the overbought areas high candle and oversold area lowest candle using it for different time frames.
Just a note from my side do not mark those areas again if there have already a support or resistance line in different time frame and also you can remove those level of S&R which did not hold well in different time frames
1-day time frame=I have marked the regions where the RSI turned in the overbought or oversold areas. As you can see, I have not marked the support and resistance levels since they were already established from previous market overbought and oversold.
4-hour Time frame=In this timeframe, we will only identify the levels that are above 70 and below 30 in the RSI. We'll skip the R&S that are already marked on the daily timeframe. To reiterate, please refrain from marking those levels again if we can observe that our resistance and support levels have already been established on the daily chart.
1-Hour Time Frame = I've set my preferred timeframe to a maximum of 4 to 5 months. I don't want to go below this timeframe as it will create more noise. Additionally, I'll remove the support and resistance levels that didn't react well for buyers and sellers at this point to make the chart look cleaner
Chapter-3 Determining the Trend
Here in this chapter we are going to use only 2 Things to keep everything simple:-
SMA+EMA 200= We are going to use simple indicator or just create yourself one indicator which plots both sma and ema with same 200 timeperiod.
Rules are simple
if below both ma look for short
if above both ma look for long
You can use it for 1hr and 15 min for day trading purpose
Trendlines- Trendlines are your best friend.They are the building block for your Chart pattern look for trendlines in 15 min tf for day trading purpose
Chapter-4 Significance of market opening closing,high,low
This is one of the important chapter for day traders and i am going to tell you how an opening closing high and low effect the whole day trade.
For Example
1-Open your Chart
2-Mark the opening ,closing highs and lows for previous 3-4 days
3-Those area are going to be area of interest
Tip for the beginners. Do not take any trades for the first hour From the opening of the day For example if your market opens in 9:15 am dont take trades until 10:00-10:15 cause of high volatilty
Another Tip for the beginners.If you prefer to take 2 trades a day close your previous 10:00 am trade At around 11:45am -12:15 pm and start looking for another one after that. the reason because i have seen this is the time for the most probable reversal or continuation of trend for the next leg of the day
Chapter-5 Significance of Gaps in the market
Gaps are one of the best way to decide what will be the market trend for the rest of the day
There are two type of gaps in the market 1-Gap up 2- Gap down
Tip for the beginners Only trade in the strong gap up or down and as i said before do not trade in the first hour of the opening
Ill show you some scenarios of gap Trading with respect to opening of the day
Scenario 1st strong gap up+ Stayed above above the gap and opening for the 1 hour(9 am-10am)
We can see we had a strong opening stayed above the gap up and open for atleast 1 hour so after this the trend is decided
Tip for the beginners Always follow strict Risk and Reward ratio like i use 1:1.5
Scenario 2nd strong gap up+ stayed below the gap and opening for the 1 hour(9 am-10am)
We can see we had a strong gap up and opening but price stayed below the opening for 1 hour so we took the short as dropped below previous closing/high
Similarly we can use this for gap down scenarios
Final tip from my side are:-
Do meditation for 15 min before trading hours
Always use stoploss
Use your preferred Risk Reward ratio like 1:1.5
Do not trade in opening Hour
Gaps are like your friend
Trends are like a path to success
Do not overtrade
Dont only rely on indicators there isnt any indicator which can make you rich
Use only basic indicators such as Ema,Macd,Rsi and ATR
PLEASE UPVOTE AND FOLLOW FOR MORE EDUCATIONAL CHARTS AND STRATEGIES

#IFCI LONG TRADE IDEA SETUPGreetings Folks,
today i have prepared a setup of IFCI on NSE
the analysis is as follows-
- the price was in a minor downtrend, its now trying to pick bullish momentum
- there is good volume buildup in past trading sessions
- if nifty opens positive tomorrow, then we can
look to buy this after breakout
don't play with fire, always use a predefined stoploss
