July is Historically a Bullish Month for NiftySaid earlier that NSE:NIFTY could pull back till 25000 and then bounce. And that's exactly what happened.
The quarterly rotation in the market seems to have completed. And today, supply started getting absorbed.
I’ve already mentioned before — July has historically been a positive month for the markets, and that view still stands.
The outlook remains bullish.
Today’s candle in Nifty is a demand candle — it has absorbed nearly half of the selling pressure.
However, the remaining supply is still there, since sellers outnumbered buyers by around 40 million today.
So we’ll turn aggressive only if tomorrow’s early session absorbs this supply.
Ideally, the first hourly candle should take care of it. If that happens, strong momentum can follow.
Otherwise, Nifty might just consolidate for a bit.
Intraday levels for tomorrow:
- Support: 25044
- Resistance: 25202
If 25202 breaks, direct upside target is 25350.
Coming to NSE:BANKNIFTY — today’s candle is indecisive.
If strong momentum doesn’t follow soon, it could drop again.
So it’s important for BankNifty to close above 57098 within the first hour tomorrow.
Support zone will be around 56590.
Talking about sector rotation — NSE:CNXMEDIA topped the charts today. So special focus should be there for intraday trades.
That said, short-term leadership is still with IPOs, Pharma, and Realty sectors.
Right now is the best time to identify quality breakout stocks.
But remember, you also need a solid position management strategy.
Most traders make the mistake of exiting too early in bull markets with small profits — that’s greed.
In bull phases, the goal should be to ride the trend. Don’t follow feelings. Follow your setup.
Stocks like NSE:HPL and NSE:DBREALTY are showing great setups.
Study these setups carefully. Learn from them. Never blindly copy others.
That’s all for today.
Take care.
Have a profitable day ahead.
DBREALTY

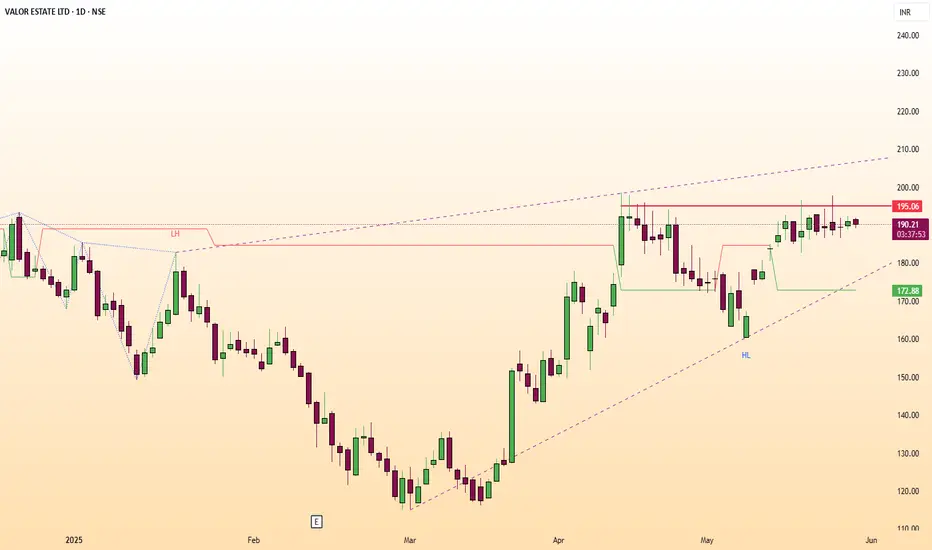
DBREALTY BREAKOUT STOCK📌 Stock Name: DBREALTY
(For Educational Purpose Only)
🔼 Breakout Above: 195 on Closing Basis
🚀 Ready for Upside : 240
🔽 Weak Below: 160
💰 Price: 190
📦 Volume
🔻 -63.63% vs previous session (Low Volume)
⚡ Volatility (ATR%)
📉 Current ATR%: 4.16%
📊 20-Day Avg ATR%: 5.14%
📈 Moving Averages
✅ Price > 50, 100, 200 DMA
🌟 Golden Crossover: 50D > 200D → Bullish
💪 RSI
🔹 Daily RSI: 60.41 → Bullish
🔹 Weekly RSI: 57.66 → Bullish
🔹 Monthly RSI: 55.67 → Bullish
📊 ADX / DMI
🟢 ADX: 31.64 (▲ 2.77%) → Strong Trend
📏 DMI Diff: 59.89%
✅ Daily / Weekly / Monthly: Bullish
📉 Donchian Channel
✅ Price > Middle Band
➖ Bands Flat
📏 Width: 23.24%
☁️ Ichimoku Cloud
✅ Price > Cloud
🔺 Tenkan > Kijun → Bullish Setup
🌫️ Future Cloud Width: 14.42%
📊 Bollinger Bands
✅ Price > Middle Band
📈 Bands Rising → Bullish Setup
📏 Width: 21%
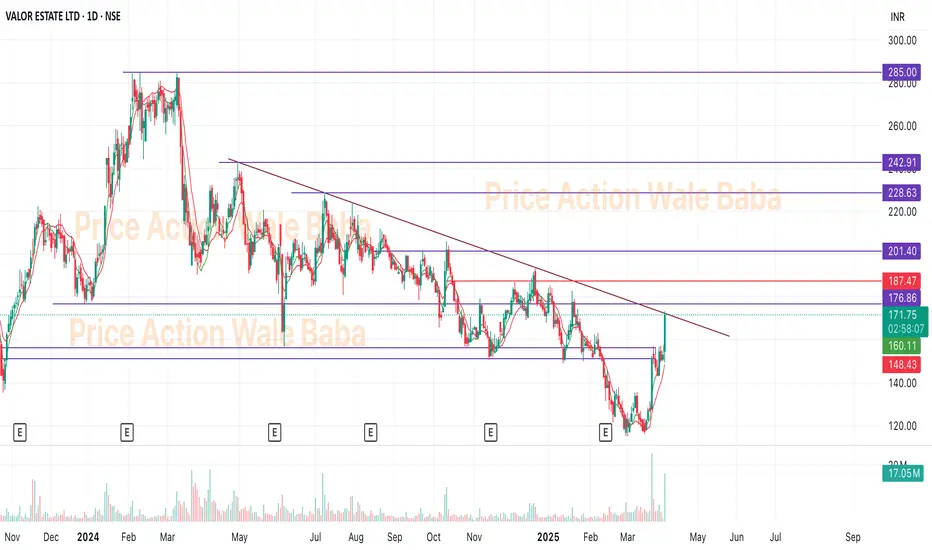
DB Realty - Valor Estate cmp 192.25 by Weekly Chart viewDB Realty - Valor Estate cmp 192.25 by Weekly Chart view
* Support Zone 177 to 187 Price Band
* Resistance Zone 222 to 232 Price Band
* Falling Resistance Trendline broken and price momentum sustained
* Volumes are seen spiking over the past few weeks well above avg trade quantity
* Thou falling yet Bullish Double Rounding Bottoms made with neckline at Support zone

DBReality - Near BreakoutDB Reality near breakout.
After long consolidation, it's ready to give big up move.
It was trading in the channel and consolidation going to end soon.
Hold for the next 1-2 year for the target of 300.
DB REALTY: New Trend incoming!DB REALTY is showing buyers interest at the support and currently looking attractive at CMP of 203. Enter after studying this with your setup. Targets are marked.
NOTE: I'm not a SEBI REG. Study charts before investing.

DBRealty-A chance to have quick multibagger returns!DBRealty had given a multiyear monthly breakout and had given around 50% move already.
However, stock is now retesting the breakout and might come down in range of 150-180.
Safe traders can wait for a reversal pattern like morning star or bullish harami in this zone.
Such a monthly breakout had happened in Purvankara which doubled in 3 months
As realty sector is vastly outperforming, one can expect similar move from this stock as well.
which has also posted decent Q4 results.(Not trustworthy though)
Not a recommendation.

DB Realty Ltd - Fruitful days are Ahead #DBREALTY
CMP ₹.206.6
Date : 28/11/23
1) A turn around company with loss to profit
making.Weak but improving fundamentals .
Highest recovery of stock value from 52 week low.
2) Recently promoters sold nearly 3% stake
with them to clear the entire debt.
3) Hopefully a smooth ride can be
enjoyed for the coming days
Disclaimer : Post only for educational purpose. Not a buying / selling recommendation. This is only my personal view. I am not a SEBI registered analyst . Do your own analysis and act accordingly .

DBREALTY: 10 year Huge Cup DBREALTY is now poised to breakout of the huge 10 year cup with high volume and high RSI. Watch for massive breakout if it happens.

DBREALTY - ichimoku Cloud BreakoutStock Name - D B Realty Limited
Ichimoku Cloud Setup :
1). Today's close is above the Conversion Line
2). Future Kumo is Turning Bullish
3). Chikou span is slanting upwards
All these parameters are showing bullishness at Current Market Price
and more bullishness AFTER crossing 164
#This is not Buy and Sell recommendation to any one. This is for education purpose and a helping hand to learn trading in Market.
#CloudTrading
#IchimokuCloud
#IchimokuFollowers
#Ichimokuexpert
I hope you all like my analysis.
Please do share your thoughts into comment section.
Please give a like, share & subscribe for daily analysis.

DBREALTY FOR MORE THAN 100% IN NEXT...Stock: DBREALTY
Timeframe: Daily chart
Current Price: 134
Channel Breakout Level: 136
Trade Overview:
In this trade idea, we'll analyze DBREALTY, a stock that is poised for a potential breakout of a 2-year channel pattern on the daily chart. The presence of a strong bullish volume surge, coupled with a bullish outlook for the real estate market, enhances the conviction for this trade.
Trade Plan:
1. Entry Strategy:
Enter a long position if DBREALTY' price breaks above the channel breakout level at 136 with a decisive bullish candle.
Confirm the breakout with strong bullish volume, as observed in the last 4-5 days.
2. Stop-Loss:
Set the stop-loss just below the breakout level, around 115. This level should provide reasonable protection against potential false breakouts.
3. Take-Profit Targets:
Set take-profit target 1 at 200, take-profit target 2 at 240, and take-profit target 3 at 300.
Consider taking partial profits at each target level while allowing a portion of the position to run for potentially higher gains.
4. Risk Management:
Given the potential for substantial gains, manage risk diligently. Allocate only a small percentage of your trading capital to this trade (e.g., 1-2%).
As the trade progresses in your favor, consider trailing the stop-loss to lock in profits and protect against sudden reversals.
5. Additional Considerations:
Monitor the broader market trends and real estate sector indicators to validate the potential for a sustained bull run.
Stay informed about any company-specific news or announcements that could impact DBREALTY performance.
Factor in potential resistance levels that might impede the stock's upward movement.
=====================================
Note : This trade idea is for educational purposes only and should not be considered financial advice. Always perform your own research and consider consulting with a financial professional before making trading decisions.

DB REALTY - 175% RETURNS!!!BUY - DB REALTY LTD
CMP - Rs. 90
Target - 1: Rs. 160
Target - 2: Rs. 245
.
.
Technical Analysis - Cup and Handle Pattern
.
.
Fundamentals -
1) DB Realty, founded in 2007, is a Mumbai-based real estate company that operates in the residential, commercial, and hospitality sectors. The company has developed several high-end residential and commercial properties in Mumbai, including Orchid Heights, Orchid Woods, and Orchid Crown. DB Realty has also ventured into the hospitality sector by launching the Hilton Hotel in Mumbai.
2) In terms of financial performance, DB Realty reported a consolidated revenue of Rs. 1,045.5 crores for the fiscal year 2020-2021, which is a decrease of 34.5% from the previous year. The company reported a net profit of Rs. 8.3 crores for the same period, which is a significant improvement from the previous year's net loss of Rs. 224.3 crores. The company's debt-to-equity ratio stood at 0.87, indicating that the company has a higher debt component in its capital structure.
3) DB Realty's business model relies heavily on project-dependent revenues. This means that the company generates most of its revenue from selling properties under development. As a result, the company's financial performance is highly dependent on the timely completion and sale of its projects. Additionally, the real estate industry is highly cyclical, and the demand for properties is subject to macroeconomic factors such as interest rates, inflation, and economic growth.
4) In terms of future prospects, DB Realty plans to launch several new projects in Mumbai, including a luxury residential project in Bandra and a commercial project in Andheri. The company has also announced plans to expand its hospitality business by launching new hotels in Mumbai and other major cities in India.
5) Overall, while DB Realty has a strong presence in the Mumbai real estate market and has shown improvement in its financial performance, it faces significant challenges in terms of legal and regulatory issues and the cyclical nature of the real estate industry. Investors should carefully evaluate these factors before making any investment decisions.
.
.
Follow me for more!

How to trade DBRealty going forward?This stock has formed a pattern called Double Bottom, providing a target price for the intermediate-term in the range of 87-89.
The price recently crossed above its moving average signaling a new uptrend has been established.
It appears that the price of DBRealty has reached a low point and then rebounded, indicating a potential reversal of its downward trend towards a new uptrend. This can be further confirmed by observing the Double Bottom chart pattern, which consists of two distinct lows occurring at roughly the same price level during a downtrend. As the pattern forms, there is typically a decrease in selling pressure, indicated by a decrease in trading volume. Finally, when the price breaks above the highest high point between the two lows, it confirms a bullish signal for the asset's future direction.
Note for everyone who came across this study:
This chart is only for educational purpose.
This is not buying or selling recommendations.
I am not SEBI registered.
Please consult your financial advisor before taking any trade.

DB Reality ready for a long weekly breakoutA long weekly breakout is ready for DB reality with volume support. Just information, No recommendation. Do your own analysis before entering.


DB REALTY LONGA clear cup and flag formation can be seen in the weekly charts of DB RELTY. IT IS THEN FOLLOWED BY A GOOD BREAKOUT WITH GREAT VOLUMES!!! (OPEN CHART OF DETAILED VIEW)
A retrace can be seen till the level of 25 (dotted line). Bullishness is seen in the stock!!
LEVELS:
Entry: CMP
Target 1: 34
Target 2: 41
Target 2: 51
STOP LOSS: 19-20
TRAIL STOP LOSS
RSI in momentum zone
MACD just gave a crossover
MA CROSS started showing bullish phase
Risk-Reward Ratio FAVORABLE
I would recommend going long on DB REALTY for a swing trade at prescribed levels
FOLLOW IF YOU LIKE THE ANALYSIS
LIKE AND COMMENT WHAT YOU THINK ABOUT THIS
THANKS
