BUY TODAY SELL TOMORROW for 5%DON’T HAVE TIME TO MANAGE YOUR TRADES?
- Take BTST trades at 3:25 pm every day
- Try to exit by taking 4-7% profit of each trade
- SL can also be maintained as closing below the low of the breakout candle
Now, why do I prefer BTST over swing trades? The primary reason is that I have observed that 90% of the stocks give most of the movement in just 1-2 days and the rest of the time they either consolidate or fall
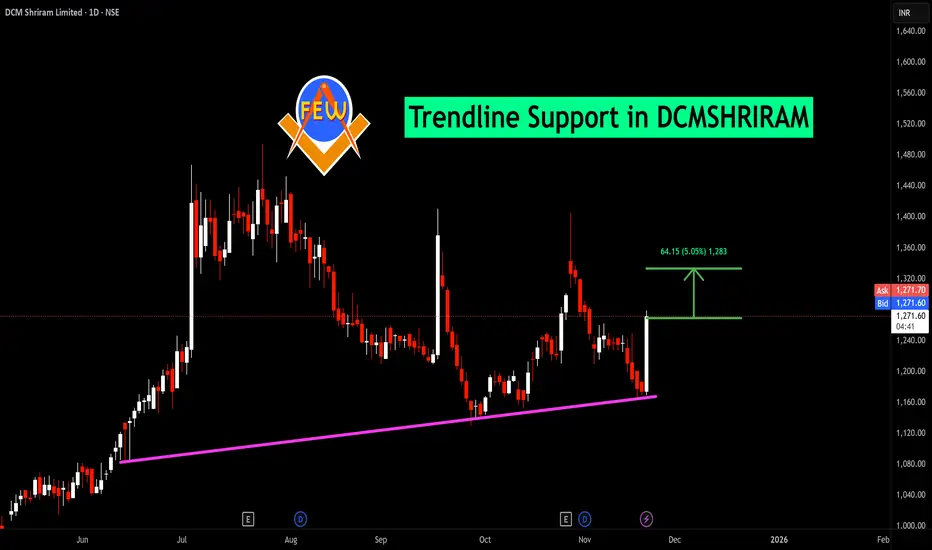
Trendline Support in DCMSHRIRAM
BUY TODAY SELL TOMORROW for 5%
DCMSHRIRAM
DCM Shriram - Continuation PatternA Continuation pattern is being formed. It may take some time to breakout, but it looks certain that when the breakout happens it could fly.
Strong ability to service debt as the company has a low Debt to EBITDA ratio of 0.09 times
The company has declared positive results in Dec'2024 after 3 consecutive negative quarters
PBT LESS OI(Q) At Rs 344.43 cr has Grown at 102.5 %
PAT(Q) At Rs 262.14 cr has Grown at 101.1 %
CASH AND CASH EQUIVALENTS(HY) Highest at Rs 1,756.50 cr
With ROE of 7.9, it has a Fair valuation with a 2.7 Price to Book Value
The stock is trading at a premium compared to its average historical valuations
While the stock has generated a return of 12.40%, its profits have risen by 5.3%
PEG ratio of the company is 6.26

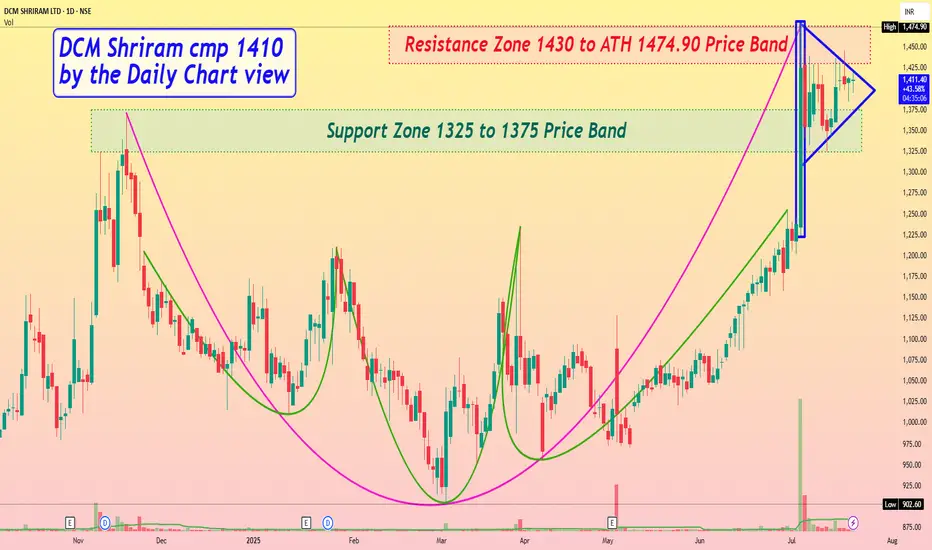
DCM Shriram cmp 1410 by the Daily Chart viewDCM Shriram cmp 1410 by the Daily Chart view
- Support Zone 1325 to 1375 Price Band
- Resistance Zone 1430 to ATH 1474.90 Price Band
- Support Zone been tested retested good and stock now consolidating
- *Bullish Pole and Flag pattern made around Support Zone and Resistance Zone*
- Volumes are flattish to slightly falling, need to increase for fresh upside breakout
DCMSHRIRAM for 35% (approx..) Potential GainDCM SHRIRAM is showing Darvas box breakout with decent amount of volume..
b] All data is available in public domain..
CMP : 1300
TG : 1700
SL : 1165
TSL : Below 21 EMA
Stock's selection based on 5 Point Analysis:
1: Idea : Breakout.
2: Support : Volume, Delivery & VWAP.
3: Technical : 9/21/55/200-EMA, RS>0, MACD, RSI & Super trend up.( To view this click : sedg.in )
4: Fundamental : PE, PAT, Industry & peer PE and sector performance.
5: Timing : Entry Timing on Daily chart.
Disclaimer : It is my personal view as a trader and for educational purpose only. Equity market involves risk .
Please consult your financial adviser before taking any decision.

Breakout in DTF | DCM SHRIRAM IND LTD⭕️ Investing opportunity: Price Action Analysis Alert !!!⭕️
💡✍️Technical Reasons to trade or Strategy applied :-
✅Trendline+Zone Breakout in DTF🔥
✅Making Strong Chart Pattern💪
✅ Making Higher Lows (Bullish Sign)🚀
✅Strong EMA Indicator🚨
✅ Volume Spike⬅️
✅Check out my TradingView profile to see how we analyze charts and execute trades.
🙋♀️🙋♂️If you have any questions about this stock, feel free to reach out to me.
📍📌Thank you for exploring our idea! We hope you found it valuable.
🙏FLLOW for more !
👍LIKE if useful !
✍️COMMENT Below your view !

DCM Shriram End of Bottom formationDCM Shriram posted fantastic Q2FY25 YoY with 95% profit. Debtor days reduced. Reduction in equity dilution. Q1 & Q2 posted improved YoY numbers with respect to sales & profit. Operating profit improved. Expecting margins and ROCE to improve. Price is just crossed above 50 Day moving average. Technical looks good. Could expect breakout soon.
Disclaimer: Not holding. Educational purpose

DCM SHRIRAM#DCMSHRIRAM
Timeframe: Daily
Resistance Level Breakout
Support level: 1000
Good looking above : 1230 level

DCM SHRIRAM - Swing Trade Analysis - 3rd April #stocksDCM SHRIRAM (1W TF) - Swing Trade Analysis given on 3rd April, 2024
Pattern: REVERSAL AT WEEKLY SUPPORT
- Pullback candle at Weekly Support - Done ✓
- Strong Volume candle at Support - In Progress
- Demand Zone Retest & Consolidation - In Progress

Just A View - Double Top - DCMSHRIRAM📊 Script: DCMSHRIRAM
📊 Sector: Diversified
📊 Industry: Diversified - Mega
Key highlights: 💡⚡
📈 Script is trading near neck line that is support of Double Top pattern as seen into the chart .
📈 Script may take support at 862 level and bounce back from there.
📈 One can go for swing trade for medium to long term.
⏱️ C.M.P 📑💰- 872
⚠️ Important: Always maintain your Risk & Reward Ratio.
✅Like and follow to never miss a new idea!✅
Disclaimer: I am not SEBI Registered Advisor. My posts are purely for training and educational purposes.
Eat🍜 Sleep😴 TradingView📈 Repeat 🔁
Happy learning with trading. Cheers!🥂

DCMSHRIRAM | Investment Pick📊 Details
DCM Shriram is engaged in the business of manufacturing facilities of Fertiliser, Chloro Vinyl & Cement in Kota (Rajasthan) and of Chlor- Alkali in Bharuch (Gujrat).(Source : Company Web-site )
Disclaimer: This analysis is solely for educational purposes and does not make me a SEBI registered analyst.
If you found this analysis helpful, I encourage you to like and share it. Your observations and comments are also welcomed below. Your support, likes, follows, and comments motivate me to consistently share valuable insights with you.
🔍 More Analysis & Trade Setups 🔍
For more technical analysis and trade setups, make sure to follow me on TradingView: www.tradingview.com


DCMSHRIRAM - Bullish Consolidation with VolumesNSE: DCMSHRIRAM is closing with a bullish consolidation candle supported with volumes.
Today's volumes and candlestick formation indicates strong demand and stock should move to previous swing highs in the coming days.
The stock has been moving along the horizontal support for the past few days which is indicating demand.
One can look for a 8% to 11% gain on deployed capital in this swing trade.
The view is to be discarded in the event of the stock breaking previous swing low.
#NSEindia #Trading #StockMarketindia #Tradingview #SwingTrade

Big Fresh Breakout📈 Exciting Bullish Pattern Alert! 🐂
📊 Pattern: Fresh Breakout
📌 Symbol/Asset: DCM SHRIRAM
🔍 Description: Buy on Dips
👉 Remember: Technical patterns are just one piece of the puzzle. Consider conducting further research, consulting with a financial advisor, and managing your risks appropriately.

DCMSHRIRAM Long (04 Aug)DCMSHRIRAM Long (04 Aug)
RSI- 63
Trading above all moving averages, rising volume
Buy at CMP- 1030
SL- 1000
Target- 1105, 1165
Join us, Learn more, Earn more
Disclaimer- We are not SEBI registered advisor.
Charts and views are only for educational purpose.


DCM
CMP: 100
- Volatility Contraction pattern
- Breakout did not sustain today
- I will add with SL just below today's low


Dcm shriramDcm shriram following trend above 1095 can push towards 1300, else will come down to it's lower trend line.

DCM Shriram breakoutDCM Shriram on the verge of breakout above 1200.
If gives closing above 1200 in 10 mins candle then can touch 1250 in intraday.
all the levels are mentioned on the chart.
Disclaimer: For educational purpose only.
Follow for daily analysis.

DCM Shriram industries, DRONE Stock
#DCMSRIND
#DCM
Added DCM Shriram industries for long term portfolio.
Added at 110 yesterday and 114 today.
Pending GTT at 106 and 104
REASON: DRONE INDUSTRY BENIFICIARY
RISK: New in the market🙈
#vr


DCM Shriram Ltd - 07.01.2022DCM Shriram Ltd - 07.01.2022
The stock is trading @ 998 levels
There is a RESISTANCE Zone @ 1040 levels
The prices are above EMA
There is a RSI overbought in Monthly Chart
Let the prices go above 1045
watch out for the price action

DCMSHRIRAM Long Idea (Intraday)After sideways structure price is near breakout, Looking good above 1070 level.
