CCL Products cmp 970.50 by Daily Chart viewCCL Products cmp 970.50 by Daily Chart view
- Support Zone 890 to 930 Price Band
- Resistance Zone 970 to 1015 Price Band
- Volumes in close sync with avg traded qty
- Rising Price Channel seem been well sustained
- Descending Triangle pattern breakout anticipated
- Technical Indicator trending positively thru Jan 2026
Descending Triangle

SHARDACROP: Strong Q3, Descending Trainlge BO, Chart of the WeekFrom Descending Triangle Breakout to Q3FY26 Glory: Why Sharda Cropchem's Could Be Your Next Big Move Lets Understand in "Chart of the Week"
As per the Latest SEBI Mandate, this isn't a Trading/Investment RECOMMENDATION nor for Educational Purposes; it is just for Informational purposes only. The chart data used is 3 Months old, as Showing Live Chart Data is not allowed according to the New SEBI Mandate.
Disclaimer: "I am not a SEBI REGISTERED RESEARCH ANALYST AND INVESTMENT ADVISER."
This analysis is intended solely for informational purposes and should not be interpreted as financial advice. It is advisable to consult a qualified financial advisor or conduct thorough research before making investment decisions.
Price Action Analysis:
Long-Term Trend Overview:
- The stock has demonstrated a multi-year uptrend from 2021 levels around 300-350 to current levels near 1,035
- A significant rally occurred from mid-2021 to early 2025, where the stock surged from approximately 350 to an all-time high of 1,181
- Post the January 2025 peak, the stock has entered a consolidation phase with a descending triangle pattern formation
- Current price of 1,035.85 (as of January 31, 2026) represents a 28.46% gain, showing strong momentum recovery
Recent Price Action Characteristics:
- The stock made an all-time high of 1,181 in early January 2025
- Following the peak, a corrective phase ensued with the formation of lower highs
- A clear descending trendline can be observed connecting the highs from January 2025 peak through subsequent rallies
- The stock found support multiple times around the 750-800 zone, establishing this as a critical demand area
- On January 31, 2026, the stock broke above the descending trendline with a strong bullish candle supported by robust volumes (11.25M shares traded)
Key Technical Patterns:
- Descending Triangle Pattern: The chart clearly shows a descending triangle structure with lower highs and a flat support base around 750-800
- Trendline Break: The recent price action has broken through the descending resistance trendline, which is a classic bullish reversal signal
- The breakout was accompanied by good volumes of 2.03M (shown in green), indicating strong buying interest
- The price action suggests a potential trend reversal from the consolidation phase to a new uptrend
Volume Spread Analysis:
Volume Trends and Characteristics:
- The volume chart shows sporadic high-volume days during the entire period
- The recent breakout candle is accompanied by elevated volumes of 11.25M shares
- Volume of 11M is above average, confirming the validity of the breakout
- Historical volume spikes are observed during significant price movements, both up and down
Volume-Price Correlation:
- During the 2021-2022 rally, several high-volume green bars supported the upward price movement
- The consolidation phase from January 2025 to January 2026 saw relatively lower volumes, typical of a basing pattern
- The recent breakout is validated by the volume surge, a positive technical sign
- Absence of high red volume (selling pressure) during the breakout indicates limited supply
Volume Implications:
- The volume profile suggests strong institutional participation during key price movements
- The current breakout with good volume indicates conviction among buyers
- Sustained volumes above the 2-3M range would confirm continued buying interest
- Any pullback on lower volumes would be healthier and offer better entry opportunities
Support and Resistance Analysis:
Major Support Levels:
- Primary Support Zone: 750-800 (tested multiple times during the consolidation phase, proving to be a strong demand zone)
- Secondary Support: 700 (psychological level and previous consolidation area)
- Critical Support: 600-650 (major swing low from mid-2024, breaking this would invalidate the bullish structure)
- Long-term Support: 500 (aligns with historical resistance turned support from early 2024)
Major Resistance Levels:
- Immediate Resistance: 1,100 (previous consolidation high and psychological barrier)
- All-Time High Resistance: 1,181 (needs to be reclaimed for continuation of uptrend)
- Potential Resistance: 1,200-1,250 (psychological round numbers)
- The broken descending trendline around 900-950 zone may now act as support on any pullbacks
Base Formation Analysis:
- The stock has formed a strong multi-week base between 750 and 800
- This base structure resembles a consolidation platform after a strong uptrend
- The base formation duration provides strong foundation for the next leg up
- The base is indicating accumulation rather than distribution
Technical Pattern Analysis:
Descending Triangle Breakdown and Resolution:
- Pattern Formation: The descending triangle started forming from the January 2025 high at 1,181
- Pattern Characteristics: Lower highs (descending resistance) meeting horizontal support at 750-800
- Pattern Resolution: The recent upward breakout from the descending trendline on January 31, 2026
- Breakout Confirmation: Strong bullish candle with +28.46% gain and volume of 11.25M shares
Short-Term Trend Assessment:
- The recent breakout candle establishes a strong bullish bias in the short term
- The stock has moved from a downtrend (within the triangle) to potentially starting a new uptrend
- Higher high formation above 1,035 would confirm the trend reversal
- The immediate trend is bullish with the breakout above both the trendline and the 900-950 resistance cluster
Medium-Term Outlook:
- The stock needs to sustain above 950-1,000 levels to confirm medium-term bullish structure
- A move above the previous high of 1,181 would resume the primary uptrend
Long-Term Perspective:
- The overall structure from 2021 remains bullish with higher lows and higher highs
- The current consolidation is a healthy correction within a larger uptrend
- Long-term investors can view the 750-800 zone as a strong accumulation area
- The secular trend in the agrochemical sector supports the long-term bullish thesis
Fundamental and Business Overview:
Company Profile and Business Model:
- Sharda Cropchem Ltd is engaged in the marketing and distribution of agrochemicals globally
- The company operates an asset-light business model, focusing on identifying generic molecules, preparing dossiers, seeking registrations, and marketing through distributors
- Core product portfolio includes formulations and generic active ingredients across fungicide, herbicide, and insecticide segments
- The company also operates a non-agrochemicals business including conveyor belts, V-belts, dyes, and industrial chemicals
Geographic Revenue Distribution:
- Europe: Contributes approximately 53% of agrochemical revenue, making it the largest market
- NAFTA (North America): Accounts for around 34% of agrochemical business
- Latin America (LatAm): Represents about 9-10% with high growth potential
- Rest of World: Includes India and other emerging markets
- The company has a presence across 80+ countries with over 150 distributors in India alone
Registration Portfolio and Competitive Moat:
- The company has 2,821 active product registrations globally as of March 2023
- Strong pipeline of 1,143 registrations under process, mainly in EU, US, and LatAm
- The registration process serves as a significant entry barrier due to high costs, complexity, and time requirements
- The company invests approximately 350-400 crores per annum toward new product registrations
- Registrations in highly regulated markets (EU, US) provide sustainable competitive advantages
Recent Financial Performance:
Q3 FY26 Results Highlights (Quarter Ended December 2025)
- Net Sales: Rs 1,288.76 crores, representing 38.7% YoY growth
- Net Profit: Rs 145.12 crores, a stellar 365.87% YoY surge from Rs 31.15 crores in Q3 FY25
- PAT Margin: Expanded dramatically to 11.26% from 3.35% in Q3 FY25, a gain of 791 basis points
- Gross Profit Margin: Stood at 20.32%, significantly improved from 12.36% in Q3 FY25
- The margin expansion reflects improved product mix, better pricing realization, and effective cost management
Nine-Month FY26 Performance (April-December 2025):
- Consolidated Net Sales: Rs 3,202.68 crores, up 27.57% YoY
- Net Profit: Rs 362.21 crores, representing 257.33% YoY growth
- ROCE: Impressive 20.85% for the nine-month period, the highest recorded in recent periods
- The company declared an interim dividend of Rs 6 per share
- Strong cash generation and zero-debt balance sheet underscore financial strength
Financial Trend and Quality Metrics:
- Five-year Sales CAGR: 17.65%, demonstrating consistent top-line growth
- Five-year EBIT CAGR: 21.17%, showing strong operational leverage
- Debt Status: Company is almost debt-free, providing financial flexibility
- EBIT to Interest Coverage: Average of 100 times, indicating negligible debt burden
- Return on Equity: Currently at 9.89% over last 3 years (considered low, but improving)
Sectoral and Industry Backdrop:
Indian Agrochemical Market Overview
- Market Size: The Indian agrochemical market is valued at approximately USD 8-9 billion in 2025
- Growth Trajectory: Expected to grow at a CAGR of 5.5-7.5% during 2026-2032 period
- Market Drivers: Rising population, increasing food demand, agricultural intensification, and government support
- India is ranked as one of the top 10 consumers and producers of agrochemicals globally
Market Dynamics and Growth Drivers:
- Food Security Imperative: India's population projected to reach 1.5 billion by 2030, necessitating enhanced agricultural productivity
- Crop Loss Prevention: Annual crop losses due to pests, weeds, and diseases estimated at 15-25%, valued at USD 10-15 billion
- Land Constraints: Declining arable land per capita due to urbanization drives need for yield optimization
- Technology Adoption: Increasing adoption of precision farming, drone spraying, and fertigation systems
- Export Opportunity: India's status as a net exporter strengthened by global demand for generic agrochemicals
Government Initiatives and Policy Support
- Make in India: Government recognizes agrochemical industry as one of top 12 industries for global leadership
- Subsidy Programs: Continued support through fertilizer subsidies (INR 3.68 lakh crore committed till March 2025)
- PM-PRANAM Scheme: Launched in 2023 to incentivize balanced fertilizer use and alternative technologies
- Drone Subsidies: Up to 40% subsidy on drone purchases for precision spraying
- Digital Infrastructure: Integration of land records, soil health cards, and farmer databases to facilitate input access
Segment-wise Market Trends
- Fertilizers: Hold 55% market share, driven by high applicability across all cropping systems
- Pesticides: Growing at faster CAGR of 10.52% through 2030, with focus on herbicides and fungicides
- Insecticides: Dominate with 72.5% of pesticide market due to tropical climate and pest pressure
- Biopesticides: Emerging segment accounting for 15% of market, driven by sustainability focus
- Regional Dynamics: South India projected to show highest growth due to horticulture and high-value crop expansion
Industry Challenges and Headwinds:
- Chinese Dependence: High reliance on Chinese suppliers for raw materials and active ingredients
- Import Dependency: Trade deficit of around USD 31 billion in chemicals sector due to infrastructure bottlenecks
- Pricing Pressure: Competition from low-priced Chinese products putting pressure on realizations
- Regulatory Complexity: Increasing cost of registrations and re-registrations in developed markets
- Working Capital Intensity: Large inventory and receivables requirements due to wide product portfolio and geography
Competitive Positioning and Business Strengths:
Sharda's Competitive Advantages:
- Asset-Light Model: Focus on registration, marketing, and distribution rather than manufacturing
- Registration Moat: 2,821 active registrations create significant barriers to entry
- Global Footprint: Presence in 80+ countries with diversified revenue streams
- Developed Market Focus: 83-85% revenue from Europe and NAFTA, which are high-value, stable markets
- Debt-Free Balance Sheet: Provides financial flexibility for growth investments
Business Model Strengths:
- Third-Party Manufacturing: Partnerships with manufacturers allow capital-efficient scaling
- Diversified Portfolio: Over 200 products across multiple crop protection categories
- Strong Pipeline: 1,143 registrations in process ensure future revenue visibility
- Direct Sales Force: Building own sales teams in key markets (Europe, US, Canada, Mexico) in addition to distributors
- Non-Agro Diversification: 17% revenue from non-agrochemical business reduces concentration risk
Strategic Positioning in Generic Agrochemicals:
- Generic Focus: Targets off-patent molecules where 75% market share is still held by innovators
- Value Proposition: Offers cost-competitive alternatives to multinational brands
- Regulatory Expertise: Proven capability in navigating complex registration processes in developed markets
- Customer Relationships: Supplies to MNCs as well as end customers, providing multiple revenue channels
- Quality Compliance: Meets stringent regulatory standards of EU and US markets
Valuation Metrics:
- P/E Ratio: Trading at 20x trailing earnings, below industry average of 29x
- EV/EBITDA: 10.61x appears reasonable given the 365.87% profit growth trajectory
- PEG Ratio: 0.18 suggests the stock is significantly undervalued relative to its growth
- Dividend Yield: 0.91% with conservative payout ratio of 84.89% for FY25
Key Strengths:
- Strong quarterly momentum with 365.87% YoY profit growth in Q3 FY26
- Expanding margins (PAT margin up 791 bps YoY) indicating operational improvement
- Record ROCE of 20.85% demonstrating efficient capital deployment
- Zero-debt balance sheet providing safety and growth flexibility
- Technical breakout from year-long consolidation backed by strong volumes
Risk Factors and Concerns:
- Dependence on Chinese Suppliers: Raw material sourcing concentrated in China exposes to currency and policy risks
- Competitive Pricing: Generic nature of business faces pricing pressure from both innovators and other generic players
- Working Capital Intensity: High debtors of 165 days and large inventory requirements
- Regulatory Risks: Stroke of pen risk where simplified registration processes could erode competitive moat
- MNC Competition: Large multinationals with better brand equity and distributor relationships
- Seasonality: 35-40% revenue and 50-55% profit concentrated in certain quarters
Management Guidance and Outlook:
- FY26 Guidance: Company targets 15%+ topline growth with EBITDA margins in 15-18% range
- Capex Plans: Rs 400-450 crore planned investment in registrations for FY26
- Registration Pipeline: Focus on strengthening portfolio across Europe, NAFTA, and LatAm
- Margin Trajectory: Gross margins expected to stabilize around 30-35% range with input cost normalization
- Geographic Expansion: Continued strengthening of sales force in key markets
Sectoral Tailwinds Supporting Growth:
- Indian agrochemical market growing at 5.5-7.5% CAGR through 2032
- Global demand for generic agrochemicals increasing as patents expire
- Government support through Make in India and agricultural modernization programs
- Increasing adoption of precision farming and technology-driven agriculture
- Export opportunities expanding as India becomes a preferred sourcing destination
Monitoring Parameters:
- Volume Consistency: Weekly volumes should sustain above 1.5-2M for continued momentum
- Support Holding: 750-800 zone must hold on any pullbacks
- Quarterly Results: Track margin trends and volume growth in subsequent quarters
- Sectoral Trends: Monitor agrochemical industry news, Chinese raw material prices, and global demand
- Competitive Action: Watch for pricing pressures or market share changes
My 2 Cents:
- Sharda Cropchem has broken out of a descending triangle pattern with strong volumes
- The 750-800 support zone has proven to be a robust demand area tested multiple times
- Volume-backed breakout on January 31, 2026 (+28.46%) confirms buying conviction
- The stock is transitioning from consolidation to a potential new uptrend
- The stock presents a compelling combination of technical breakout and fundamental improvement
- Strong quarterly numbers have acted as a catalyst for the technical pattern resolution
- Valuation at 20x P/E with PEG of 0.18 suggests room for re-rating
- The 750-800 base provides a strong foundation for the next leg of upward movement
Full Coverage on my Mid-Week Newsletter coming Wednesday.
Keep in the Watchlist and DOYR.
NO RECO. For Buy/Sell.
📌Thank you for exploring my idea! I hope you found it valuable.
🙏FOLLOW for more
👍BOOST if you found it useful.
✍️COMMENT below with your views.
Meanwhile, check out my other stock ideas on the right side until this trade is activated. I would love your feedback.
As per the Latest SEBI Mandate, this isn't a Trading/Investment RECOMMENDATION nor for Educational Purposes; it is just for Informational purposes only. The chart data used is 3 Months old, as Showing Live Chart Data is not allowed according to the New SEBI Mandate.
Disclaimer: "I am not a SEBI REGISTERED RESEARCH ANALYST AND INVESTMENT ADVISER."
This analysis is intended solely for informational purposes and should not be interpreted as financial advice. It is advisable to consult a qualified financial advisor or conduct thorough research before making investment decisions.

RVNL cmp 319.15 by Daily Chart viewRVNL cmp 319.15 by Daily Chart view
- Support Zone 294 to 306 Price Band
- Resistance Zone 332 to 345 Price Band
- Support Zone tested retested over past few days
- Support Zone since January 2025 seems been sustained
- Volumes below avg traded quantity, need to increase for fresh upside
- Breakout from Descending Triangle pattern might be in the making process

Walchandnagar Inds cmp 172.50 by Weekly Chart viewWalchandnagar Inds cmp 172.50 by Weekly Chart view
- Support Zone 144 to 163 Price Band
- Resistance Zone 205 to 225 Price Band
- Support Zone tested retested over past few weeks
- Volume spiked heavily last week and above avg traded qty

Info Edge India cmp 1377.70 by Daily Chart viewInfo Edge India cmp 1377.70 by Daily Chart view
- Support Zone 1268 to 1315 Price Band
- Resistance Zone 1405 to 1455 Price Band
- Darvas Box : Stock trading in 1300 to 1432 Range
- Falling Resistance Trendline Breakout attempts made
- Volumes spiking regularly above average traded quantity

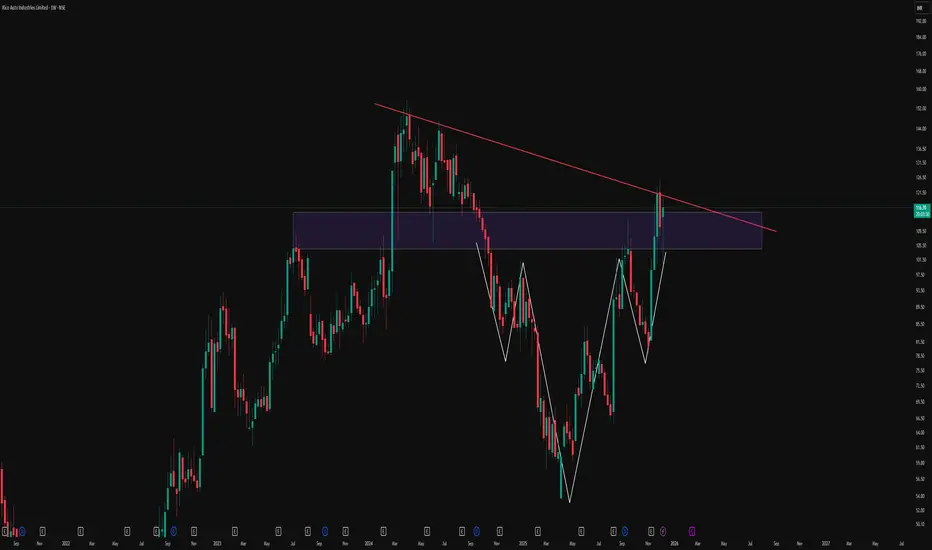
Reclaiming The Breakdown: Descending Triangle To Inverse HnSThis weekly chart of Rico Auto illustrates how structure can evolve over time and why rigid bias around a single pattern can be misleading. Price initially respected a clear descending trendline, forming a classic descending triangle and eventually breaking down below the support zone. Instead of continuing in a straight-line downtrend, the market absorbed that move and began to build a broader basing structure.
Over the following swings, price developed an inverted head and shoulders formation, highlighted here with the white structure, right inside and just below the prior breakdown area. As the pattern matured, price not only reclaimed the prior horizontal zone but also pushed back toward the original red counter-trendline that once acted as dynamic resistance. The same trendline that confirmed the initial triangle breakdown is now being revisited, showing how former breakdown structures can later turn into key decision zones rather than one-way signals.
This chart is shared purely to study how multiple patterns can co-exist and morph on higher timeframes:
-A descending triangle that initially breaks to the downside
-A subsequent inverse head and shoulders basing pattern
-A later reclaim of the old breakdown area and retest of the descending trendline
Disclaimer
This post is for educational and illustrative purposes only and is not investment, trading, or financial advice. Please do your own research and consult a registered financial professional before making any trading or investment decisions.
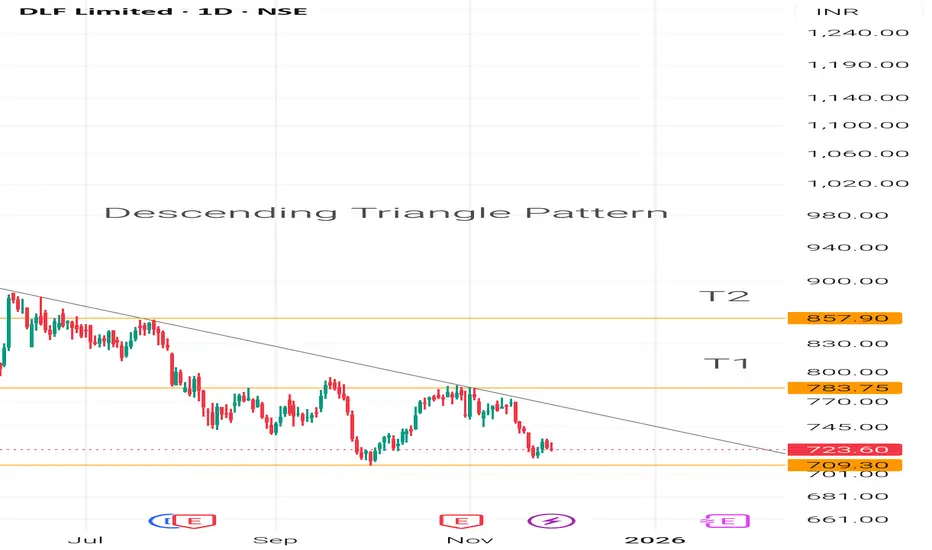
Descending Triangle PatternThis can be a profitable trade because of :
1. The stock is forming Descneding Triangle Pattern which can give potential momentum till 12-15%.
2. The stock's current low is a bit above the previous one and can be also see in the RSI.
3. DLF has given very strong QoQ resultand has shown very high profit.
The Stock's upcoming target are marked using Trend based Fibonacci Extension Tool.
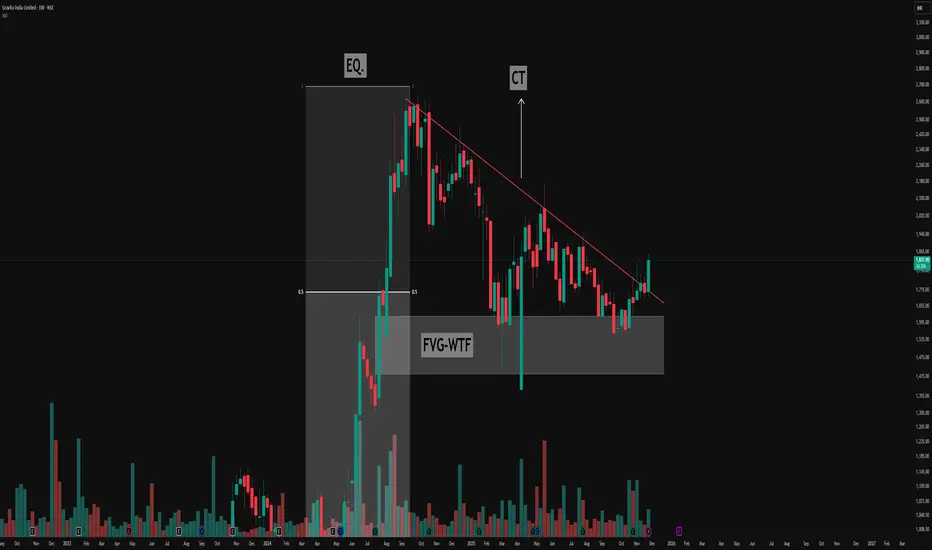
Decoding the Descending Triangle: Key Structure & FVG🔻Understanding the Pattern
- The chart above highlights a classic descending triangle pattern, easily visible by its series of lower highs (marked in red) and a relatively consistent demand zone acting as support.
- This resistance trendline (CT—Contraction Trendline) has been tested multiple times, confirming its significance as sellers consistently respond to price rallies by pushing back from lower levels.
🔻Equilibrium and Price Exploration
- Notice how price action moves from the equilibrium zone (EQ.)—the midpoint of the major move (from lows to all-time highs). This is a key area where supply and demand often rebalance
- The triangle structure forms as buyers continue to find value at support, while sellers become increasingly aggressive at lower highs, compressing price action over time.
🔻Weekly Fair Value Gap (FVG) in Focus
- A prominent Weekly Fair Value Gap (FVG-WTF) is identified, which price has tapped multiple times. This repeated interaction demonstrates its importance as a liquidity pocket where imbalances are re-tested and absorbed.
- Each revisit to this FVG offers a valuable lesson on how strong institutional levels serve as magnets, attracting price to resolve open liquidity.
This post is for educational purposes, highlighting how price structures can be interpreted without suggesting any forecast or trade.
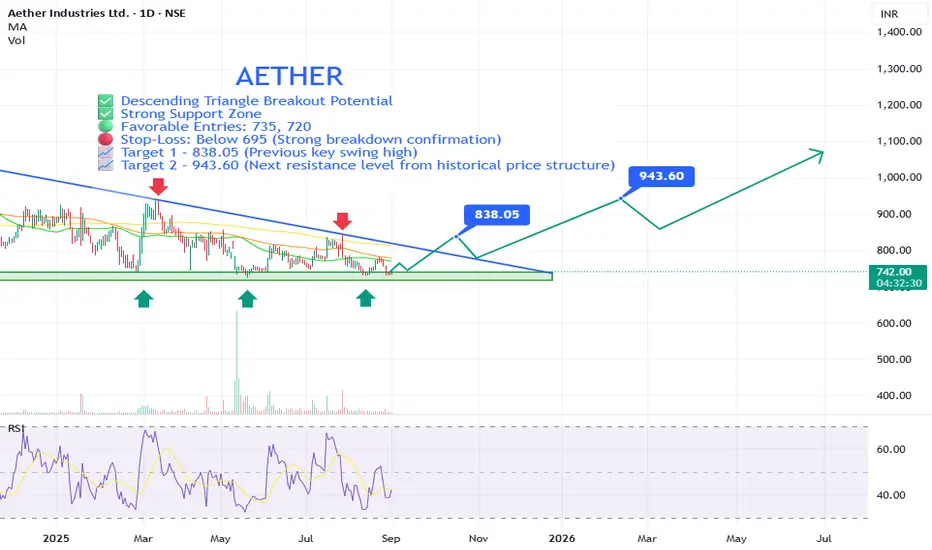
AETHER Bullish Reversal Setup with Strong Risk-Reward PotentialAether Industries Ltd is showing signs of a potential trend reversal from a well-established support zone, supported by a descending triangle breakout pattern and improving technical indicators. This setup suggests a strong risk-reward opportunity for swing traders and positional investors.
⚡ Key Technical Points:
🔵 Descending Triangle Breakout Potential: The price is nearing a breakout from a long-term descending triangle. A breakout above the trendline (~₹778–₹790) could trigger a strong uptrend.
🟢 Strong Support Zone: ₹700–₹720 has held as solid support multiple times (as marked by green arrows), indicating strong demand at these levels.
🟩 Bullish Divergence on RSI: Relative Strength Index (RSI) is showing higher lows while price remains flat or lower, indicating bullish divergence—a sign of potential reversal.
🟢 Favorable Entries: 735, 720
🔴 Stop-Loss: Below 695 (Strong breakdown confirmation)
📈 Target 1 – 838.05 (Previous key swing high)
📈 Target 2 – 943.60 (Next resistance level from historical price structure)
✅ Why This Is a Technically Strong Setup:
✅ Multiple Support Bounces: 700–720 zone has been tested at least 4 times in the last year, showing strength.
✅ Volume-Based Reactions: While volume is low now, past spikes at support zones suggest institutional interest.
✅ Clear Risk Management: Stop-loss is tight (~6–7%) with targets offering 1.5–3x risk-reward potential.
✅ Potential Trend Reversal: Break above descending trendline and moving averages could signal a shift to bullish structure.
✅ Long Base Formation: The stock has been consolidating for over a year—long base formations often lead to explosive moves.
📢 Disclaimer: This is not financial advice. Always do your own research or consult with a professional before making investment decisions.
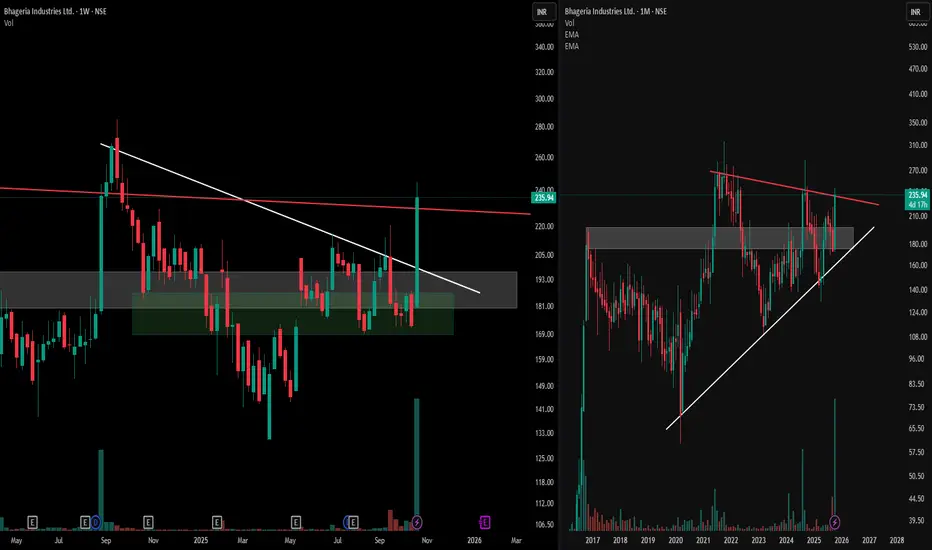
Mastering MTFA Charts : Symmetrical & Descending PatternsObserve the synergy of multiple time frames with this detailed analysis of Bhageria Industries Ltd.
Target Points -
1) The right panel displays a monthly chart, highlighting a broad symmetrical triangle formation within a prominent supply-demand zone—notice how the structure showcases the interplay of lower highs and higher lows, reflecting a period of equilibrium and market compression.
2) The left panel brings the focus to the weekly time frame, where a descending triangle pattern unfolds, providing additional insight into the ongoing price structure.
3) This multi-time frame approach emphasizes how patterns from broader time frames interact with shorter-term consolidations, enhancing our ability to spot critical decision areas on the charts.
4) Using both the monthly and weekly perspectives together, traders and learners can deepen their understanding of structural price action, pattern development, and the relevance of context provided by supply and demand zones. Dissecting these formations side by side promotes disciplined, informed chart reading without bias towards anticipating outcomes.
This analysis is for educational purposes only and does not constitute financial advice.
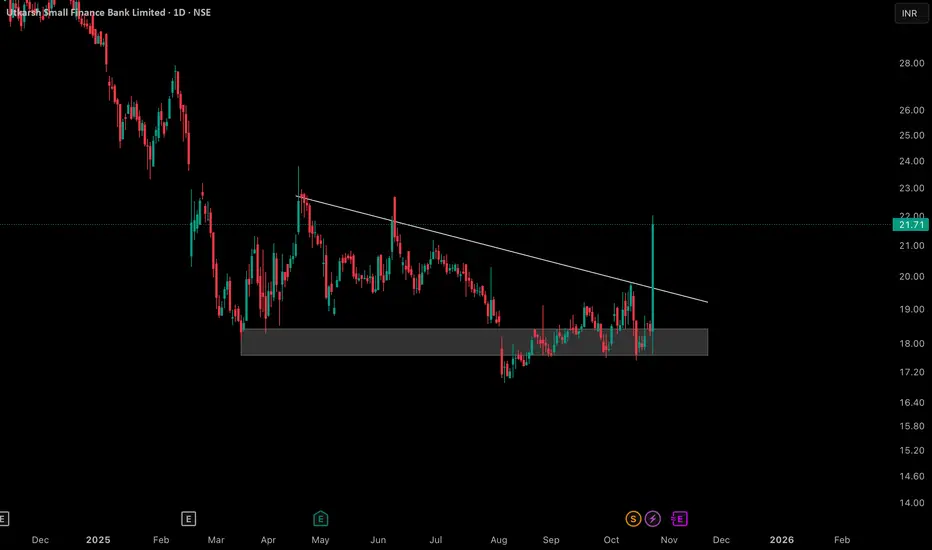
Descending Triangle fake breakdowns explainedThe daily chart for Utkarsh Small Finance Bank Limited displays a well-defined descending triangle, marked by a consistent supply trendline and an established horizontal support zone. During the recent price action, there was a temporary dip below the support, which was quickly retraced as price action returned within the range and formed a distinct lower wick rejection candle at the base.
This chart highlights the role of false moves and re-entries within important technical zones, as well as the reaction to a descending trendline. No trading advice or forecast is implied—this is for educational and analytical purposes, providing an example of how certain classical patterns and market behaviors may unfold within price structure.
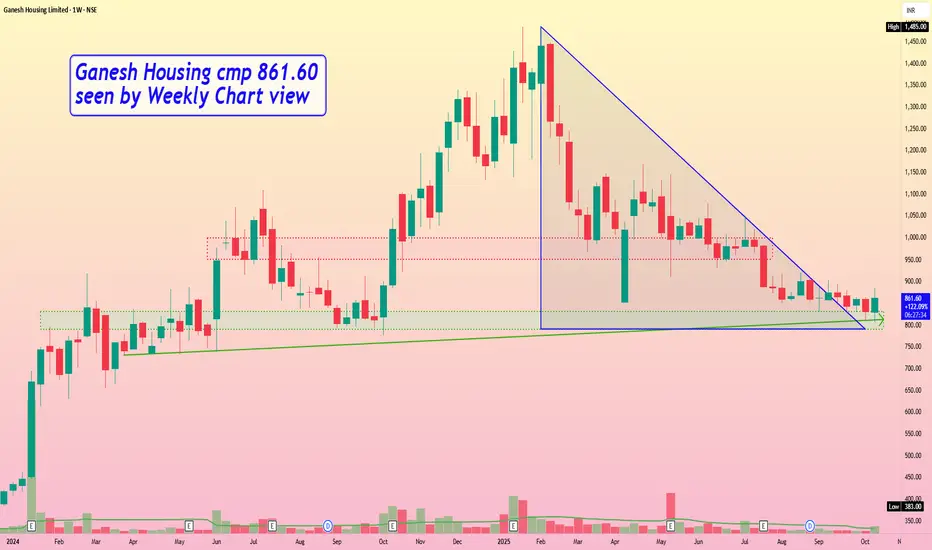
Ganesh Housing cmp 861.60 by Weekly Chart viewGanesh Housing cmp 861.60 by Weekly Chart view
- Support Zone 790 to 830 Price Band
- Resistance Zone 950 to 1000 Price Band
- Descending Triangle Breakout in the making process
- Support Zone seems tested retested over the past few weeks
- Volumes are flat, need to increase for fresh upside price movement
Don’t Miss This Rare MCX Setup Breakout + Retest= Big Move AheadHello Traders!
Today’s analysis is on MCX Ltd., where we just spotted a powerful Descending Triangle Breakout . After weeks of consolidation, the price has finally broken the falling resistance and even retested the breakout zone. This setup often leads to a strong trending move.
Why this setup is special?
Price respected support multiple times, showing heavy demand from lower levels.
Breakout + Retest makes it one of the most reliable continuation patterns.
Risk–Reward is highly favorable for both short-term and positional traders.
Levels to Track:
Currently, the best accumulation zone lies between 8000–8155 , which gives a low-risk entry point. On the upside, the immediate short-term target is around 8446 , while the medium-term level aligns with the previous ATH near 9115 . If momentum sustains, the stock even has potential to reach the positional target of 9774 . For risk management, traders can keep a short to medium-term stop loss at 7788 , while positional traders may consider a wider SL at 7522 .
Rahul’s Tip:
Such breakouts don’t come often. Once the retest is done, the real rally usually begins. Traders who wait too long often end up chasing the move at much higher prices.
If you want to catch these setups before they take off, make sure you follow closely — (Analysis By @TraderRahulPal, TradingView Moderator). More analysis & educational content is shared regularly on my profile. Sometimes one breakout can change your trading month completely. If this helped you, don’t forget to like and follow for regular updates.
Disclaimer:
This analysis is for educational purposes only and should not be taken as financial advice. Please do your own research or consult your financial advisor before investing.

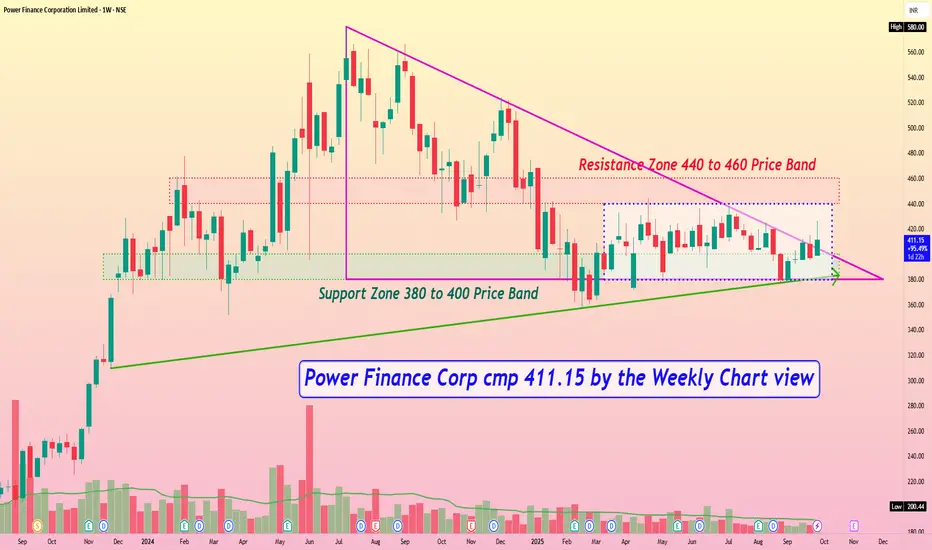
Power Finance Corp cmp 411.15 by the Weekly Chart viewPower Finance Corp cmp 411.15 by the Weekly Chart view
- Support Zone 380 to 400 Price Band
- Resistance Zone 440 to 460 Price Band
- Price traversing within Descending Triangle pattern after ATH
- Rising Support Trendline well respected by touch points since close to 2 years
- Price seen majorly trending inside Darvas Box since Mar 2025 in a range of 380 to 440
- Volumes in close sync with avg traded qty on Daily Chart and in steady stream by Weekly Chart
Monthly Descending Triangle & False BreakdownA descending triangle on the monthly chart shows lower highs converging toward a flat support, reflecting mounting seller pressure and key institutional interest at the horizontal base
The red counter trendline highlights corrective rallies within the broader down-sloping resistance.
The red demand zone marks where significant buying absorbed prior declines, offering a structural support area.
The white box illustrates a false breakdown below support—a liquidity-grab that shook out weak hands before a swift recovery—demonstrating how professional traders engineer stop-hunts to secure favorable entry levels.
This interplay of pattern, trendlines, demand zone, and false breakdown underscores how market structure and institutional tactics shape price action—key for informed, risk-defined decisions.
Disclaimer: For educational purposes only. Not investment advice. Risk management and independent research are vital.
Multi-Pattern Mastery: Descending Triangle Meets Broadening FormThis chart demonstrates the power of multi-pattern recognition in technical study,showcasing how a descending triangle (white lines) can coexist with a broadening formation pattern (red ascending line with shared lower base). The descending triangle shows consistent lower highs against a stable support level, while the broadening pattern reveals expanding volatility through higher highs and the same lower boundary.
Patterns to Study :
Descending Triangles: Characterized by horizontal support and declining resistance, typically indicating bearish pressure building
Broadening Formations: Feature diverging trendlines creating a "megaphone" effect, signaling increased market volatility and indecision
Pattern Confluence: When multiple patterns share common elements (like the lower support base here), it creates stronger technical significance and potential reference points
Disclaimer: This content is for educational purposes only and does not constitute investment advice. Always conduct your own research before making any trading decisions.
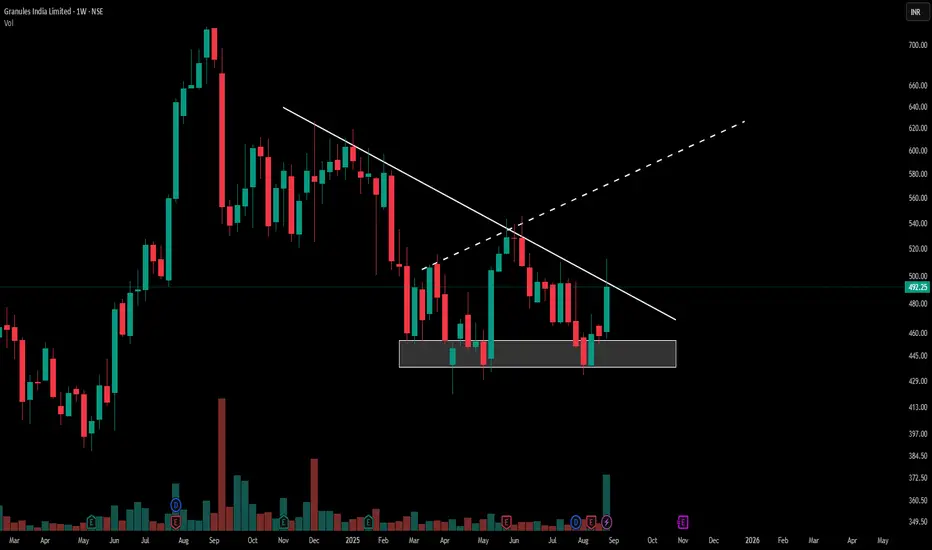
Granules India: Critical Descending TriangleGranules India Limited presents a descending triangle pattern on the weekly chart. The price has moved from the established support zone near ₹440-450 and is currently challenging the resistance trendline around ₹492.25. This movement appears with a marked increase in trading volume, highlighting the level where buyers and sellers are most active.
Pattern Character
A descending triangle pattern is identified by a series of lower highs against a stable support base. Granules India’s recent action displays persistence at support and upward momentum toward resistance. The volume expansion indicates notable participation during the current move.
Chart Observation
Price action above the triangle’s resistance can indicate a change in the prevailing sentiment if confirmed by continued volume. The current structure and market activity are being closely watched by participants for further development. No forecast or recommendation is made within this post.
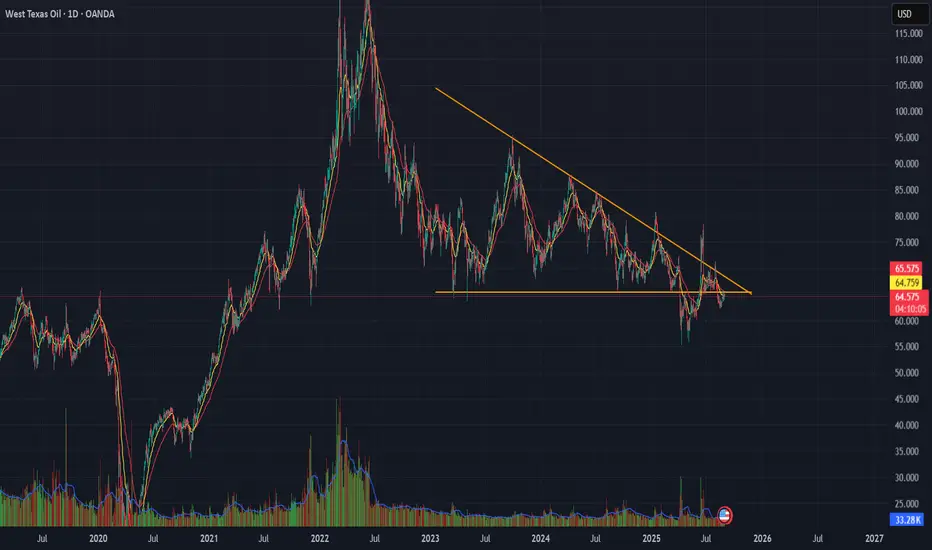
WTI Crude Oil Descending Triangle Pattern
WTI is forming a Descending Triangle pattern near recent support.
📊 Technicals : Flat base with lower highs compressing price action.
🔎 Key Levels: Breakdown below support 65 Leads To bearish continuation;
bounce above resistance 71 Leads To reversal setup.
⚠ Risk View: Energy fundamentals remain mixed — confirmation with volume is essential.
👉 Tactical takeaway: Wait for a breakout from the triangle before committing directionally.
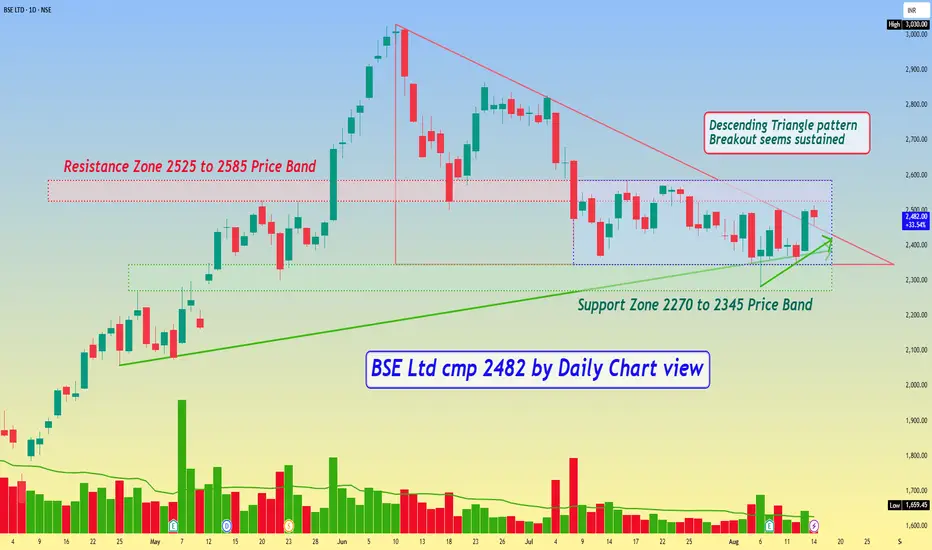
BSE Ltd cmp 2482 by Daily Chart viewBSE Ltd cmp 2482 by Daily Chart view
- Support Zone 2270 to 2345 Price Band
- Resistance Zone 2525 to 2585 Price Band
- Descending Triangle pattern Breakout seems sustained
- Stock seems trading within price range indicating Darvas Box setup
- Volumes seen gradually syncing closely with the average traded quantity
- Most known Technical Indicators BB, EMA, MACD, RSI, SAR seem trending positively
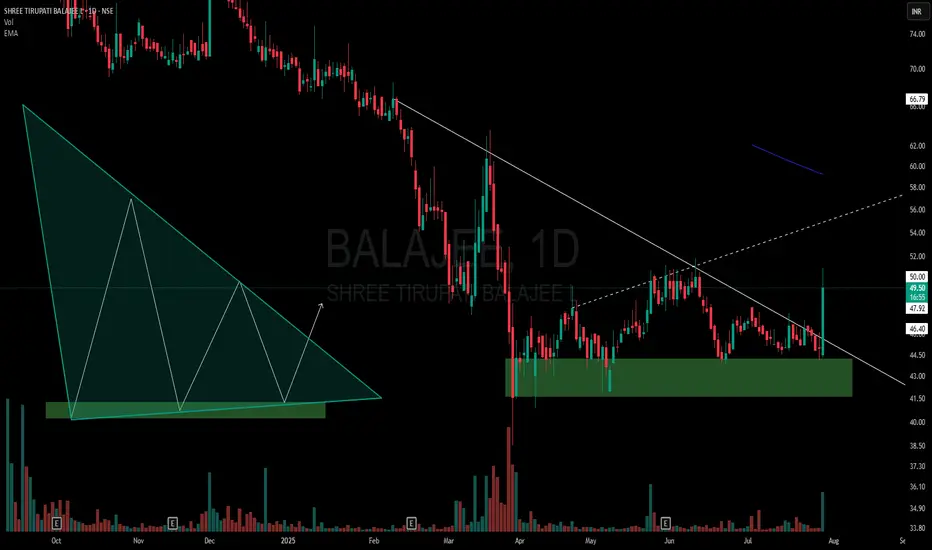
BALAJEE - Descending Triangle Meets Multi-Pattern ConfluenceOn the daily chart of Balajee, price action has formed a descending triangle right at the lower end of the trend:
🔻 Lower highs consistently pressuring horizontal support.
🟩 Price sitting within a clear demand zone, adding significance to the structure.
📊 Volume tapering off through consolidation, a classic triangle trait.
📐 Presence of a hidden counter-trend line (dotted) hinting at a potential broadening formation — showing a rare multi-pattern overlap.
Such setups are important not for predicting price, but for understanding how multiple structures can interact.
⚠️ Purely educational observation — no buy/sell advice.
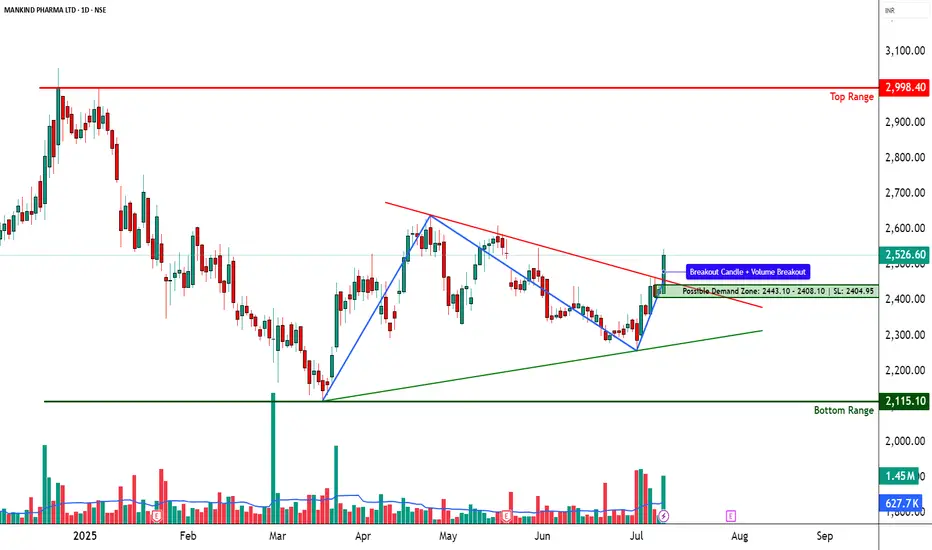
MANKIND PHARMA – Descending Triangle Breakout________________________________________________________________________________📈 MANKIND PHARMA – Falling Trendline Breakout | Strong Reversal Candle | Volume Spike
🕒 Chart Type: Daily Chart
📆 Date: July 9, 2025
________________________________________________________________________________
📌 Price Action:
MANKIND PHARMA has executed a decisive breakout above a falling trendline on the daily chart, breaking out of a multi-week descending structure. The price action had been consolidating within a triangular pattern, and on July 9, it registered a powerful wide-range bullish candle, closing at 2526.60 — well above the recent consolidation highs. This move came from a structured base with two strong pivot lows and now places the stock back into a strong bullish trajectory. The breakout is not random; it’s backed by structure, momentum, and confirmation — suggesting potential for a trend continuation if sustained.
________________________________________________________________________________
📊 Chart Pattern:
The chart shows a descending triangle breakout with compression near the apex. This setup builds pressure and usually resolves in the direction of volume. The move out of this pattern has occurred with authority, marked by a clean range expansion and bullish follow-through above resistance. This is a momentum-confirming breakout, which opens up room toward testing higher resistance zones.
________________________________________________________________________________
🕯️ Candlestick Pattern:
Strong Bullish Candle
Open = Low (Intraday strength)
Buy Today, Sell Tomorrow-type price action
Aligned with Volume Spike and Trendline Breakout
________________________________________________________________________________
🔊 Volume Analysis:
The breakout is accompanied by more than 2x the 20-day average volume, signaling real participation — not just speculative noise. Delivery volumes are notably strong, and volume came after a phase of tight consolidation, which indicates a possible transition from quiet accumulation to active participation by stronger hands.
________________________________________________________________________________
📈 Technical Indicators:
RSI (Daily): 66 – strong, trending up
MACD: Bullish crossover, both on Daily and Weekly
CCI: 220 – highly bullish momentum territory
Stochastic: 94 – overbought but confirming momentum
SuperTrend & VWAP: Clearly bullish
Bollinger Band: Price is expanding beyond upper band — volatility expansion in motion
________________________________________________________________________________
🧱 Support & Resistance:
🔻 Supports:
2448.27 – Immediate support (previous breakout zone)
2369.93 – Structure base support
2322.27 – Last defense before breakout invalidation
Bottom Range / Demand Zone: 2115.1 – Long-term accumulation zone
🔺 Resistance Zones:
2574.27 – First supply zone; watch for price reaction
2621.93 – Medium-term resistance; previously rejected here
2700.27 – Higher timeframe swing resistance
Top Range: 2998.4 – Long-term resistance; breakout confirmation if crossed
________________________________________________________________________________
👀 What’s Catching Our Eye:
What stands out is the confluence breakout — trendline, structure, volume, and indicators are all pointing in the same direction. The BB squeeze, RSI breakout, and strong candle together make this a multi-signal setup — rarely do we get such alignment across tools.
________________________________________________________________________________
🔍 What We’re Watching For:
Will the price hold above 2448–2526 for the next couple of sessions? If yes, this breakout can see momentum continuation toward 2574+. Any low-volume pullback toward the trendline or support zone could be a low-risk re-entry. If it fails to hold above the breakout candle, momentum could fade.
________________________________________________________________________________
✅ Best Buy Level for Equity (Low Risk Idea):
Entry: Above 2543.60 (post-breakout confirmation or clean retest of 2448–2455 zone)
Stop Loss: 2404.95 (on a closing basis)
Risk Reward Strategy: 1:1 initially, trail for 1:2+ if volume expands
Avoid chasing: Let the price validate with sustained volume above breakout
________________________________________________________________________________
💼 Sector Tailwinds:
The pharmaceutical sector is seeing renewed investor interest post-COVID, with growing focus on specialty products, chronic therapy lines, and export-led growth. MANKIND is among the strongest consumer-pharma brands with consistent results and brand recall — adding fundamental strength to this technical breakout.
________________________________________________________________________________
⚠️ Risk to Watch:
A close below 2448 could invalidate this setup
The overbought Stochastic means minor pullbacks or shakeouts are possible
Don’t chase — always confirm the breakout with a retest or follow-through candle
Over-positioning during volatility can lead to poor R:R trades
________________________________________________________________________________
🔮 What to Expect Next:
If this breakout holds, we may see follow-through toward 2574.27 in the short term. Strong volume above 2540+ can unlock upside toward 2621+. However, if the price closes below 2448, we may be dealing with a failed breakout — a scenario to strictly avoid. Watch next 2–3 sessions for clarity.
________________________________________________________________________________
🧠 How to Trade MANKIND PHARMA (For Educational Use Only):
🔹 Breakout Trade Plan
Entry: Above 2543.60
Stop Loss: 2404.95 (Closing basis)
Pullback Entry: Into 2448 zone with bounce candle
Risk-Reward: Start with 1:1, then trail to 1:2+
Position Sizing: Risk-calibrated, never go all-in
________________________________________________________________________________
⚠️ Disclaimer (Please Read):
• This chart is shared for educational purposes only and is not investment advice.
• I am not a SEBI-registered advisor.
• The information provided here is based on personal market observation.
• No buy/sell recommendations are being made.
• Please do your own research or consult a registered financial advisor before making any trading decisions.
• Trading involves risk. Always use proper risk management.
________________________________________________________________________________
💬 Found this helpful?
What’s your ideal approach to this setup — breakout entry or pullback into zone?
Drop your thoughts or questions in the comments below ⬇️
🔁 Share this post with your trading community
✅ Follow STWP for clean technical setups backed by price action and volume
🚀 Let’s trade with patience, logic, and clarity!
Be Self-Reliant | Trade with Patience | Learn with Logic
________________________________________________________________________________
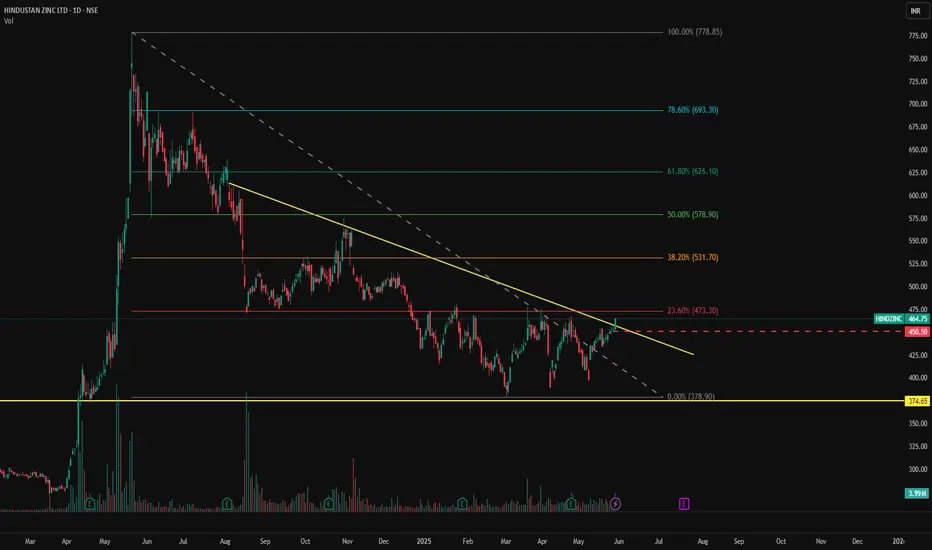
HINDZINC - NSE | Daily Chart Analysis📊 HINDUSTAN ZINC LTD (HINDZINC) – NSE | Daily Chart Analysis
📅 Date: May 30, 2025
📈 CMP: ₹464.75 (+2.68%)
📌 Ticker: NSE:HINDZINC
🧠 Technical Breakdown
🟢 Descending Trendline Breakout 🟢
The stock is showing early signs of strength as it approaches the apex of a long-term descending trendline. Price action is attempting a trendline breakout from a nearly year-long downtrend, suggesting the possibility of a bullish reversal.
🔍 Volume Confirmation
Steady volume buildup over the past few sessions, potentially indicating accumulation ahead of a confirmed breakout.
📉 Well-Defined Support
₹374.65 has acted as a strong demand zone on multiple occasions, offering a solid base for the current move.
📍 Key Price Levels
🔺 Resistance (Trendline Breakout Zone): ₹465
🔻 Major Support: ₹374.65
🎯 Upside Targets (on breakout):
₹500
₹535
₹575+
🛡️ Stop Loss: Below ₹440 (on breakout failure)
📌 Trading Strategy
Aggressive Entry: On breakout + closing above ₹465 with volume surge
Conservative Entry: Retest of trendline post-breakout
SL: ₹440
Target Zone: ₹500–₹575
⚠️ Disclaimer
This post is for educational purposes only and does not constitute financial advice. Always conduct your own analysis or consult a financial advisor before investing.
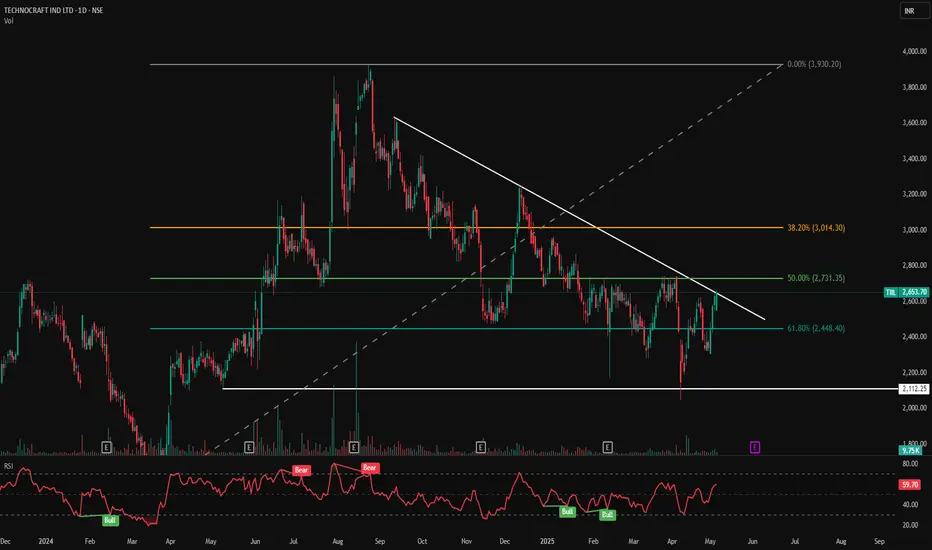
TILL - Descending Trendline Breakout Watch📊 TIIL – Descending Trendline Breakout Watch | Key Fib Retest in Play
🕰️ Timeframe: 1D | 🧭 Pattern: Descending Triangle | 🎯 Fibonacci Reversal Setup
📈 Technical Analysis Summary:
TIIL is currently approaching a major trendline resistance, drawn from its all-time high. After a long downtrend, the stock is now testing the 50% Fibonacci retracement level at ₹2,731.35 with rising momentum.
The price is hovering near a breakout zone and consolidating just below resistance, hinting at potential bullish continuation. A successful breakout can open gates to much higher levels, especially toward the 38.2% Fib zone and beyond.
🔍 Chart Highlights:
⚪ Descending Trendline: Key multi-month resistance line
🟢 Current Price Action: Holding above 61.8% Fib (₹2,448.40) and pushing toward 50% zone (₹2,731.35)
🔵 Base Support: ₹2,112.25 (previous structure low)
📈 Volume: Gradual build-up near resistance zone
🔴 RSI (14): Currently at 59.70 – neutral-to-bullish, showing higher lows
📍 Bullish RSI Icons: Highlighted near recent bottoms, indicating accumulation zones
📌 Support & Resistance Levels:
Type Level (₹)
🔼 Resistance 1 2,731.35 (Fib 50%)
🔼 Resistance 2 3,014.30 (Fib 38.2%)
🔻 Support 1 2,448.40 (Fib 61.8%)
🔻 Support 2 2,112.25 (Major horizontal support)
🧭 Trading Setup Overview:
✅ Bias: Bullish if price breaks and closes above trendline and ₹2,731
💡 Entry Watch: Break and hold above ₹2,731.35 with volume
🛑 Invalidation: Close below ₹2,448.40 (61.8% Fib)
🎯 Upside Targets: ₹3,014 → ₹3,500+ (based on structure)
💬 Conclusion:
TIIL is at a critical juncture with a high-probability trendline breakout setup in play. The Fibonacci confluence, improving RSI, and rising volume indicate a bullish bias. Watch for a strong breakout candle above ₹2,731 for potential positional opportunities.
⚠️ Disclaimer: This chart is shared for educational purposes. Kindly consult your financial advisor before making any trading decisions.
🔔 Follow @PriceAction_Pulse for more high-probability swing setups and technical chart breakdowns!
📌 Save & share if TIIL is on your breakout watchlist!