Dhani Services Ltd – Monthly Chart Analysis 📉 Dhani Services Ltd – Monthly Chart Analysis
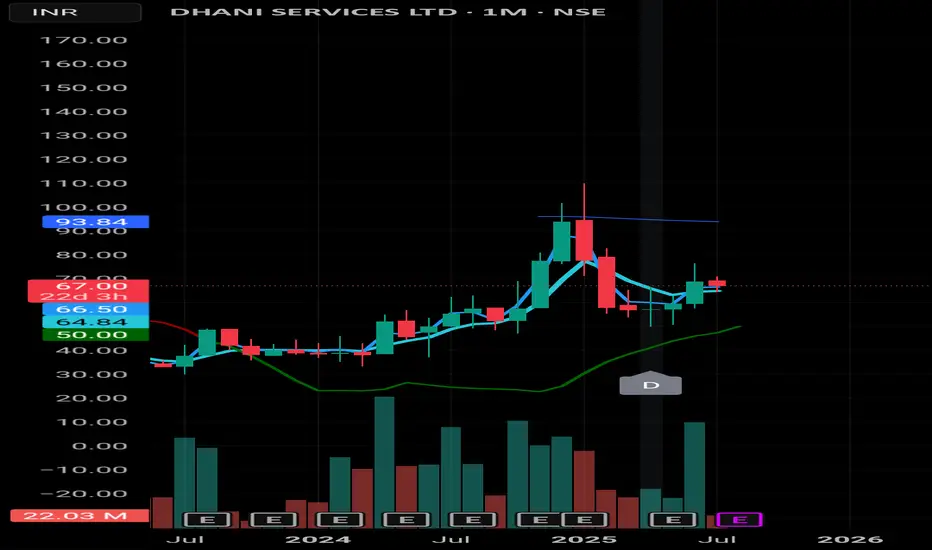
• Price: ₹67.17
• Setup: Attempting recovery after sharp fall from ₹100+ zone
• Facing resistance around 66.50–67.50 (20 EMA & previous support turned resistance)
• 93.84 – Long-term resistance (possibly 200 EMA)
• Support levels:
– ₹64.86 (short-term)
– ₹50.02 (major swing base & green trend line zone)
📊 Volume: Spiked again recently—watch for follow-through
🕯️ Candle shows buyers attempting to push, but supply overhead is strong
🎯 Game Plan:
– Above ₹68: possible upside towards ₹78–80
– Below ₹64: weakness may pull back to ₹56–50
🔁 Wait for strength to confirm. Don’t jump early on weak reversals.
#DhaniServices #StockMarketIndia #MonthlyChart #SwingTrading #PriceAction #NSEStocks #TechnicalAnalysis
DHANI
DHANI |Rectangle Consolidation Breakout | Daily
---
### 📈 **Breakout Overview:**
✅ **Rectangle Consolidation Breakout**
* **Consolidation Range:** ₹49.85 to ₹66.41
* **Breakout above:** ₹66.41
* **Current price:** ₹71.09 (+14.42% move today!)
* **Target projection:** ₹82.89–85 zone (based on rectangle height projection).
---
### 📊 **Key Chart Signals:**
* **Volume Surge:** Big spike in volume confirms breakout strength.
* **RSI:** RSI above 70 (around 80) signals strong momentum.
* **Rectangle height move:** Rectangle height (\~₹16.48) added to breakout level projects target around ₹82.89–85.
---
### 🔍 **What’s Next?**
* If the breakout sustains above ₹66.41, momentum likely to push price towards ₹82.89–85.
* Monitor for potential retest of the breakout zone (₹66–67) which would act as support.
* RSI being overbought (\~80) suggests possible minor pullback or consolidation before moving higher.
---
### 💡 **Key Takeaway:**
DHANI has **successfully broken out** of a long consolidation zone, with **volume and momentum** supporting further upside towards **₹82.89–85**.
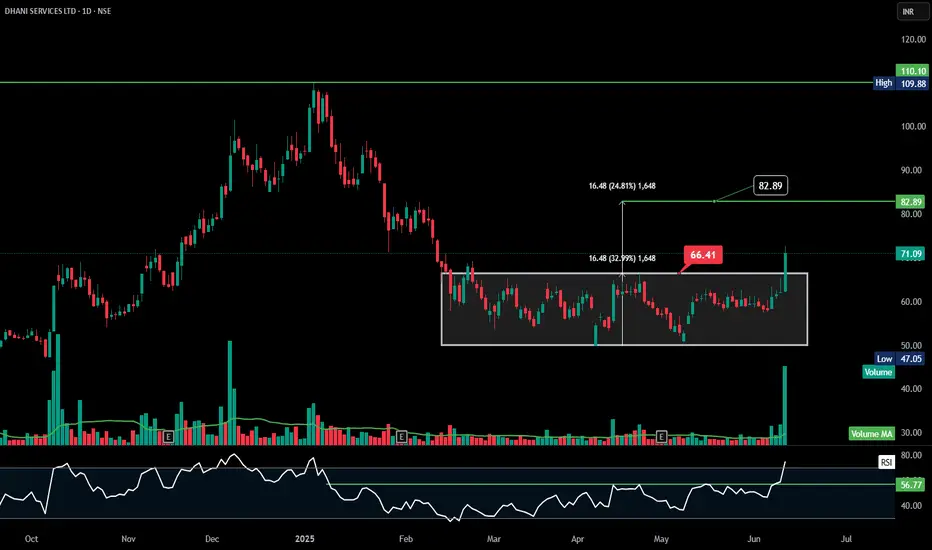
Dhani BO: Ready for Its Next Rally After 80% Correction?NSE:DHANI Breakout: Is This Med/Fin Tech Stock Ready for Its Next Rally After 80% Correction?
Price Action Overview:
- Stock has undergone a significant correction from highs of ₹109.88 to lows of ₹47.05, representing nearly a 57% decline
- Currently trading at ₹71.09 with recent bullish momentum showing +14.42% gains
- Price action suggests a potential bottoming process after prolonged consolidation
Volume Spread Analysis:
- Significant volume spikes observed during major price movements
- Recent breakout accompanied by above-average volume (4.22M vs average 30.03M)
- Volume concentration during earnings announcements (marked 'E' on the chart) indicates institutional participation
- Higher volume during recent uptick suggests renewed interest
Key Technical Levels:
Support Levels:
- Primary Support: ₹50-52 zone (previous consolidation area)
- Secondary Support: ₹47.05 (absolute low)
- Immediate Support: ₹62-65 (recent breakout zone)
Resistance Levels:
- Immediate Resistance: ₹82.71 (marked horizontal level)
- Major Resistance: ₹96.79-₹109.88 (previous highs zone)
- Intermediate Resistance: ₹75-78 (previous resistance turned support)
Base Formation:
- Extended consolidation base formed between ₹50-₹68 over 4-5 months
- Classic rectangle/range-bound pattern with multiple tests of support and resistance
- Recent breakout from the upper boundary of this base suggests the completion of the accumulation phase.
Technical Patterns:
- Descending triangle pattern from February to April 2025
- Internal Flag & Pole Breakout
- Recent breakout from the consolidation rectangle
- Potential inverse head and shoulders formation on smaller timeframes
- Rising volume during breakout confirms pattern validity
Trade Setup:
Entry Strategy:
- Primary Entry: ₹68-₹70 (on pullback to breakout level)
- Aggressive Entry: Current levels ₹71-₹72 (momentum play)
- Conservative Entry: ₹65-₹67 (retest of breakout zone)
Exit Levels:
- Target 1: ₹82-₹85 (immediate resistance zone) - Risk: Reward 1:2
- Target 2: ₹95-₹98 (major resistance area) - Risk: Reward 1:3.5
- Target 3: ₹110-₹115 (previous highs extension) - Risk: Reward 1:4.5
Stop Loss:
- Conservative Stop: ₹62 (below recent consolidation)
- Aggressive Stop: ₹58 (below key support cluster)
- Trailing Stop: Implement an 8-10% trailing stop after the first target achievement
Position Sizing:
- Risk per trade: Maximum 2% of portfolio
- Position size calculation: Portfolio value × 2% ÷ (Entry price - Stop loss)
- For ₹1,00,000 portfolio with ₹70 entry and ₹62 stop: Position size = ₹2,000 ÷ ₹8 = 250 shares
Risk Management:
- Maximum exposure to single stock: 5% of total portfolio
- Sector exposure limit: 15% to financial services
- Use of stop-loss orders mandatory
- Position review after every 10% move in either direction
- Risk-reward ratio minimum 1:2 for all trades
Sectoral Backdrop:
Fintech Sector Overview:
- Digital lending sector experiencing regulatory scrutiny, but long-term growth prospects intact
- Increasing digital adoption post-pandemic, supporting fintech growth
- RBI guidelines on digital lending create compliance costs but also barriers to entry
- Consolidation is expected in the sector, favouring established players
Industry Trends:
- Growing smartphone penetration is driving digital financial services adoption
- The government push for financial inclusion through digital means
- Rising interest rates are impacting borrowing costs but improving net interest margins
- Increasing focus on data analytics and AI-driven lending decisions
Fundamental Backdrop:
Company Overview:
- Dhani Services operates in the digital financial services space
- Diversified business model including lending, insurance, and investment services
- Strong technology platform enabling scalable operations
- Focus on serving underbanked population segments
Recent Developments:
- Quarterly earnings showing revenue growth trajectory
- Management focuses on improving asset quality and reducing NPAs
- Strategic partnerships for expanding product offerings
- Regulatory compliance improvements undertaken
Financial Health Indicators:
- Need to monitor debt-to-equity ratios given the lending business nature
- Asset quality metrics are crucial for long-term sustainability
- Revenue diversification, reducing dependence on single income streams
- Technology investments supporting operational efficiency
Catalyst Factors:
- Potential regulatory clarity on digital lending norms
- Expansion of credit underwriting capabilities
- Strategic alliances or acquisition opportunities
- Improved economic conditions support loan demand
Risk Factors:
- Regulatory changes in the fintech space
- Competition from established banks entering the digital space
- Credit risk in unsecured lending segments
- Technology and cybersecurity risks
- Dependence on external funding for growth capital
My Take:
This technical setup suggests a potential medium-term opportunity with proper risk management, though investors should monitor both technical levels and fundamental developments closely.
Keep in the Watchlist.
NO RECO. For Buy/Sell.
📌Thank you for exploring my idea! I hope you found it valuable.
🙏FOLLOW for more
👍BOOST if you found it useful.
✍️COMMENT below with your views.
Meanwhile, check out my other stock ideas on the right side until this trade is activated. I would love your feedback.
Disclaimer: "I am not a SEBI REGISTERED RESEARCH ANALYST AND INVESTMENT ADVISER."
This analysis is intended solely for informational and educational purposes and should not be interpreted as financial advice. It is advisable to consult a qualified financial advisor or conduct thorough research before making investment decisions.

DHANI : Short Term (1-3 Months) #DHANI #breakout #swingtrade #momentumtrade
DHANI : Weekly Chart
>> Moving Avg Setup
>> Trending Setup
>> Momentum Stock
>> Good Strength & Volumes
>> Good Upside Potential
Swing Traders can lock 10% profit & keep trailing
Best of Setup's can Fail in Current Market Scenario, so Trade Good Setups with Proper Risk Management, position Sizing & logical Stop-loss Rules
Please give a Boost or comment if u r Liking the analysis & Learning from it. Keep showing ur Love by following
Disclaimer : This is not a Trade Recommendations & Charts/ stocks Mentioned are for Learning/Educational Purpose. Do your Own Analysis before Taking positions.

Dhani : Breakout Candidate#Dhani #Breakout #Trianglepattern #patterntrading #patternbreakout #momentumtrade
Dhani : Weekly (1-3 Months)
>> Momentum Trade
>> Breakout Soon
>> Triangle Pattern
>> Good Strength & Volume Build up
>> Low Risk High Reward Trade
I believe it can move towards 100 Ema (60 Levels)
Swing Traders Can lock thier profits at 10% and keep trailing
Disclaimer : Charts Shared are for Learning Purpose & not a Trade Recommendation. Consult your Financial Advisor before taking position in it.


dhani services ltd on daily chart for educational purposethe chart is self explainatory and is for educational purpose only.

DHANI - Took support twiceCMP @ 167
Took support twice at the support trend line. Trend lines can be the SL & Target.
Note: For educational purpose only. Do self analysis before you buy.

Will Dhani breakout ???Dhani is at an important stage of breakout :
Reasons/Traits :
• Gave a huge breakout but with a huge wick
• Volumes are very high
• Todays close is near to recent lower high
• Price above 13/20 and touched 200 EMA
• Price near VWAP
• High deliveries
What can happen next :
Scenario 1 : Price sustaining above 215 levels can take it to 240/260/280/300 levels
Scenario 2 : Price break down below 195 can take it down to 180/165/155 levels
Disclaimer : This analysis is only for educational purpose and not be considered as any trading idea/tip. Please consult your financial advisor before you take any trade and we are no way responsible for your profits/losses. Thank you!
Please do like and share this idea. Thanks

DHANI levels...11.10.2021 ( D candle)DHANI... now break the trendline in up side, immediate target 225+...once again its down below 190 then we have great opportunity to accumulate upto 160 for long term


Long Dhani ServicesDhani Services
Cmp - 177
Stop - 150 on DCB
Expectation -
T1 - 390
T2 - Open, Review at 390
Expected Holding Period - 180 trading days or earlier for T1
View:- Positional
Disclaimer:-
Ideas being shared only for educational purpose
Please do your own research or consult your financial advisor before investing

DHANI SWING TRADE LONG 1D TFDHANI is currently trading in channel and recently made a higher low, so we will try to trade for the higher high by initiating a long trade above @ 184 with StopLoss @ 155.

Short to Medium Term : Dhani ServicesPrice is near Support, Buy Zone 222_215 , Exit if Daily Candle closes below current Weekly Candle Low, Target 268 and New 52 Week High


1 Month Strong BuyStock Continue create a "Red Candle Bar" last 11 session. Buy deep and sell high.
Buy @ 288 Trgt @ 322, 330, 345
