Short NCC as per Stochastic Divergence signal!NSE:NCC should continue with bearish phase next week. Bearish Stochastic divergence along with MACD bearish crossover are strong signals to take a short position on Monday. Sell at opening price (may open on higher side) or wait for price of 124-126 for better sale price entry. Target is of 116.5(T1) and 101.5(T2).
Divergence

HDFC may fallA bearish stochastic divergence noticed in NSE:HDFC along with bearish crossover. This indicates a temporary bearish phase. Short at opening price (above 1800) for a target of 1780(t1), 1768(t2), 1755(t3). A stop loss of 1822 is recommended.

DRREDDY FallingIn a very similar to Nifty (I shared an idea on it just 4 hours back), there's an observation of Stochastic Triple Divergence in NSE:DRREDDY indicating a bear trend. A short position is recommended with a target of 2004(t1) & 1904(t2). A stoploss of 2100 is highly recommended. Selling range should be (2040-2070).

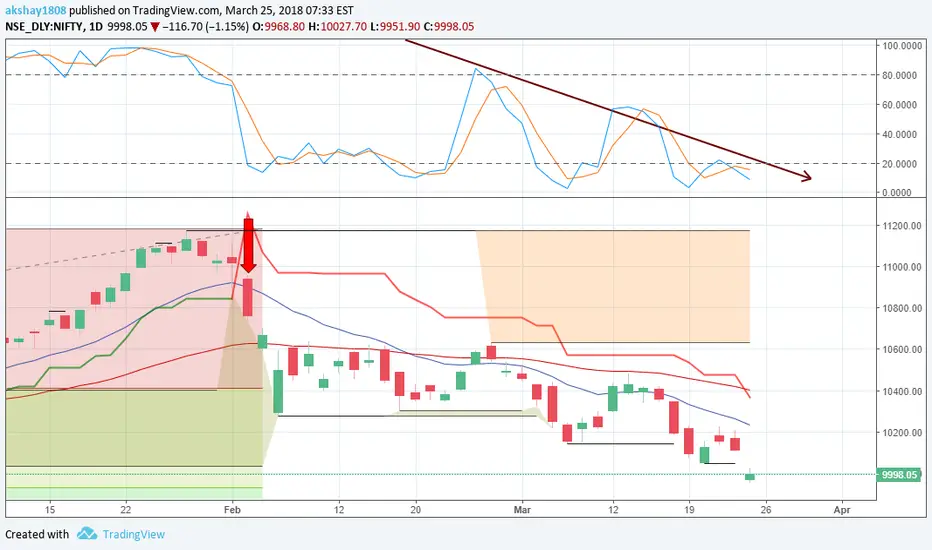
One last fall in NiftyIts a cliche but falling in NSE:NIFTY is inevitable. Bearish divergence in Nifty is clearly seen that indicates a short term but a very steep fall in next week. Year end closing will be bad hurting Returns on Investment of lot of mutual funds.
Short in opening trade on monday above 9980 (or upto 9965) with a target of 9933 (t1), 9686 (t2), 9548 (t3).
A stop loss of 10100 is recommended.
Double Bottome Reversal ConfirmationThe pattern has formed the pattern and trading above the confirmation line. Interestingly PSU_Banking stocks are doing well recently. RSI has also shown divergence in oversold zone and is above 50 now so one can conclude that downtrend has arrested now at least for time being. One can take advantage of the setup for trading/investing.
Disclaimer : All stock recommendations and comments are my personnel view. please take financial consultancy for trading decision.

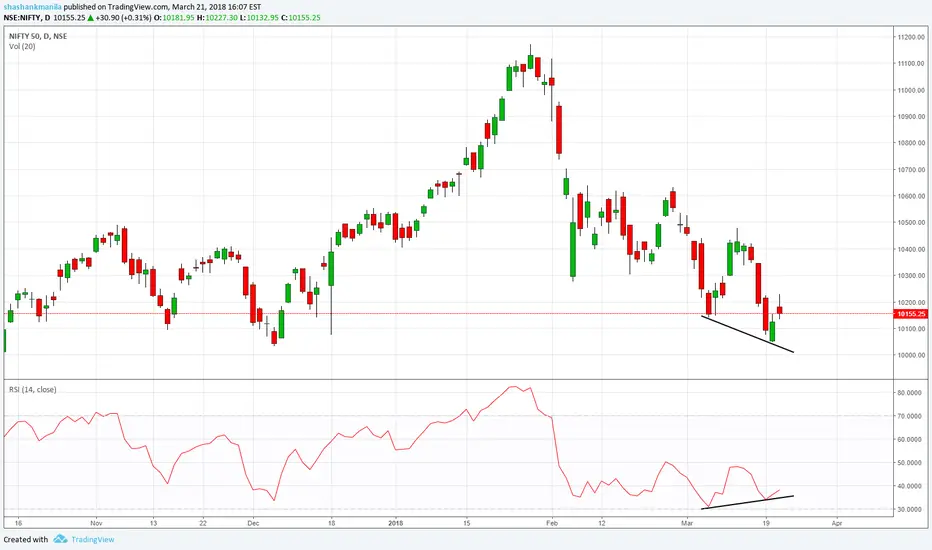
NIFTY Showing DivergenceOn Daily Chart, Nifty 50 showing divergence with RSI. Will we see another rally from here?
HCLTECH RisingIt seems NSE:HCLTECH is in verge of breakout. Two reliable indicators giving a buy signal.
1. MACD (15,50,9) bullish crossover signalling to enter in long position.
2. Stochastic Divergence on bullish side which again gives a signal of immediate breakout.
Buy above 969 aiming for a target of 987(T1), 1010(T2) & 1040(T3). A stop loss of 953 is recommended.

Watch price movement - wedge formation, stochastic divergenceAs seen in chart, a wedge is formed and stochastic is rising but price is falling - classic bullish divergence

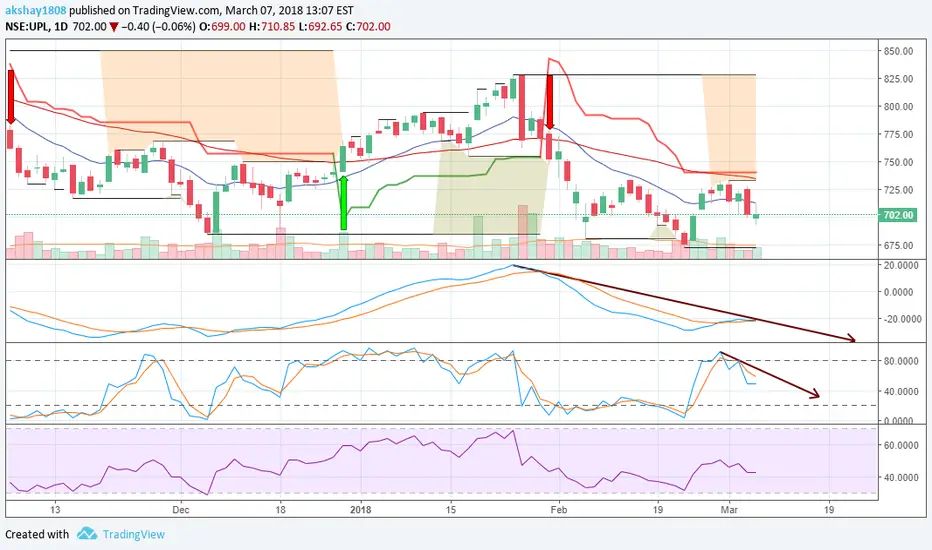
Short UPL as per MACD & Stochastic signalsNSE:UPL is one of those stocks where it seems bearish phase is yet not stopped. Fresh signal are given by MACD crossover as well Stochastic crossovers. Interestingly both are also giving bearish divergences (observe down arrow) which confirms our short selling call. Short Sell in range of 700-705. Targets will be 693(T1), 680(T2), 672(T3). A stop loss of 709 is highly recommended.
Bearish divergence and break down below KijunSen Bearish divergence and break down below KijunSen is giving early sign of weakness.

Triple Bearish Divergence in SunPharmaAs seen in above charts triple stochastic divergence is seen in NSE:SUNPHARMA giving a confidence of clear bearish phase.
Short NSE:SUNPHARMA at 530 with a target of 511(T1), 498(T2) & 466(T3). Stop loss of 542 is recommended.

Buy Supreme IndSupreme Ind takes support at 200 SMA and old trendline + Shows Bullish divergence BUY at 1192 for target of 1265 SL 1155


MACD Divergence - Ashok LeylandThere may be a chance of short term bearish trend on Ashok Leyland. This is just for learning. Experts please clarify whether analysis is correct

APOLLOHOSP: Defensive BetAll mentioned & plotted on Chart.
My personal View. If matched, Like & Share
As i am not SEBI regd. analyst, take this study as educational purpose.
For taking trade decision Consult with financial Advisor

Bullish Divergence ....Short term BUY at CMP for target of 108Bullish Divergence ....Short term BUY at CMP for target of 108 SL 92

Bullish Divergence ....Short term BUY at CMP for target of 140Bullish Divergence ....Short term BUY at CMP for target of 140

SHORT : Divergence & multiple resistanceClearly divergence in MACD and RSI are telling the forthcoming weakness that too at the level of multiple resistance so one can take chance by shorting the stock. STOP LOSS Little above the recent high. Just to mention that divergence at the top are relatively tricky comparing to formed at bottom.

What is Divergence And How Does it Work ... For Learners ...Dear All , I am not A Professional in Share Markets But Sharing Knowledge always increases Knowledge of Everyone ... So , I am just Sharing About Possible Divergences of Share Price with RSI ...
Basically , There are two types of Divergences :-
(1) Positive/Bullish Divergence :-
It is known By Joining Bottoms in A Chart And Comparing it with RSI or Any Indicator ... There are Two Possibilities in this Divergence :-
: The Trend is Going Upwards & RSI is Slopping Downwards .
: The Trend is in Downward Direction & RSI Slops Upwards .
(2) Negative/Bearish Divergence :-
It can be derived by Connecting the Tops in A Chart And Comparing it with RSI or Any Indicator . Similarly , It is Identified if :-
: The Trend is Up And RSI Slops Down .
: The Trend is Down While RSI Shows Upwards Movement .
So That was From My Kitty ... You Can Apply Divergence Theory With Any Indicator ... It is Simply Awesome Tool for A Trader ... You All Should Keep it in Your Kitty ... Good Luck !!!


