intradayboth side potential
avoid first 15min breakout
wait for 15 min candle closing
targets are marked
follow risk management
do your own analysis
do workout
do meditation
start reading book
DIVISLAB

Divi's lab Buy - 2350 around
Sl - 1950
Target - 3500/3700
Risky stop loss is big ,
After confirmation re_post with small sl

Nifty Pharma Near Make-or-Break Zone 11200-11400 Nifty Pharma Near Make-or-Break Zone 11200/11400
Nifty Pharma on Long Term Charts nearing make or break zone
Reversal from here will be good opportunity for long term traders / investors

Divis Labs at Multiyear Support possible 4600 targets.Divis Labs at Multiyear year support with oversold indicaters like RSI etc. A possible reversal from here can show 3800+ and 4600+ levels in coming time.

Divis Lab - Keep WatchThe chart clearly shows that the stock is retesting the channel breakdown level of 2875. Keep watching for the next move.
Only for learning and sharing purposes, not a bit of trading advice.
All the best.

divislab "head&shoulders" patterndivislab "head&shoulders" pattern downside potential with targets of 2800 and 2500

DIVISLAB Down to FILL GAP ???!!! Chart Patterns insist me to go with the opinion titled above!!!
REASONS:
1. Divislab has been travelling in a MAJOR Expanding Triangular pattern .
2. It's been travelling in a Descending Channel pattern(downswing inside the major pattern).
3. Soon the Stock may take support @ the major support.(Green line shown in chart).
4. There is also a GAP (occured in Aug 2020) ....which too can act as Support!!!(thus gap can be filled.)
SL- Day candle closing above 3770
Target - 2900
Let's wait and watch whether its going to take Support or Break it!!!!
Note - Just sharing my view ....not a tip nor advice!!!!

Breakdown in Divi's Laboratories Ltd...Chart is self explanatory. Levels of breakdown, possible down-moves (where stock may find support) and resistances (close above which, setup will be invalidated) are clearly defined.
Disclaimer: This is for demonstration and educational purpose only. This is not buying or selling recommendations. I am not SEBI registered. Please consult your financial advisor before taking any trade.

Short DivislabDivislab results are expected and every result is showing a drop in stock price. Divislab closing below 3265 will see further drop of the stock to 3020 range.

DIVISLAB looks bearsish from now A Divislab is look bearish from now
Stock is in consolidation from 09.Nov.2022
Its show a fake breakout from 3419 to3643
And then make a GRAVESTONE DOJI AT TOP
And again show a consolidation
from 12.jan its breakdown the M PATTERN
Now its show retrechment at 3400
stock is bearish till 1trg 3200
2trg 3026

Long DivislabAfter consolidation Divislab has given a Bull Momentum to kick a move to the upside
TWT_SUPER_POINT has been able to capture the reversal move

DIVIS Labratories - Break Divi's Laboratories Limited is an Indian multinational Pharmaceuticals company and producer of active pharmaceutical ingredients and intermediates headquartered in Hyderabad, Telangana, India. The company manufactures and custom synthesizes generic APIs, intermediates

Divis Lab - reversal Trade - Target 3750 & 4450Divis Lab - Reversal Trade - Target 3750 & 4450
Showing signs of reversal. 12 days of consolidation then break out
Weekly Doji at support bottom (Sept 2020 levels) followed by Marubuzu this week confirming reversal.
RSI showing strength on daily chart with upward momentum as well as MACD weekly cross over.
Good RR. With 5% as SL one can target 33%.
Also this recommendation/presentation and all future ones are & will be only for learning purpose.
Please consult your financial advisor before investing.
Thank you.

Divid lab breakout on hourlyDivis lab has given consolidation breakout on hourly chart and has bounsed from monthly

Divis LabHead and shoulder pattern in Divis Lab suggest more deeper levels.
Start adding for long term near 3200/3000 50% amount anda rest 50% near 2800 level if comes.


Divis Lab possibility of going bearish for short term.As you can see Divis Lab is on the way to downside, in minor Wave E forming a Triangle pattern.
As per EWT minutte wave (c) can travel till fibo ratio 1 or 1.2 which are also my target.
But a trader must be cautious if it breaks the invalid level of 3710, if this level breaks above all study/ Analysis will be invalid.

Divis laboratories Could be selled for a few daysNSE: DIVISLAB
Hello guys today after seeing the chart I got these things
1. If goes down then the target could be taken at 3449 This could be taken as a maximum downside target in my opinion at the early stages now
2. Time Frame:- 1 Day
Conclusion:-
A trendline has been broken at the current levels and thus it could work as resistance, I have seen some forecasts show that it could be down and could be followed by the market also I got that to follow us and like the posts and Comment Below If You want to ask me questions on this on any other idea
Have a Nice Day to you all
Made By MAYANKTECHRESEARCHING
We are not responsible for any profit or loss
Based on Your Own Risk this is only to show you what's going on


DIVISLAB - 22nd July 2022Stock in trading range between 3800 - 3700
Wait for range breakout to take trade in that direction

Divislabs Divis Labs looks to Breakout tomorrow in an hourly Time Frame.
Will be upto 3850 to Achieve as Target 1.
If Stays rally Further Moves for 4000 only if withstand above 3920.
Stay tuned and Trade on your own Risk.

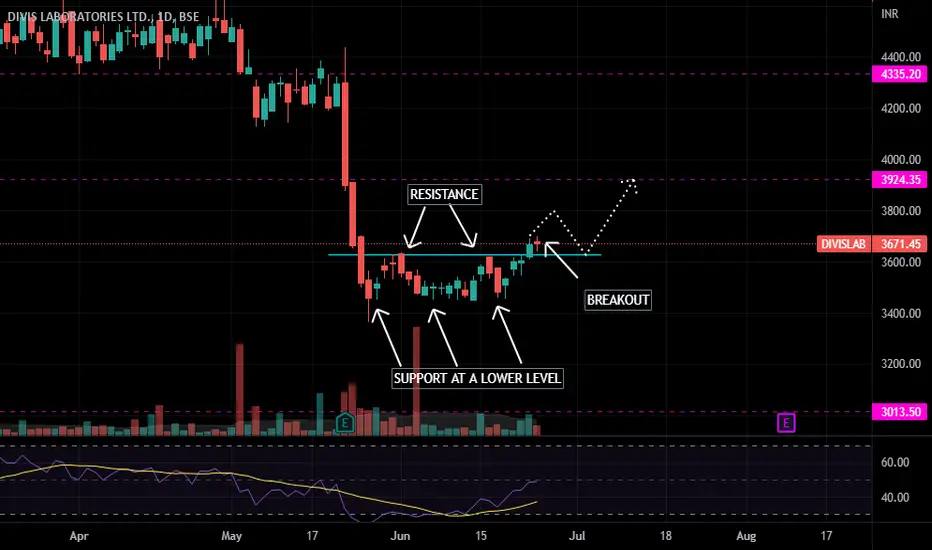
Divis laboratory gave a decent breakout above 3635BSE:DIVISLAB gave a decent breakout above the level of 3635 which was resisted twice and came back to a bottom level, thus the bottom wasn't breakdown showing a good sign of bulls in the stock and the breakout was also a proper green candle closing above the resistance level, thus my view is to go long and the target is 3859 with a strict stop loss of 3450..
DO like if its worth...!
thanks.