DIVISLAB

Divislab Bullish viewEnter with the Breakout
Levels are given on the chart
Disclaimer: This is not a investment/trade recommendation

DIVISLAB : Last opportunity to go for long!DIVIS LAB is looking for buying opportunity, best time to get in & make some decent amount of profit. It's now or never.

Divis Laboratories - Wednesday TradeTrendline earlier acting as resistance is giving support now. Also stock has formed inverted Cup n handle on Daily TF. Good to short if breaks TL and sustains below


DIVISLAB : Looking for great buying opportunity!DIVISLAB is looking for great buying opportunity. Has the chance to make some heavy chunks of profits, Charts looks way clean & ready to 🚀

Divislab for positional Trading - Not for IntradayScenario 1 Long:
----------------
Now Divislab currently made double bottom . Now in Lower time frame it is showing reversal indication of Hammer candle in lower time frame
If Divis Lab moved above 3427 the we can go for Long and Stop Loss would be.3312
The 1st Target Will be 3686 & 2nd Target will be 3879
Scenario 2 Short
---------------
If Divis Lab breaks below 3251 the we can go for short and Stop Loss would be.3312
The Target Will be 3023
Scenario 3 Long
---------------
After Completion of Scenario 1( level 3887) The price will be retest @ 3804 and will break out after 3887 and retest the same level from new high and start rally toward the price level of 4441. This pattern is called cyclic Double Top .
Also we can take entry @ retesting zone of 3900 to 3983 But the stop loss should not below the 3804 and the target will be 4441

Breakout of Downtrend channel in DIVISLAB In yesterday's trading session, DIVISLAB gives breakout of its downtrend channel. After this breakout expected it will go till 3750+ level in the upcoming trading session.


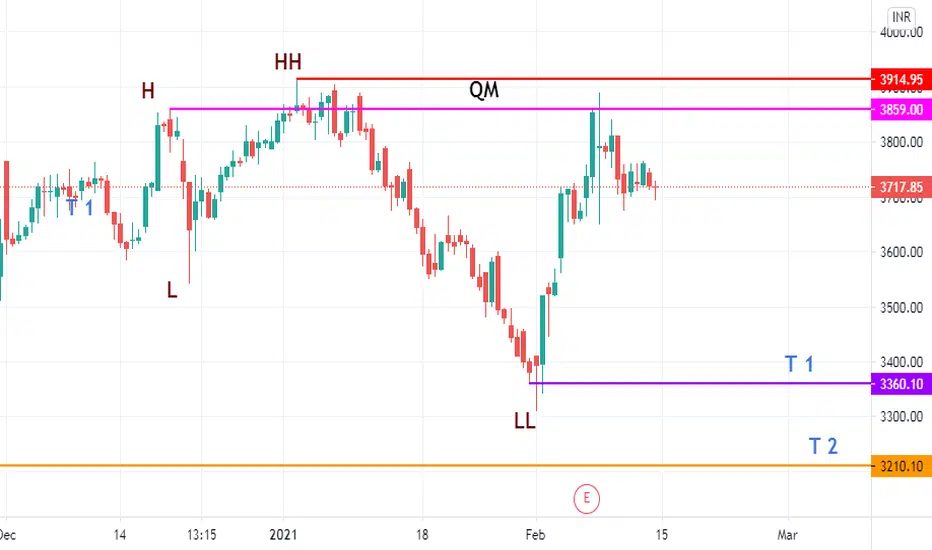
Divis Lab ShortShort divis lab position ally for target 3360 & 3210
Note : Trading in any financial market is very risky. I post ideas for educational purpose only. It is not financial advice. Do not hold us responsible for any potential loss you may incur. Please consult your financial adviser before trading.


DIVISLAB buy at 3535I will buy DIVISLAB because :
It has been taking support at the trend line .
So will be looking at buying opportunities.
If it breaks the support look at shorting
Entry : 3535
Target : 3890
Stop loss : 3446

Expected Move of DivisLabThe stock has formed the Rounding Top and may trade in the green channel to form the handle in order to complete the pattern. Keeping it on the watch list.
I would also try to post an Expiry trade for option buyers.
To motivate me, Please like the idea If you agree with the analysis.
Happy Trading!
InvestPro India Team

DIVIS LABSIm not an expert im just sharing my views on DIVISLABS for tomorrow
Im not responsible for any profit or loss this is not a recommendation


DivislabDivislab is making syymetri triangle,upon either side breakout/breakdown we will tale position .


SellSell at CMP or on rise around 3668-3675 sl 3742 TGT 3180.
Disc : It's not an investment advise to buy or sell

Divislabdivislab:- buy above 3200rs for 3500 tgt sl 3000dcb
(BOTTOM FISHING)
#Disclaimer:-I just shared view for only educational purpose.

DIVISLABTrendline and the specially designed volume action analysis suggest a BEARISH run on the DIVISLAB.
This is my this week analysis on DIVISLAB pivot point and resistance line are supporting the bearish view.
The background with light green color are indication for bulls taking the position and the Light red background suggest Bears are dominating in the region.
will give follow back to all the followers.
Please comment and let me know about my analysis, Follow for more analysis.
**DISCLAIMER
There is a very high degree of risk involved in trading. Past results are not indicative of future returns. I assume no responsibilities for your trading and investment results. The indicators, strategies, columns, articles and all other features are for educational purposes only and should not be construed as investment advice.

L&T FINANCE HOLDING FOR DIWALI 2021 INVESTMENT MUHURAT STOCKL&T FINANCE IS READY FOR INVESTMENT FOR TILL NEXT DIWALI 2021 AND CAN SEE LEVELS OF 90-120 IN NEXT 6-8 MONTHS LEVELS ARE MARKED ON THE CHART

BEARISH view on DIVISLABTrendline and the specially designed volume action analysis(Designed in Pine script code) suggest a Bearish run on the CIPLA.
The DIVISLAB is nearing the resistance line with good bearish volume indications.
This is my NEXT week analysis on DIVISLAB two resistance line are there with good volume supporting the bearish view.
The background with light green color are indication for bulls taking the position and the Light red background suggest Bears are dominating in the region.
will give follow back to all the followers.
Please comment and let me know about my analysis, Follow for more analysis.
