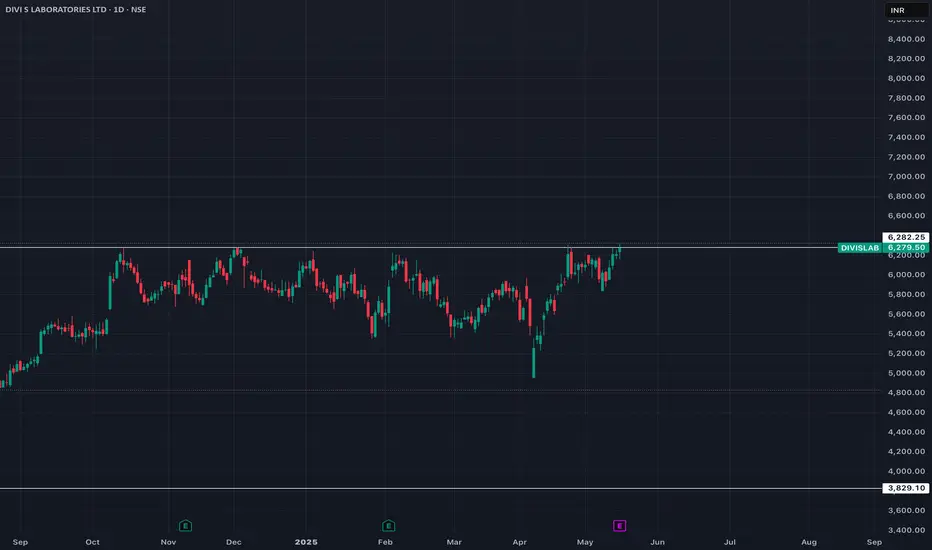
DIVISLAB - Range-to-Breakout Attempt from Demand💹 Divi’s Laboratories Ltd (NSE: DIVISLAB)
Sector: Pharmaceuticals | CMP: 6642.5
View: Range-to-Breakout Attempt from Demand | Momentum Rebuild in Progress
Chart Pattern: Accumulation
Candlestick Pattern: Strong Bullish Marubozu | Bullish Engulfing
Price Action:
DIVISLAB has transitioned into a well-defined accumulation phase following a prolonged corrective decline. After forming a structural base near the 6200–6300 region, price action shows repeated demand absorption, indicating that selling pressure has been largely exhausted at lower levels. The recent session printed a decisive bullish expansion candle from within the range, signalling a shift in control back toward buyers. This move marks an early breakout attempt from consolidation, with price reclaiming the mid-range and pressing toward the descending supply line. While the broader structure is still evolving, the latest price behaviour reflects a clear change in character from compression to directional intent.
Technical Analysis (Chart Readings):
The chart reflects improving technical alignment following a prolonged consolidation. Price has delivered a strong bullish Marubozu / engulfing candle, highlighting decisive buyer dominance and minimal intraday supply. This expansion follows a visible Bollinger Band squeeze, pointing to a volatility release after compression. Short-term trend alignment is improving, with EMA 9–20 crossover visible and price stabilising above key short-term averages, while the broader trend remains in recovery mode. Momentum indicators support this transition, with RSI around 63 signalling strength without immediate exhaustion, MACD showing a positive crossover with expanding histogram, and ROC confirming positive rate-of-change momentum. Volume participation has expanded above recent averages, indicating that the move is supported by participation rather than a low-liquidity spike. Overall, the technical state suggests a momentum rebuild phase emerging from accumulation.
Key Levels (Chart Readings):
The chart highlights a clear demand–supply framework guiding near-term price behaviour. On the downside, a strong structural support zone is visible in the 6200–6000 region, which has acted as a base for accumulation and repeatedly absorbed selling pressure. Intermediate support levels around 6470, 6298, and 6203 further reinforce this demand structure. On the upside, overhead supply is visible near the 6700–7000 band, where prior price reactions indicate selling interest and distribution. Intermediate resistance levels around 6737, 6832, and 7004 mark zones where acceptance will be required for sustained upside continuation. The recent push from demand toward resistance reflects a range-to-expansion attempt, with price currently navigating a transition zone rather than an open trend environment.
Demand & Supply Zones (Chart Readings):
The chart outlines clearly defined demand and supply zones shaping short-term structure. On the Daily timeframe, a major demand zone is clearly established in the 6447-6345 region, where price previously(recently) formed a strong base followed by an impulsive upside move, highlighting long-term demand absorption and accumulation by higher-timeframe participants. This daily demand zone provides the broader structural floor for the current price action.
A swing demand zone is visible near the 6381–6345 region, which has acted as a base for higher-low formation and sustained buying interest. Within this, intraday demand zones around 6510–6481 highlight immediate support areas where buyers have been active during pullbacks. On the upside, supply zones remain clustered near the 7280–7330 region on higher timeframes, while nearer-term resistance is visible around the recent swing highs. Collectively, these zones frame the current environment, with price attempting to rotate upward from demand into overhead supply, making follow-through and acceptance key variables to monitor.
STWP Trade Analysis:
DIVISLAB has triggered a bullish expansion from an accumulation base, supported by improving momentum and expanding volume. From an intraday perspective, price holding above the 6660 zone keeps the bullish bias intact, with scope for continuation toward the upper resistance bands as long as demand remains defended. From a short-term swing standpoint, the same zone supports a broader mean-expansion framework over the next few sessions, provided price continues to build above reclaimed levels without slipping back into compression. The STWP view remains constructively bullish, with trend bias turning upward, RSI reflecting healthy strength, and volume behaviour confirming participation. Risk, however, remains elevated due to the proximity of overhead supply, making disciplined position sizing and structure-based risk management essential.
Final Outlook:
Momentum: Strong
Trend: Up
Risk: High
Volume: Moderate
The structure favours a continuation attempt as long as price sustains above demand zones, but confirmation through acceptance above resistance is required for trend acceleration. Traders should prioritise structure, risk control, and follow-through over prediction during this transition phase.
⚠️ STWP Educational & Legal Disclaimer
This content is shared strictly for educational and informational purposes only. All discussions, illustrations, charts, price zones, and options structures are meant to explain market behaviour and do not constitute any buy, sell, or hold recommendation. STWP does not provide investment advice, trading calls, tips, or personalized financial guidance, and is not a SEBI-registered intermediary or research analyst.
The analysis is based on publicly available market data and observed price–derivatives behaviour, which is dynamic in nature and may change without notice. Financial markets involve inherent risk, and derivatives carry elevated risk, including the potential for significant capital loss. Factors such as option premiums, implied volatility, open interest, delta, and other Greeks can shift rapidly and unpredictably.
All trading and investment decisions, including position sizing and risk management, are solely the responsibility of the reader. Always consult a SEBI-registered investment advisor before taking any financial action. STWP, its associates, or affiliates shall not be liable for any direct or indirect loss arising from the use of this material. Past patterns, structures, or historical behaviour must never be treated as guarantees of future outcomes.
Position Status: No active position in this instrument at the time of analysis
Data Source: TradingView & NSE India
💬 Did this add value?
🔼 Boost to support structured learning
✍️ Share your views or questions in the comments
🔁 Forward to traders who value disciplined analysis
👉 Follow for clean, probability-driven STWP insights
🚀 Stay Calm. Stay Clean. Trade With Patience.
Trade Smart | Learn Zones | Be Self-Reliant 📊
Divislabtechnicalanalysis

DIVIS LAB DIVIS lab is on verge of a very very big breakout which could drive it in open sky everybody should consider it for long
SWING OPPORTUNITY IN DIVIS LOBOROTIES My analysis on this script is bullish.Ofter Proper Breakout and Retest on wedge pattern created strong Demand zone and started rally.
Entry criteria 1: ofter retest at 4083 Level(with Volume)
Entry criteria 2: ofter Breakout and Retest at 40700 level (with Volume)
Target:5378 🚀
#Divislaborotiries #Healthcaresector

DIVISLAB LONGLooking good for long once it break's out the resistance. Avoid short positions, however if you wanted to short let the candle close below the horizontal line
It is 0.23% retracement.

DIVIS Labratories - Break Divi's Laboratories Limited is an Indian multinational Pharmaceuticals company and producer of active pharmaceutical ingredients and intermediates headquartered in Hyderabad, Telangana, India. The company manufactures and custom synthesizes generic APIs, intermediates

Divis Lab Analysis !! Broke Out📈 Divis Lab 📉
This broke out from a Resistance Zone of downtrending Trendline and closed above previous high of 4450.
On Buy Side I am looking for Targets of 4680, 4940 and 5370.
StopLoss should be kept below 4200-4300zone.
It offers 1:3 Risk To Reward.
All Important Supports and Resistances are drawn in chart. All levels are on closing basis.
Please have a look and revert back if you need some more study on it.
Disclaimer : Consult Your Financial Advisor Before Taking Any Decision On This Analysis.

Divis Labs (Bullish stance)Divis Labs:
Sector: Pharma and Biotechnology
Industry: Pharma
Divis Laboratories (Weekly):
1. Double Bottom
2. Breakout of Double Bottom
3. Positive Crossover of 5,13 Weeks Exponential Moving Average
Daily:
1. RSI Bullish Divergence and Double Bottom Breakout
2. Trendline Breakout
3. Good to buy above consolidation breakout (closing above 4590)
4. Positive crossover of 5,13 Days Exponential Moving Average
5. Trading above 200 Days Exponential Moving Average
Addl Points:
1. FII/FPI have decreased holdings from 19.30% to 18.45% in Mar 2022 qtr
2. Mutual Funds have increased holdings from 13.35% to 13.68% in Mar 2022 qtr.
Note:
1. The above analysis is just for educational purpose.

Divis Lab - Long OpportunityLong Opportunity
Divis Las has moved more than 100 points on the last trading day, and then it went sideways. If it crosses the level of Rs. 4573.90 then we can go for long. there is a long target for the positional trader because this stock has created a double bottom pattern on the daily chart, which means there is bullish movement expected in upcoming days.

Divis Lab - Long OpportunityLong Opportunity -
This is the recovery rally, but there is not a huge impact we have seen on Divis Lab stock, but it may go positive if there is any positive news about the Russia-Ukraine war. For now, we can expect positive movement in the stock. If this stock opens a gap up or flat we can go for long once it crosses the level of Rs. 4480.65 for the target of Rs. 4524.75.

Divis Lab - Short OpportunityShort Opportunity -
Divis lab has formed a bearish pattern on Day, 1 Hour and 5 Minutes timeframe chart and for upcoming days there will be a bearish movement expected in the pharma sector. There is no direct connection between the Russia-Ukraine war but as the many pharma sectors have their plants in Russia, there may be an effect we can see on this stock too. The level of Rs. 4430.30 is very crucial and if this support breaks there will be a sharp fall expected. We can go for short if this level breaks for the target of Rs. 4373.20.
Happy Trading!

Divis Lab - Long OpportunityLong Opportunity -
Divis lab has shown bullish sentiments, and it is expected to go up on the next trading day. If it crosses the level of Rs. 4520.55 then we can go for long for the target of Rs. 4551.30. But it has formed a double bottom pattern in 15 minutes timeframe, so it might retrace at a neckline of Rs. 4466.65.
Happy Trading!

Divis Lab - Short OpportunityShort Opportunity -
Divis Lab has formed a double bottom on a 1-hour chart timeframe and it is in retracing mode, so it is expected that this stock will fall down on the next trading day till Rs. 4267.90. We will go for short if any candle closes below 4372.75.

Divis Lab - SidewaysSideways
Divis Lab is on the uptrend, but it is having a holt on Rs. 4400, which is the psychological number. When the stock trades at this psychological number it means that the stock might take a holt over there and then may show breakout. If it crosses the critical level of Rs. 4404 then it will show an upward direction again. We can go for long if it crosses this level. But This stock shows both upward and downward trends so there are high chances that it will go sideways.

Divis Lab - Long OpportunityLong Opportunity -
Divis lab ha retraced on last trading day, and it has collected strength to go up. There is critical resistance of Rs. 4352.80, if this stock cracks this level we can go for long or else if this stock falls down we can find buy opportunity at the level of Rs. 4304.45, it can take support of this level and may jump to achieve the target of Rs. 4443.75.
Happy Trading!

Divis Lab - Long OpportunityLong Opportunity-
Divis Lan is in an uptrend and on Friday it can show bullish movement. There is Resistance Zone between 4331.10 to 4334.10, Price has given multiple attempts to break this level, but didn't sustain over there. If it crosses this level then we can go for Long for the target of Rs. 4380.70.
But kindly note that we can't ignore the double top pattern of this stock if it retests at a level of Rs. 4296.40 then we can go for short for the target of Rs. 4241.

Divis Lab - Long OpportunityLong Opportunity -
Divis lab has confirmed the change in trend. The uptrend has started, The stock gives multiple attempts at a level of Rs. 4235, which is the Fib level of 0.382 but it has not broken this level. The support is strong and it is ready to take the jump. Very soon we can expect a level of Rs. 4461.50.
We can go for a long on Thursday, there are two targets are expected but as the international market closes in positive sentiment, it might open gap up. If it happens we can go for long for 2nd target.

Divis Lab - Long OpportunityLong Opportunity -
Divis Lab has changed the trend from the downward to upward direction. It has been retested at the neckline of Rs. 4066.00 & take a bounce from it. So, there is a bullish trend expected in this stock on Wednesday. It may consolidate at a level of Rs. 4174.55 & then may take a jump or it will retest at a level of Rs. 4116.50 & then may jump. We can plan for the long opportunity for the target of Rs. 4268.60.

Divis Lab - Short OpportunityShort Opportunity -
Divis lab took strong support of Rs. 4013.10. The international market closes in negative sentiments, so it is expected that this stock will open a gap-down. We will initiate our short selling of this stock closes below the level of Rs. 4013.10.
But we can't ignore that there is a double top pattern formed in this stock. and if his stock opens in positive sentiments, we will wait to retest this stock at a level of Rs. 4046.90 and then we can go for long. But there is a high probability trade at the downside.

Divis Lab - Short OpportunityShort Opportunity -
Divis lab is in the downtrend. We can go for short if it crosses the support level of Rs. 4100. The CPR is narrow and at the downside so we can expect a downtrend movement in this stock. It has strong resistance of Rs. 4118.85, if this stock opens above this level and 15 min candle closes above this level then there will be bullish movement expected.

Divis Lab - Short OpportunityShort Opportunity -
Divis lab is now showing a downtrend, it has reversed from 0.5 level of fib retracement which is also showing a downtrend. We can go for short if this stock closes below Rs. 4153.40 then we can go for short. This is the level where the stock will break its descending triangle pattern.

Divis Lab - Short OpportunityShort Opportunity -
Divis lab has taken resistance of Rs. 0.382 level of fib retracement and started falling down. There is bearish movement is expected as all the international market is closing in negative sentiments. If this stock closes below the 4151.50 level then there will be a strong bearish movement is expected. Ignore this stock if it gives movement in between 4192.45 to 4163.55.

Divis Lab - Long Opportunity.Long Position -
Divis Lab is now showing as an uptrend. If this trend continues on Wednesday then it might give the level of Rs. 4455.25 in the next 1-2 days. But we have to be cautious at this level, as Nifty Pharma is not in a recovery zone. But there is a Minor SR at the level of Rs. 4236.45, In case markets open gap up then we can initiate a trade in the above-drawn zone, but the condition is the first candle should be closed as bullish. If these all rules fit we can go for long and can easily achieve 30 points in intraday.
Beware that if the market opens in bearish sentiments there will be correction expected.
