DIXON (Weekly) — Wave 4 Bottom Forming?Elliott Wave + Fibonacci Confluence 📈
The weekly chart of Dixon Technologies (India) Ltd. is unfolding a textbook Elliott Wave structure.
After a powerful Wave 3 impulse, the stock is currently digesting gains through a complex Wave 4 correction.
Price is now approaching a high-probability demand zone, where Fibonacci retracement meets Elliott Wave theory — often a fertile ground for trend resumption.
Let’s decode the structure and map the strategy ahead. 👇
📉 Technical Structure Breakdown
🔹 1. Elliott Wave Context (Weekly)
Wave 3 (Impulse Peak):
Strong vertical rally completing above ₹20,000, reflecting momentum expansion.
Wave 4 (Ongoing Correction):
A corrective, time-consuming phase — aligning well with the Principle of Alternation.
Internal Structure of Wave 4:
Wave (a): Sharp decline toward ₹12,000
Wave (b): Relief rally / dead-cat bounce into prior resistance
Wave (c): Final corrective leg now testing the Fresh Demand Generation Zone
📌 Key Demand Zone: ₹11,525 – ₹10,925
🔹 2. Fibonacci Confluence (Golden Zone)
The highlighted zone on the chart marks the probable Wave-4 completion area, aligning with:
0.382–0.5 Fibonacci retracement of the entire Wave-3 move
A classic Wave-4 retracement depth, which is typically shallow compared to Wave-2
This confluence strengthens the probability of structural support.
🔹 3. Price Action & Volume Clues
Price is attempting to stabilize and bounce from the lower end of the retracement band
Volume expansion at lower levels suggests:
Short covering by late sellers
Early accumulation by informed participants
📊 This behavior is commonly seen near intermediate cycle bottoms.
🎯 Trading & Investment Strategy
🛒 Entry Plan
Aggressive Entry:
Partial position around ₹12,165, with strict risk control
Conservative Entry:
Wait for a weekly reversal candle or strong demand reaction inside
₹10,925 – ₹11,525
🏁 Upside Targets
🎯 Short-Term: ₹15,369 (Previous structure resistance)
🎯 Mid-Term: ₹17,566 (Wave-(b) high / supply zone)
🚀 Long-Term (Wave-5 Projection):
Retest of ATHs with potential extension toward ₹22,000+, if impulse resumes
🛡️ Risk Management
Swing / Mid-Term SL: ₹10,915 (Below demand zone)
Hard Invalidation (Wave Count): ₹8,851
A break below this level invalidates the bullish Elliott Wave structure
⚠️ Position sizing is critical — Wave-4 trades require patience and discipline.
📚 Educational Insights (For Traders)
Principle of Alternation:
Wave-2 was sharp and deep → Wave-4 is expected to be complex / sideways
Why 0.382 Matters:
Wave-4 corrections often terminate near 38.2% retracement of Wave-3
Demand Generation Zones:
Areas where price consolidated before a breakout often act as magnets during corrections
💡 Final View
DIXON remains structurally bullish on the higher timeframe.
While the current correction feels uncomfortable, it is healthy and necessary within a long-term uptrend.
📌 The ₹11k–₹12k zone is a patience zone, where Wave-5 preparation may be underway.
➡️ Question for traders:
Is Wave-4 already complete, or do we see one final flush toward ₹10,900 before lift off?
Share your thoughts below 👇
⚠️ Disclaimer
This analysis is for educational purposes only.
I am not a SEBI registered analyst.
Markets are uncertain, and I may be wrong — please manage risk accordingly.
Dixontech

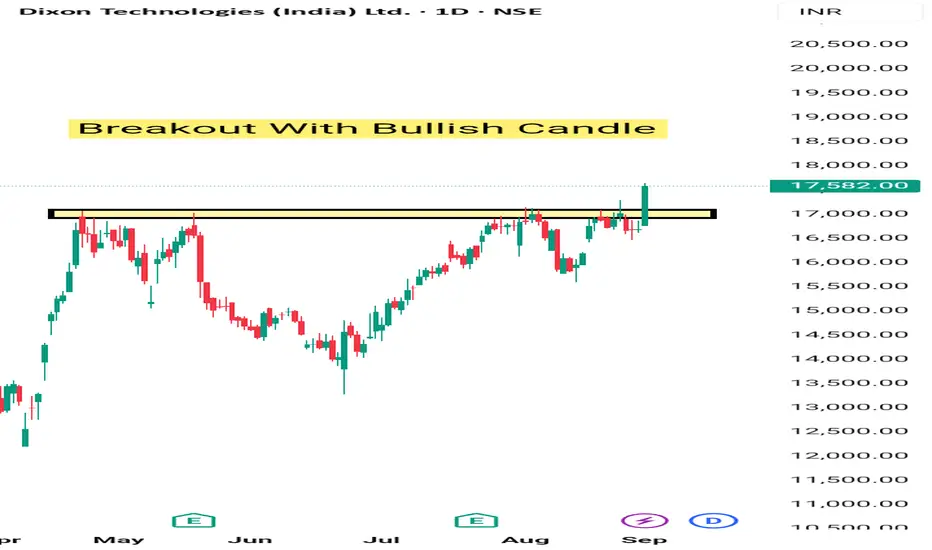
Dixon Breakout Tgt next 5-6%Dixon given breakout with high volume & made a clear breakout with bullish candle. It may give another 5 -6% Movement for swing trading . Stock is good for long term also . It's given breakout of rounding Bottom.
Dixon Inverted HnSDixon Technologies is making a inverted Head n shoulder in the daily timeframe.
One can look for taking an entry at the retest of 17300-17320. Support can be considered at todays low. Keep a Check on the Chart and you will get to see how a head n shoulder is made.
Usually the Support for a HnS is right shoulder low so mid term traders can consider that level.
Follow for such more Analysis.
Jai Shree Ram.

DIXON TECH – Nearing a Big Breakout Zone!Dixon Technologies is getting close to a major trendline resistance that has been holding the stock down since December 2024. But now, the chart is showing strong signs of a possible breakout after a solid uptrend in recent weeks.
* What the chart shows:
Price is moving up strongly and is now near the resistance trendline (~16,700 zone).
Dixon Tech has been rising steadily and is now testing a long-term trendline that has previously acted as a ceiling. If it breaks above this level with good strength, it may open the door to a new rally.
It is trading above the 200-day moving average, showing strength.
The price has moved above the 200-DMA (blue line), which is a key level watched by traders and investors. This shows that the overall trend is positive and that buyers are in control.
MACD indicator is giving a bullish signal – supporting upward momentum.
MACD is showing a bullish crossover, which means momentum is picking up. This adds more confidence that the stock may continue to rise in the near term.
Volume is rising on green candles – this shows strong buying interest.
Higher volume on up days means more traders are participating in the up move. This buying interest is a strong confirmation that the market supports the current uptrend.
* Conclusion:
If Dixon breaks and closes above the trendline with strong volume, we could see a powerful breakout. This chart is worth keeping on your watchlist for a possible trading opportunity.
What’s your view? Will Dixon break out or face resistance again?

Dixon Technologies Bullish Bias 10% upsideThe Stock has been consolidating for a while
As visible from the RSI the stock has given a nice breakout from the range
The stock price was also falling and took support near 200day EMA zone
The price has reversed from the selling zone
3 days constant increase in the price and reversal with a W Breakout pattern
The overall sentiment looks really bullish for the counter
Also, the tariff pause shall be helping the business for a short term
Looks really bullish to me.
Caution: Trade as per your risk appetite.

DIXON- Backed by Semi Conductor PlayHighly resilient stock Dixon has fallen the least in weak markets.
This stock has followed the channels well until now.
Brokerages have gradually increased BUY ratings on this one as well.
Targets: 18000+
Stop Loss: 12000
You are responsible for your own loss/profit.

Dixon Tech cmp 15807.40 by the Daily Chart viewDixon Tech cmp 15807.40 by the Daily Chart view
- Price Band 14300 to 14500 now acting Support Zone
- Stock Price decently trading above EMA 21-50-100-200
- Volumes are going steady and below avg traded quantity
- Ascending Triangle Pattern breakout attempts are in progress
- Daily Support 15380 > 14718 > 13725 Resistance ATH 15987.95

Dixon Tech either buy or wait to buy??
Dixon is trading in a parallel channel for a while and now it is holding on to the higher levels.
The company is a EMS (Electronic Manufacturing Services) and provides them to the listed companies.
On the monthly charts, the stock has been travelling and given 150% returns in the current year.
Much of the movement is given this year and still the targets of 20k is being recommended by some rating services company.
As for now the stock is holding on to the higher levels and creating a Flag and pole pattern.
400 points range the stock is consolidating and the bullish flag break out can take the stock to the higher levels.
A low volume accumulation in happening in the stock and the target levels of around 17800 can be seen in the coming weeks.
Targets :- 16700, 17700
Wait for the price action around the break out level and enter as per the setup.

DIXON#DIXON CMP 14200
Continuously taking support from 50 EMA
Ready for breakout and the ADX is at near
to 25 shows confirmation of uptrend.
next target will be around 14890.

Dixon Technologies: Market Sentiment and Options StrategyMarket Sentiment Overview
As Dixon Technologies approaches its dividend declaration on September 18, 2024, the options data reflects a balance between bullish sentiment and caution:
- Bullish Indicators:
- Call Options Build-Up: Strong buying activity is observed, especially at the 14,000 and 15,000 strike prices.
- Put-Call Ratio (PCR) at 0.98: This indicates a slightly bullish sentiment, as calls outnumber puts.
- High Open Interest in Calls: A total call OI of 23,51,300, focused on the 14,000 and 15,000 strikes, supports upward momentum in the stock.
- Caution Signals:
- Aggressive Put Buying: Put OI of 9,36,500, mainly concentrated at the 13,000 strike price, signals hedging or caution.
- High Intraday PCR of 50.08: This suggests increased put buying activity, indicating traders are hedging against possible downside.
- Volatility Expectations:
- Implied Volatility (IV): Ranging between 37.66% and 41.8%, which points to the potential for significant price swings.
Key Price Levels
- Resistance: 14,000 – 14,500, with 15,000 acting as a strong cap.
- Support: 13,000 – 13,500, serving as a potential floor.
Recommended Options Strategies
1. Bull Call Spread (Moderately Bullish)
- Strategy: Buy 14,000 Call, Sell 15,000 Call.
- Target: Profitable if Dixon rises toward 15,000.
- Suitability: Ideal for traders with a moderately bullish outlook, offering limited risk and reward.
2. Bear Put Spread (Moderately Bearish)
- Strategy: Buy 13,000 Put, Sell 12,500 Put.
- Target: Gains are realized if Dixon drops toward 12,500.
- Suitability: Suitable for traders anticipating a moderate downside, providing defined risk and reward.
3. Protective Put (Hedging Strategy)
- Strategy: Buy 13,000 or 13,500 Put to hedge against downside risk.
- Purpose: Allows long-term investors to maintain their position while protecting against adverse price movements.
- Suitability: Best for long-term investors looking to manage risk during heightened volatility.
Conclusion
Dixon Technologies’ options data leans towards a bullish bias, with rising call OI at 14,000 and 15,000. However, the increased put activity at 13,000 indicates some hedging and caution. Short-term traders can capitalize on a bull call spread for upside potential or a bear put spread for downside protection. For long-term investors, a protective put is recommended to mitigate risks as volatility rises ahead of the dividend announcement.
Disclaimer
The information provided in this analysis is for educational and informational purposes only and should not be construed as financial or investment advice. Options trading involves substantial risk and is not suitable for all investors. Past performance does not guarantee future results. It is important to conduct your own research and consult a licensed financial advisor before making any investment decisions. The strategies discussed are based on current market conditions, which are subject to change. We do not guarantee the accuracy or completeness of the information presented, and we are not liable for any losses incurred from its use.

DIXON 10 Years Target 2.5 Lakh possible based on monthly ChartsDIXON 10 Years Target 2.5 Lakh possible based on monthly Charts.
LTP – 11670 can be accumulated around 11400-12000 price range.
Targets - 2.5 Lakhs + {20x Return in 10 Year} ... Another Multibagger who can Compete with MRF.
Time frame - 9-10 Years
No SL its Long-Term Investment hold.
Fundamentally company Profits are growing almost double in every 2-3 Years ... Excellent Business & future technology company.
Almost Debt free company with Clientele - Motorola, Xiaomi, Samsung, Airtel, Reliance Jio, Acer, Lenovo, etc.

Dixon technology 10000 is target technical breakout level mentioned in chart, fundamental also good ,good results expect in Q4

2 year rounding bottom breakout + retest in Dixon Tech.Background:
With a massive ~8x post covid rally, Stock gave highest closing of 5753 and entered a long consolidation beginning Oct'21.
Strong Breakout (With reasoning):
With 2 years of consolidation and making a rounding bottom, the stock finally broke out and closed at 5951 on 1 Dec 23 along with good volume buildup. Post breakout, it consolidated again making a high of 6670 (sign of a healthy breakout).
Now, with breakout of this range, dixon is ready for a massive rally of ~56% being the gap between the low of round bottom and resistance.
Entry, Stop Loss and Target (With rationale):
1) With the stop loss at 6300 (low of Breakout candle), first target comes at 7600 (Being 2:1 risk reward)
2) 2nd Target at 8500 (1.6 level of fibonacci)
3) 3rd one, 9300 final target.

Dixon Chart Analysis for Swing Trading 31.01.2024Currently Dixon is trading at 5862.
We can sell below 5850 for the targets of 5724, 5425 and 4985
One can buy Options PE side if can.
Consult your financial advisor before taking any trades.
Follow me. Boost the Post and Comment.
Thanks.

SELL DIXON FOR 1:3 RRDixon Technologies look weak on daily chart and taking short position around 6100 - 6000 levels can be a good trade from risk reward standpoint. Expect Dixon slide till 5400 and then 5200 levels until 6400 is intact on the upside.
Please like the idea If you agree with the analysis, your like will motivate us to share more ideas on Tradingview.
Happy Trading!
InvestPro India

BREAKOUT DIXON TECHNOLOGYBuy Dixon Technology At Cmp - 4859
Add More If Price Fall To 4370-4400
SL - 3950 ( Weekly Closing Basis )
Target - 6800

Make some Collection from DIXON.Not a very clean IHnS but can still give it a go as the price action indicates the exhaustion of supply.

DIXON TECHNOLOGIESWe can buy Dixon technologies around 4700 as per Elliot wave analysis this is the best palace. after ABC - correction wave a new fresh Elliot wave analysis we are seeing. So we can buy this particular script around 4600 which is the best place.

Dixon : Is it sell on rise opportunity ??Stock has given 100% to 130% returns in just a span of 9-10 months.
Currently its around the resistance.
So stock should take Resistance around 6100-6300
Its a pure sell on rise opportunity !!

📉 Alert! Bearish Pattern Spotted! 🐻📉 Alert! Bearish Pattern Spotted! 🐻
📊 Pattern: Falling Channel
📌 Symbol/Asset: DIXON
🔍 Description: Stock is around the resistance of falling channel. We can see downside hereon.
Good Short Idea.
👉 Disclosure: We are not SEBI registered analysts, this is not a buy or sell recommendation.

DIXON: 1 year inverted head and shoulder breakoutDIXON is showing a 1 year inverted head and shoulder breakout. It retested level and and is going back up and will face resistance at previous all time highs now. Good volumes and RSI.

Bearish Engulfing formed on DIXON,1DNSE:DIXON formed Bearish Engulfing, Bearish marubozu, Rising Wedge, Double Top and -ve RSI Divergence on Daily TF. ITs a high probability trade.
Entry : 4920.30
Target : 4650
SL : 5225
RR : 0.9

DIXON TECH: Breakout of Inverse Head & ShoulderDixon Tech Monthly chart gave breakout of Inverse Head and Shoulder Pattern and is currently going to retest the levels. Good Entry zone of around 4600-4700. Targets of 6700
