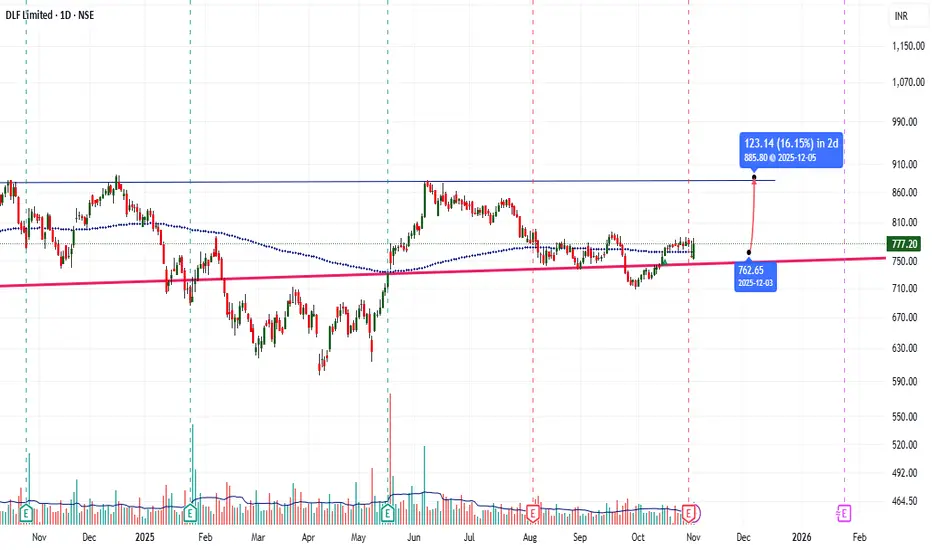
DLF In Uptrend ?DLF bouned back from its support, as did other realty stocks. Expecting a 16% gain in a month, but the fair price seems around 800, so fundamentally can get over-priced soon.
DLF
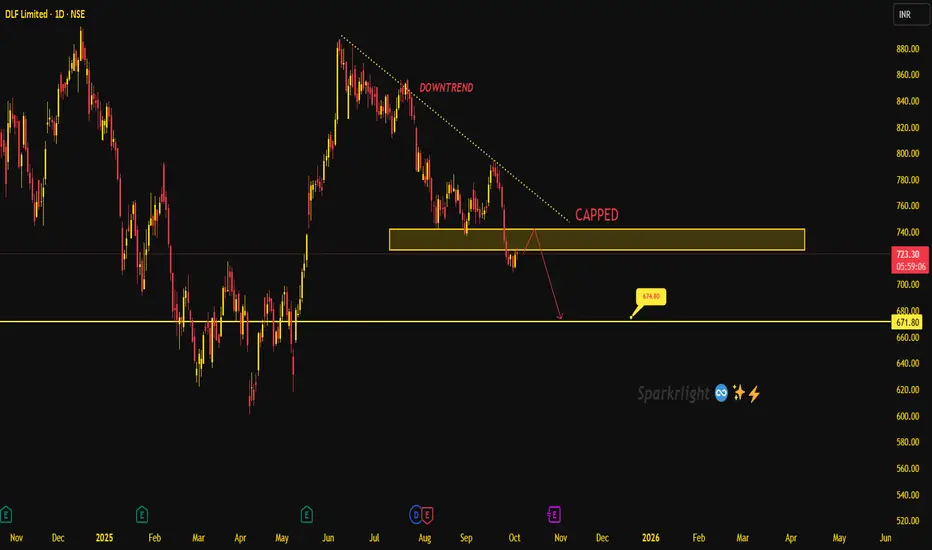
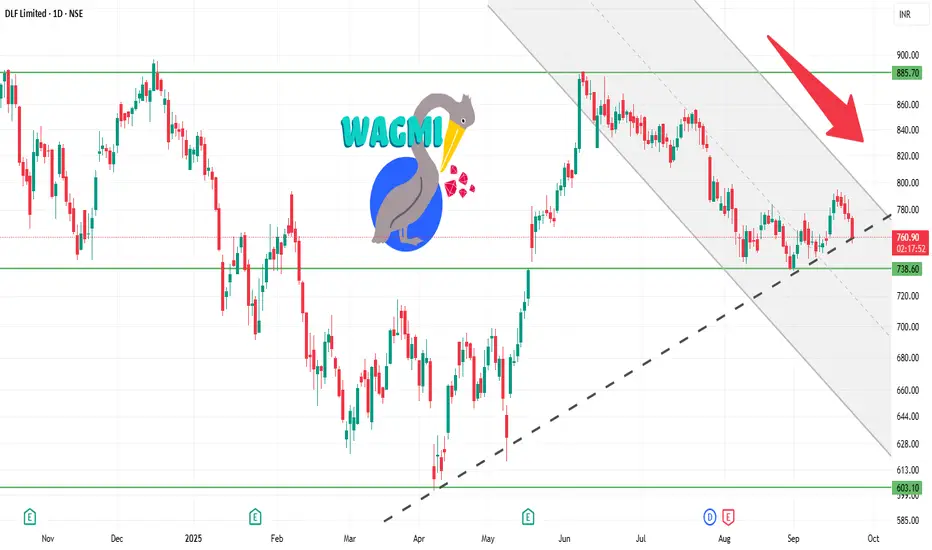
DLF Downtrend Intact – Eyeing 675 Next!DLF is clearly locked in a downtrend, with lower highs forming under the descending trendline. Price is struggling to break above the capped supply zone near 735–740, which continues to act as strong resistance. As long as the stock remains below this zone, the pressure stays on the downside with the next major support seen around 675–672. A break toward this level looks likely in the coming sessions, unless bulls manage to reclaim and sustain above the capped zone, which would temporarily ease the selling pressure. Until then, the structure remains bearish, with sellers holding control. Trade safe !
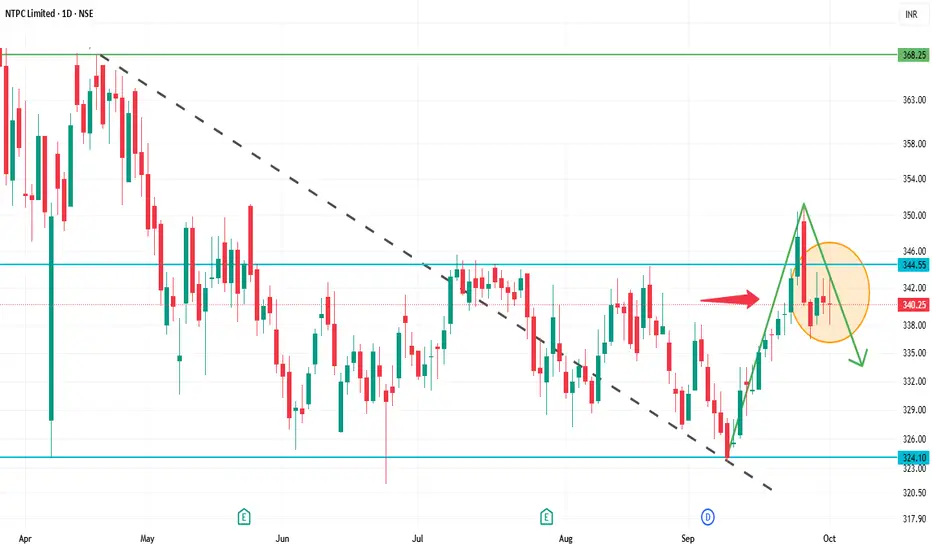
NTPC 1D Time frameCurrent Snapshot
Current Price: ₹340.25
52-Week High: ₹447.75
52-Week Low: ₹292.80
Strategy & Outlook
Bearish Bias: The stock is in a short-term downtrend with negative momentum indicators.
Selling Opportunity: Consider selling near resistance zones (₹343–₹345) with a target towards ₹335–₹340.
Risk Management: Place stop-loss orders above the resistance levels to manage potential upside risks.
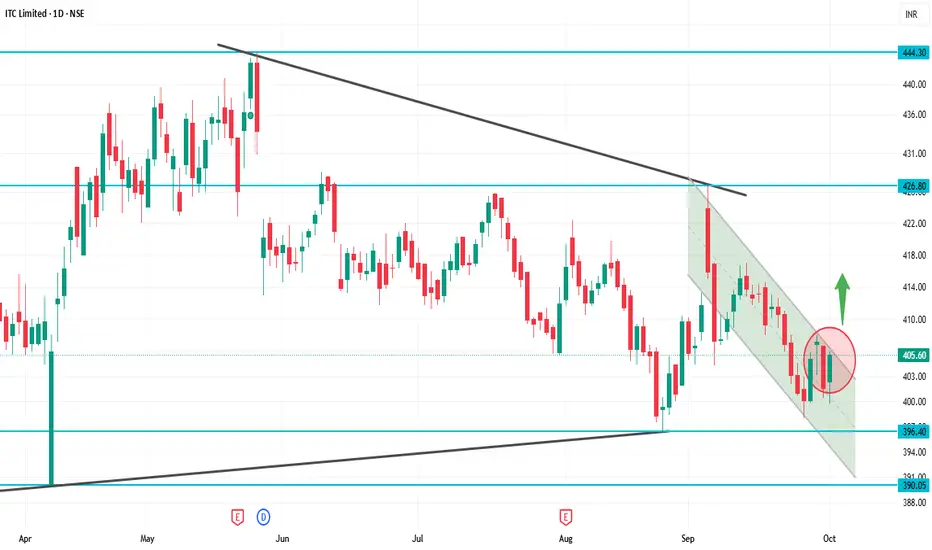
ITC 1D Time frameCurrent Price: ₹405.60
52-Week High: ₹524.35
52-Week Low: ₹390.15
Trend: Downward — trading below 5, 20, 50, 100, 200-day moving averages
Daily Chart Insights
Price below moving averages → bearish trend.
RSI & MACD → weak momentum, signaling short-term selling pressure.
Support zone at ₹390–₹400 → critical; a break below can push price down to ₹370–₹380.
Resistance at ₹420–₹430 → a strong close above may signal trend reversal.
Strategy / Outlook
Bearish Bias: Short-term trend is downward.
Buying Opportunity: Near support zones (₹390–₹400) if it holds.
Bullish Trigger: Close above ₹430 with strong volume indicates potential reversal.
Risk Management: Use stop-loss below critical support zones.
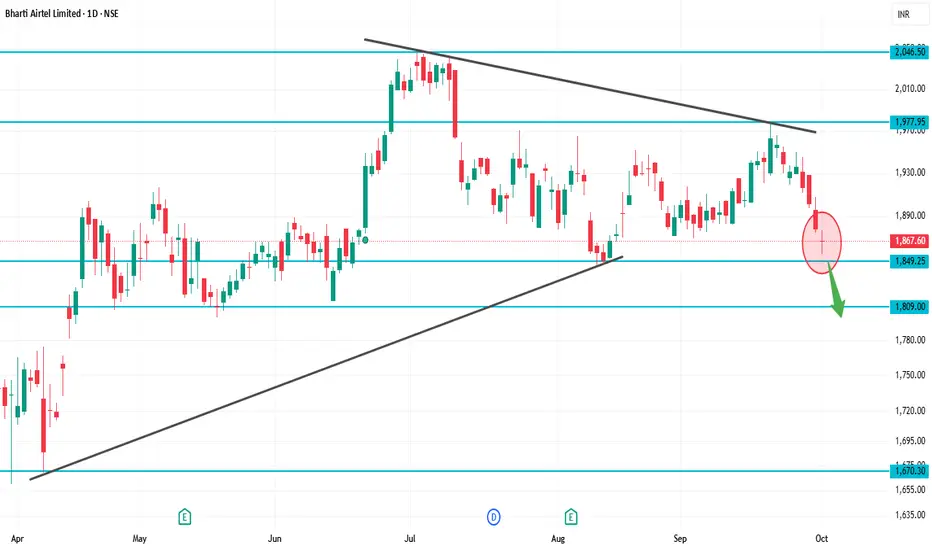
BHARTIARTL 1D Time frameCurrent Price: ~₹1,867
52-Week High: ~₹2,045
52-Week Low: ~₹1,511
Explanation
At ₹1,867, Airtel is just above immediate support (₹1,840–1,850).
If buyers hold this support, stock may bounce back toward ₹1,900+.
But if ₹1,840 breaks, then downside may open toward ₹1,800–1,750.
For bulls, a clean breakout above ₹1,920–2,000 is needed for fresh rally.
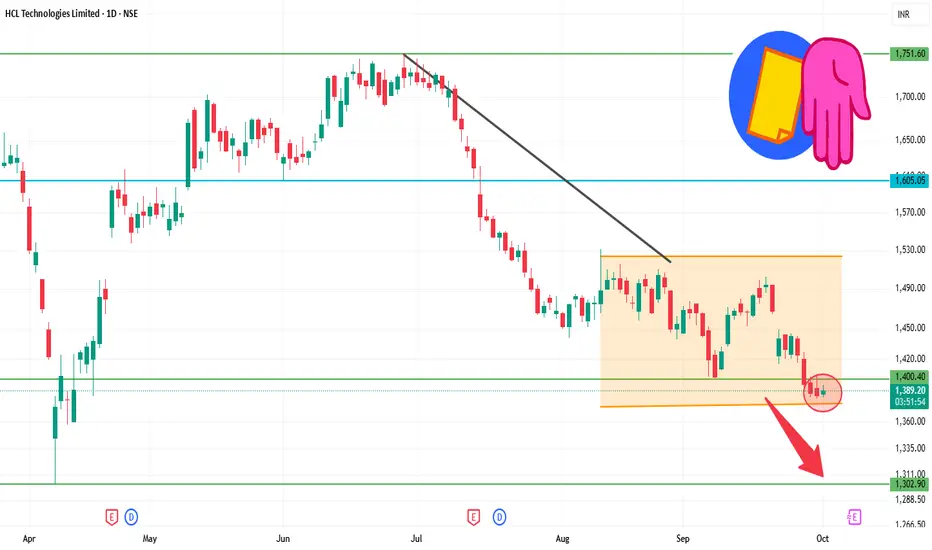
HCLTECH 1D Time frameOpening Price: ₹1,387.40
Closing Price: ₹1,387.40
Day Range: ₹1,383.10 – ₹1,395.00
Previous Close: ₹1,387.40
📉 Trend Analysis
Short-Term Trend: Bearish — The stock is trading below key moving averages, confirming the bearish trend.
Medium-Term Trend: Neutral — The stock is in a consolidation phase, characterized by lower highs and lower lows.
Long-Term Trend: Neutral — No significant trend identified; the stock is trading within a range.
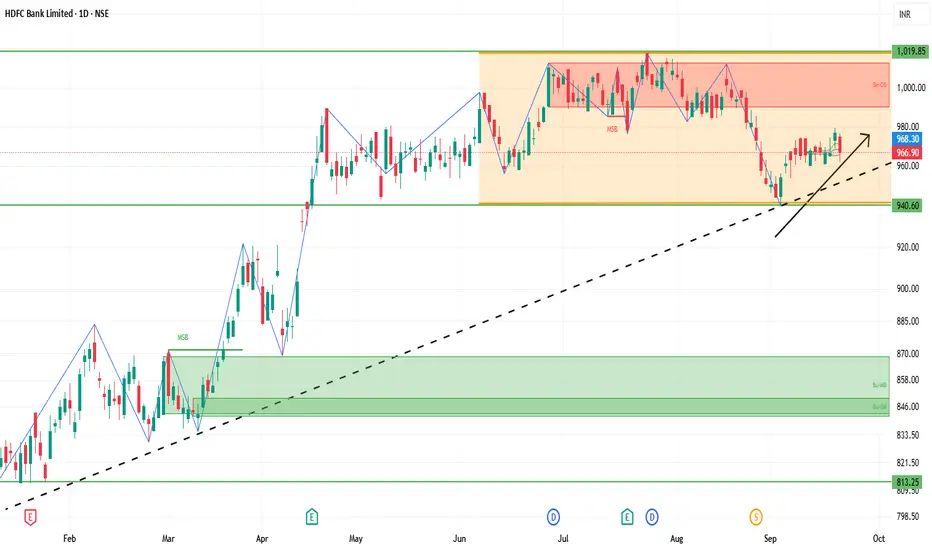
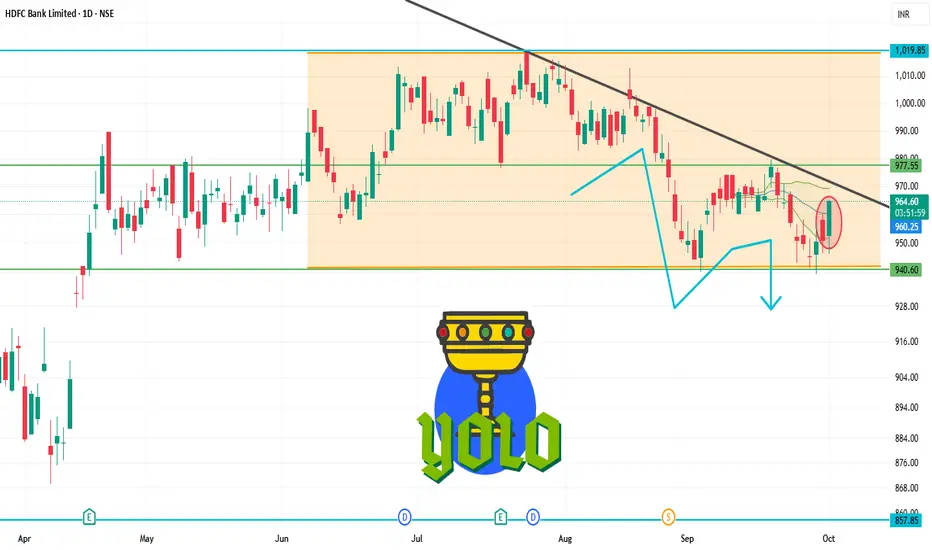
HDFCBANK 1D Time frameOpening Price: ₹950.30
Closing Price: ₹960.45
Day Range: ₹946.00 – ₹961.40
Previous Close: ₹950.30
🧠 Price Action Insights
The stock is trading below key moving averages, confirming the bearish trend.
No significant reversal pattern has formed, suggesting the downtrend may continue.
Watch for a breakout above ₹970.00 for a potential trend reversal.
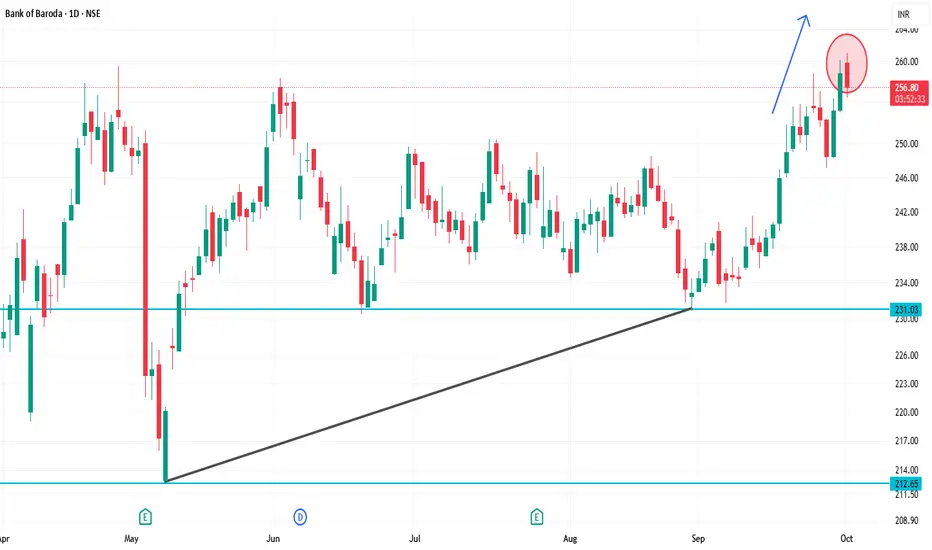
BANKBARODA 1D Time frameClosing Price: ₹257.60
Day Range: ₹253.70 – ₹260.00
Previous Close: ₹258.54
📉 Trend Analysis
Short-Term Trend: Bearish — The stock is trading below key moving averages, confirming the bearish trend.
Medium-Term Trend: Neutral — The stock is in a consolidation phase, characterized by lower highs and lower lows.
Long-Term Trend: Neutral — No significant trend identified; the stock is trading within a range.
🔮 Conclusion
Bank of Baroda is in a bearish trend with weak momentum.
Break below ₹250.00 could lead to further decline toward ₹245.00.
Break above ₹265.00 would indicate a potential trend reversal.
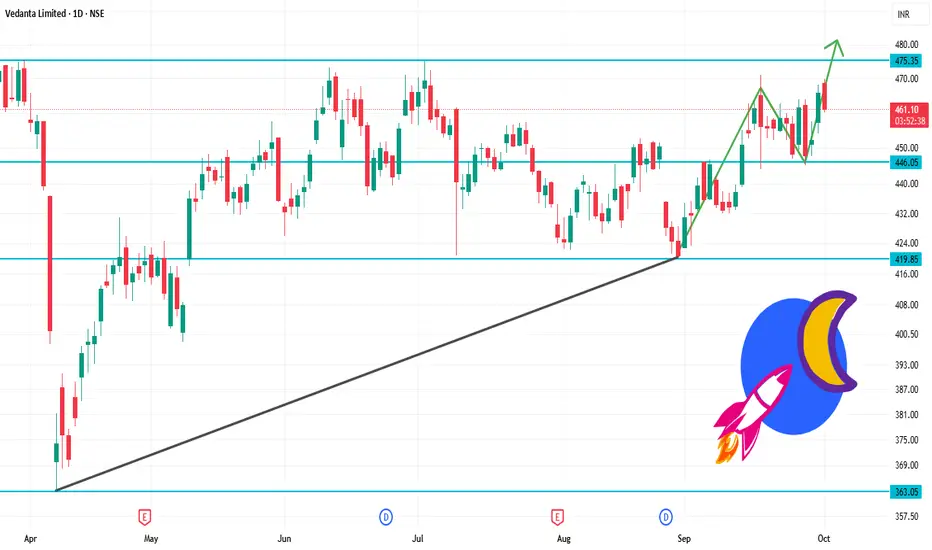
VEDL 1D Time frameOpening Price: ₹468.55
Closing Price: ₹461.40
Day Range: ₹463.00 – ₹469.85
Volume: 2,730,213 shares traded
📉 Trend Analysis
Short-Term Trend: Bearish – The stock is trading below key moving averages, confirming the bearish trend.
Medium-Term Trend: Neutral – The stock is in a consolidation phase, characterized by lower highs and lower lows.
Long-Term Trend: Neutral – No significant trend identified; the stock is trading within a range.
🔮 Conclusion
Vedanta Ltd. is in a bearish trend with weak momentum.
Break below ₹460.00 could lead to further decline toward ₹455.00.
Break above ₹475.00 would indicate a potential trend reversal.
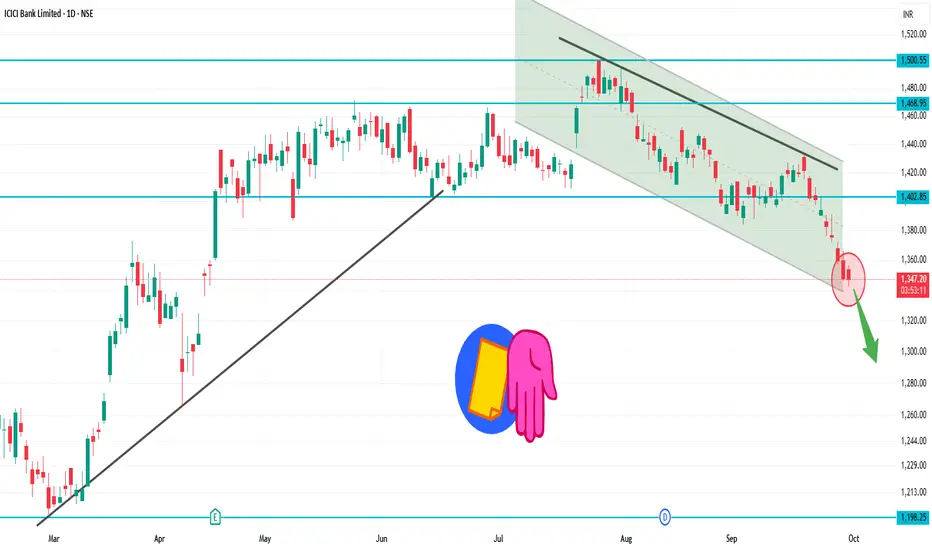
ICICIBANK 1D Time frame₹1,345.80 (NSE)
Day’s Range: ₹1,342.60 – ₹1,356.60
52-Week Range: ₹1,186.00 – ₹1,500.00
📉 Technical Overview
Trend: The stock is trading below its 200-day moving average, indicating a mildly bearish trend.
RSI: Currently at 26.6, suggesting the stock is in the oversold zone.
MACD: At -10.01, reinforcing the bearish momentum.
Moving Averages: A strong sell signal is indicated, with 0 buy signals and 12 sell signals across various timeframes.
🔼 Potential Upside (Rise)
Immediate Resistance: ₹1,355 – ₹1,365
Breakout Target: Above ₹1,365, the next resistance is around ₹1,380 – ₹1,390.
Bullish Confirmation: A close above ₹1,390 could signal a reversal or consolidation.
🔽 Potential Downside (Fall)
Immediate Support: ₹1,340 – ₹1,330
Breakdown Target: Below ₹1,330, the stock may test ₹1,310 – ₹1,300.
Bearish Confirmation: A close below ₹1,300 would strengthen the bearish outlook.
✅ Summary
Above ₹1,365: Potential rise toward ₹1,380 – ₹1,390.
Below ₹1,330: Potential fall toward ₹1,310 – ₹1,300.
Between ₹1,330 – ₹1,365: Likely range-bound movement.
AXISBANK 1D Time frameTrading close to ₹1,130.
This is slightly below the earlier ₹1,160–₹1,170 zone we discussed, so the range shifts down.
🔼 Upside (Rise Possibility)
Immediate resistance near ₹1,140 – ₹1,145.
If price breaks and sustains above this, it can move to ₹1,155 – ₹1,165.
Strong momentum above ₹1,165 may extend toward ₹1,175.
🔽 Downside (Fall Possibility)
First support is at ₹1,120 – ₹1,115.
If that breaks, price could slip toward ₹1,105 – ₹1,095.
Closing below ₹1,095 would weaken the trend further.
✅ Summary for Today
Above ₹1,140 → rise possible till ₹1,155 – ₹1,165.
Below ₹1,120 → fall possible till ₹1,105 – ₹1,095.
Between ₹1,120 – ₹1,140 → sideways range.

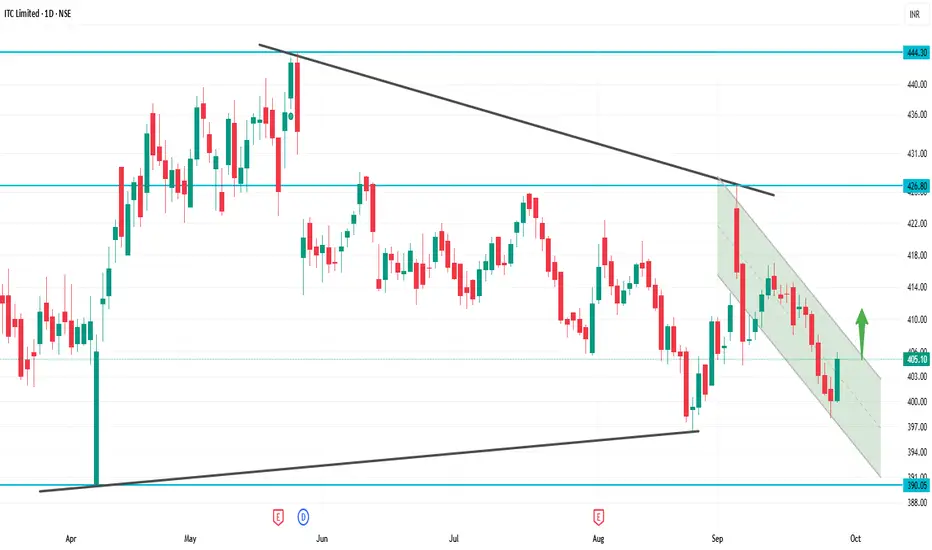
ITC 1D Time frame📊 Updated Snapshot
Current Price: ~₹405
Day Range: ₹402 – ₹410
52-Week High: ₹499
52-Week Low: ₹399
📈 Technical Outlook
Support Zones:
Strong support at ₹405 (current zone)
Next support at ₹398
Resistance Zones:
Immediate resistance at ₹410–₹416
Next resistance at ₹421
Trend Bias: Weak bearish → stock is near 52-week low, testing crucial support.
📌 Step-by-Step View
If it holds above ₹405–₹398: Buyers may step in, possible bounce toward ₹416–₹421.
If it breaks below ₹398: More downside risk opens, weakness can extend further.
Upside revival only above ₹421 closing: That will change trend toward bullish.
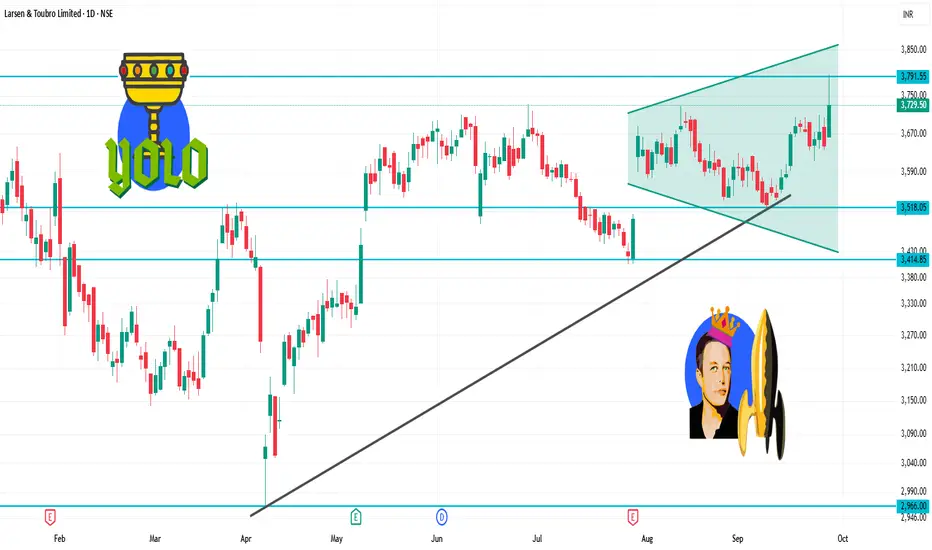
LT 1D Time framePrevious Close: ₹ 3,644
Today Open: ₹ 3,664
Day’s High: ₹ 3,795
Day’s Low: ₹ 3,661
Current / Last Traded Price: around ₹ 3,730
⚡ Strategy
Bullish Side:
Buy on dips near ₹ 3,700 – 3,720 with stop loss below ₹ 3,660. Target ₹ 3,760 → ₹ 3,795.
Bearish Side (Only if Weakness):
If price falls below ₹ 3,660, short opportunities may open toward ₹ 3,600.
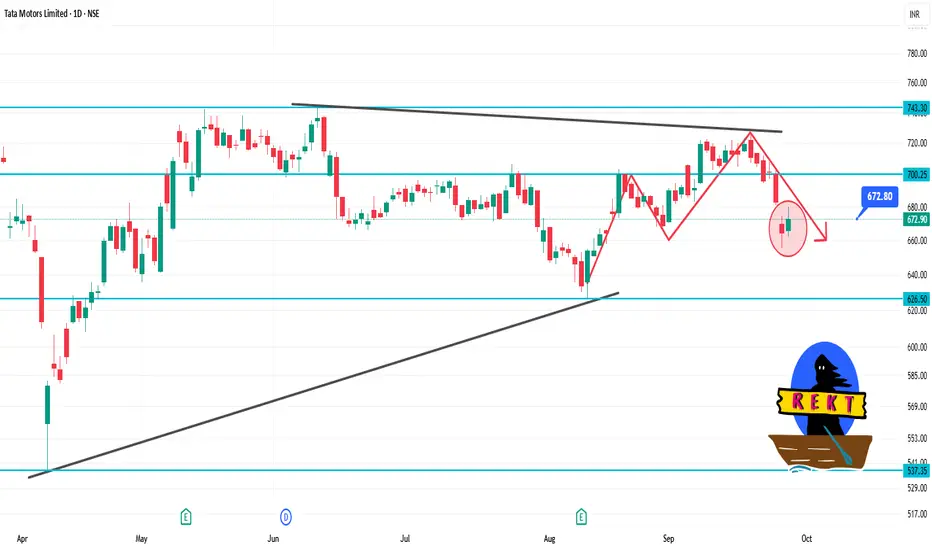
TATAMOTORS 1D Time frameCurrent Price: ₹673.00
Day's Range: ₹662.35 – ₹680.35
Previous Close: ₹664.30
Volume: 15,780,434 shares traded
Market Cap: ₹247,780 crore
52-Week High: ₹1,000.40
52-Week Low: ₹535.75
Face Value: ₹2.00
Beta: 1.30
🧾 Financial Highlights
P/E Ratio (TTM): 11.69
P/B Ratio: 0.00
EPS (TTM): ₹57.54
Dividend Yield: 0.89%
ROE: 28.1%
Book Value: ₹315
📈 Technical Insights
Trend: The stock has shown resilience with strong long-term performance over three years, despite recent challenges compared to the Sensex.
Support Levels: ₹662.35, ₹650.00
Resistance Levels: ₹680.35, ₹700.00
📌 Key Takeaways
Recent Performance: Tata Motors' shares rose over 2% today, snapping a two-day decline, following the announcement that Jaguar Land Rover (JLR) had commenced a phased restart of its operations after a cyberattack.
Analyst Sentiment: Despite recent volatility, Tata Motors remains a top pick among analysts for long-term investment.
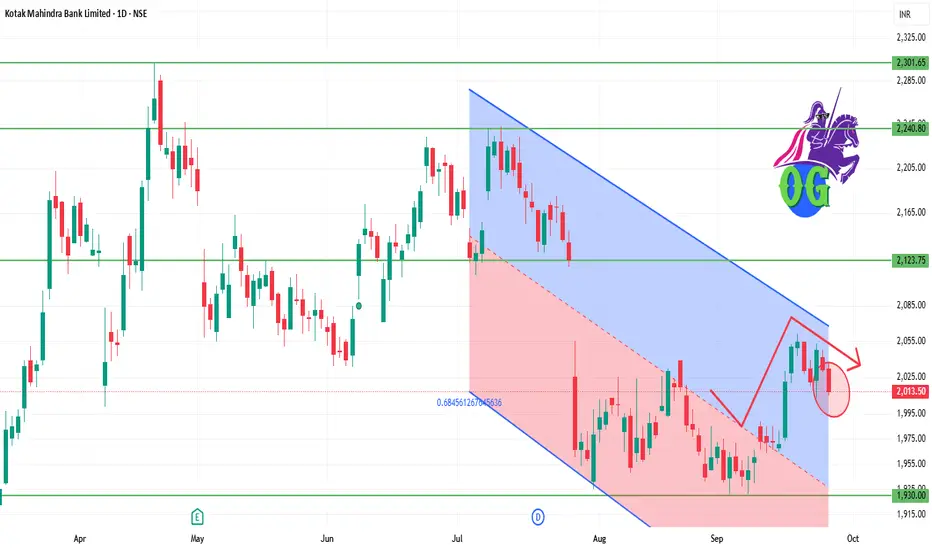
KOTAKBANK 1D Time frame📊 Daily Snapshot
Closing Price: ₹2,013.60
Day’s Range: ₹2,012.50 – ₹2,031.30
Previous Close: ₹2,031.30
Change: Down –0.72%
52-Week Range: ₹1,679.00 – ₹2,302.00
Market Cap: ₹4.04 lakh crore
P/E Ratio: 21.09
Dividend Yield: 0.12%
EPS (TTM): ₹96.30
Beta: 0.80 (indicating lower volatility)
🔑 Key Technical Levels
Immediate Support: ₹2,000.00
Immediate Resistance: ₹2,030.00
All-Time High: ₹2,302.00
📈 Technical Indicators
RSI (14-day): 45.2 – indicating a neutral condition.
MACD: Negative, suggesting bearish momentum.
Moving Averages: Trading below the 50-day and 200-day moving averages, indicating a bearish trend.
📉 Market Sentiment
Recent Performance: Kotak Mahindra Bank's stock declined by 0.72% on September 25, 2025, underperforming the broader market.
Volume: Trading volume was significantly lower than its 50-day average, indicating decreased investor activity.
📈 Strategy (1D Timeframe)
1. Bullish Scenario
Entry: Above ₹2,030.00
Stop-Loss: ₹2,000.00
Target: ₹2,050.00 → ₹2,070.00
2. Bearish Scenario
Entry: Below ₹2,000.00
Stop-Loss: ₹2,030.00
Target: ₹1,980.00 → ₹1,960.00
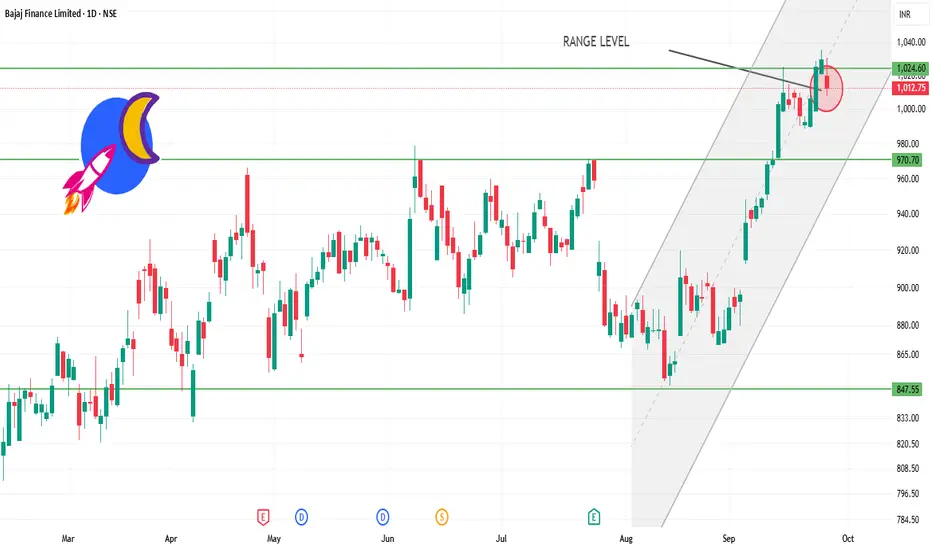
BAJFINANCE 1D time frame📊 Daily Snapshot
Closing Price: ₹1,012.75
Day’s Range: ₹1,008.00 – ₹1,031.10
Previous Close: ₹1,029.75
Change: Down –1.66%
52‑Week Range: ₹645.10 – ₹1,036.00
Market Cap: ₹6.31 lakh crore
P/E Ratio: 36.2
Dividend Yield: 2.76%
EPS (TTM): ₹28.04
Beta: 1.14 (indicating moderate volatility)
🔑 Key Technical Levels
Support Zone: ₹1,008.00 – ₹1,015.00
Resistance Zone: ₹1,031.00 – ₹1,036.00
All-Time High: ₹1,036.00
📈 Technical Indicators
RSI (14-day): 42.88 – approaching oversold territory, suggesting potential for a rebound.
MACD: Positive at 2.46, indicating bullish momentum.
Moving Averages: Trading above the 50-day and 200-day moving averages, indicating an overall uptrend.
📉 Market Sentiment
Recent Performance: Bajaj Finance experienced a decline of 1.66% on September 25, 2025, underperforming the broader market.
Volume: Trading volume was significantly higher than its 50-day average, indicating increased investor activity.
📈 Strategy (1D Timeframe)
1. Bullish Scenario
Entry: Above ₹1,031.00
Stop-Loss: ₹1,008.00
Target: ₹1,045.00 → ₹1,050.00
2. Bearish Scenario
Entry: Below ₹1,008.00
Stop-Loss: ₹1,015.00
Target: ₹995.00 → ₹990.00
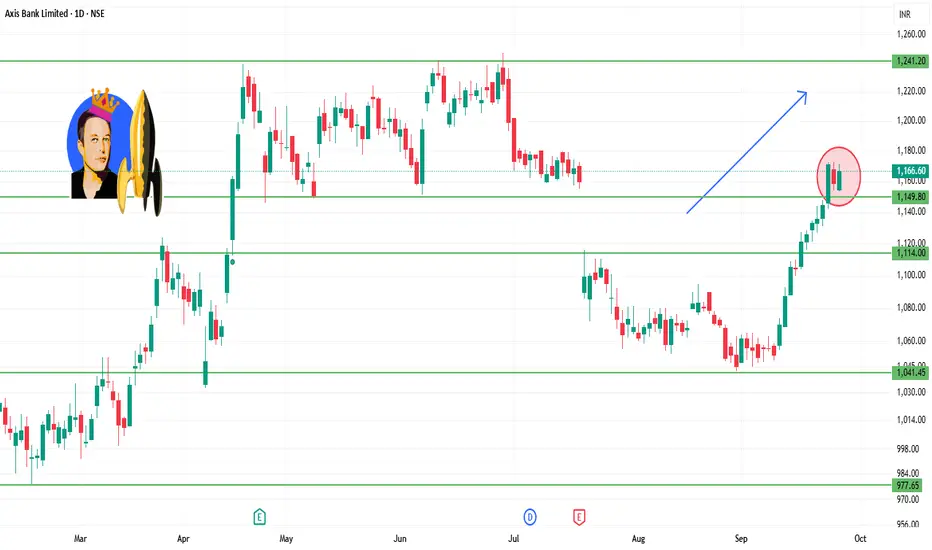
AXISBANK 1D Time frame📊 Daily Snapshot
Closing Price: ₹1,166.10
Day’s Range: ₹1,153.40 – ₹1,171.80
Previous Close: ₹1,158.80
Change: Up +0.28%
52-Week Range: ₹933.50 – ₹1,281.65
Market Cap: ₹3.59 lakh crore
P/E Ratio: 12.9
Dividend Yield: 1.2%
EPS (TTM): ₹90.00
Beta: 1.1 (moderate volatility)
🔑 Key Technical Levels
Immediate Support: ₹1,153.33
Immediate Resistance: ₹1,153.33
Weekly Outlook: Immediate support at ₹1,109.23; major support at ₹1,082.57; immediate resistance at ₹1,153.33; major resistance at ₹1,170.77.
📈 Analyst Insights
Intrinsic Value: Estimated at ₹1,511.77 based on median valuation models, suggesting the stock is trading below its fair value.
📈 Strategy (1D Timeframe)
1. Bullish Scenario
Entry: Above ₹1,153.33
Stop-Loss: ₹1,109.23
Target: ₹1,170.77 → ₹1,200.00
2. Bearish Scenario
Entry: Below ₹1,109.23
Stop-Loss: ₹1,153.33
Target: ₹1,082.57 → ₹1,050.00
SENSEX 1D Time frame📊 Today’s Sensex Performance
Closing Level: ~ 81,715.63
Point Change: ~ –386.47
% Change: ~ –0.47%
The market has been weak lately; today extends losses.
Broad weakness across sectors, with IT & financials under pressure.
🎯 Key Support & Resistance Levels
Support Zone: ~ 81,550 to 81,400
Strong Support: ~ 81,200
Resistance Zone: ~ 82,000 to 82,150
If Sensex rises above 82,150 and holds, bullish bias may resume.
But if it breaks below 81,400 with strength, further downside possible.
📝 Strategy Ideas for Next Trading Day(s)
Bearish Setup (if weakness continues)
Short when Sensex rallies into resistance (~ 82,000–82,150) and shows reversal candle or weakness.
Stop-loss just above 82,200.
Target toward support zones: 81,400 → 81,200.
Bullish Setup (if rebound happens)
If Sensex finds support near ~ 81,400–81,550 and bounces with strength, go long.
Stop-loss below 81,300.
Target toward 82,000 → 82,150.
Range / Intraday Play
Trade between 81,400 (support) and 82,100 (resistance) as range, until a decisive breakout occurs.
Keep tight stop-losses, take small profits.

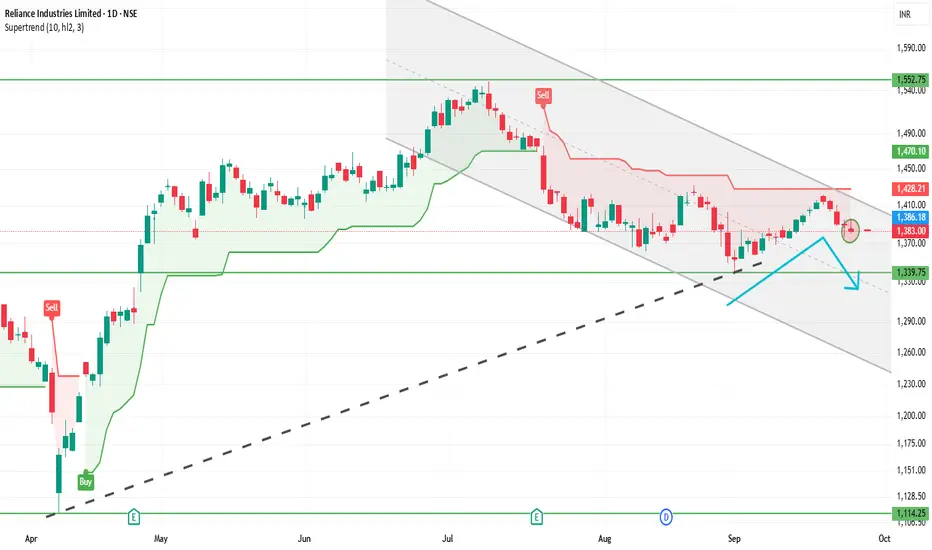
RELIANCE 1D Time frame📊 Reliance Daily (1D) Snapshot
Close: Around ₹1,382
Range of the Day: High near ₹1,396, Low near ₹1,380
Trend: Slight weakness on daily chart (mild red candle)
Stock is consolidating between support and resistance zones.
🎯 Key Daily Levels
Support Zone: ₹1,350 – ₹1,365
Strong Support: ₹1,330
Resistance Zone: ₹1,405 – ₹1,425
Strong Resistance: ₹1,430
📝 Strategy on 1D Chart
Bearish View
If price goes near ₹1,405 – ₹1,425 and fails to sustain, you can short.
Entry: ₹1,410 approx
Stop-loss: ₹1,430
Target: ₹1,365 → ₹1,350
Bullish View
If Reliance holds above ₹1,350 and shows reversal, you can buy.
Entry: ₹1,360 – ₹1,365 zone
Stop-loss: ₹1,330
Target: ₹1,405 → ₹1,425
Breakout Trade
If it closes above ₹1,430 with strong candle, expect momentum upside.
Target: ₹1,460+
Breakdown Trade
If it closes below ₹1,330, selling pressure can push it to ₹1,300 or lower.
DLF 1D Time frame📍 Today’s Expected Range (Intraday Approximation)
Expected High: ₹767–₹775
Expected Low: ₹756–₹750
These are approximate intraday levels. Actual prices may fluctuate slightly due to market volatility.
🔍 Key Points
Current price: ₹760–₹761, trading near the middle of the day’s range.
If price breaks above ₹767–₹775 with strong volume → bullish momentum likely.
If price falls below ₹756–₹750 → short-term correction or pullback possible.
📊 Suggested Trading Strategy
Bullish Scenario
If DLF breaks ₹767–₹775, you can buy, targeting ₹780–₹785.
Stop-loss: ₹755
Bearish Scenario
If DLF drops below ₹756–₹750, you can sell/short, targeting ₹740–₹735.
Stop-loss: ₹760
Range-Bound / Sideways
If price trades between ₹756–₹767, it’s better to wait and avoid trading until a clear breakout occurs.
💡 Summary
Resistance Zone: ₹767–₹775
Support Zone: ₹750–₹756
Strategy: Trade in the direction of the breakout, and always use stop-loss to manage risk.
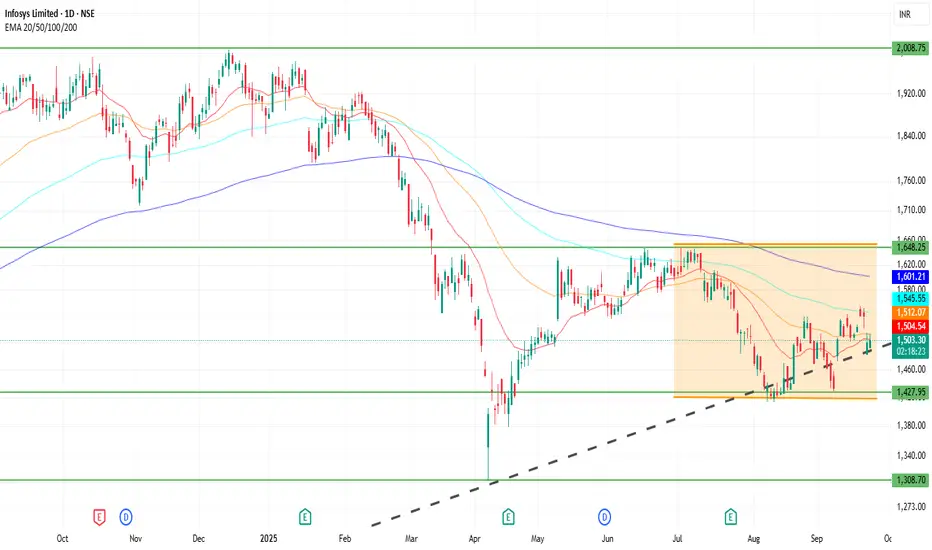
INFY 1D Time frame📍 Current Price & Range
Current Price: ₹1,503.00
Day’s High / Low: ₹1,540.20 / ₹1,499.50
52-week High / Low: ₹2,006.45 / ₹1,307.00
🔍 Key Levels
Immediate Resistance: ₹1,540–₹1,550
Next Resistance: ₹1,600
Immediate Support: ₹1,450–₹1,460
Strong Support: ₹1,400
📊 Indicators & Momentum
Short-term Trend: Neutral to slightly bearish; recent price action shows hesitation near resistance levels.
Volume: Higher-than-average trading volume observed, indicating increased investor interest.
Relative Strength Index (RSI): Approaching overbought territory; caution advised for potential pullbacks.
Moving Averages: Price trading below key moving averages; may act as resistance if price approaches them.
🔮 Possible Scenarios
Bullish Breakout: If INFY sustains above ₹1,550 with strong volume, it could target ₹1,600 and higher levels.
Sideways Consolidation: Price may trade between ₹1,450 and ₹1,550, awaiting a catalyst for direction.
Bearish Reversal: A drop below ₹1,450 could lead to a retest of the 52-week low around ₹1,307.
⚠️ Outlook
At the current level of ₹1,503.00, Infosys is at a critical juncture. A decisive move above ₹1,550 could open up upside potential, while a failure to hold above ₹1,450 may lead to further downside. Monitoring volume and RSI for confirmation is recommended.
HDFCBANK 1D Time frame📍 Current Price & Range
Current price: ₹964.20
Day’s High / Low: ₹968.20 / ₹955.50
52-week High / Low: ₹1,018.85 / ₹806.50
🔍 Key Levels (with current context)
Immediate support: ₹955-₹958
Stronger support: ₹945-₹950
Immediate resistance: ₹970-₹975
Next resistance: ₹980-₹985
Major psychological resistance: ₹1,000+
📊 Indicators & Momentum
Price is near resistance zone (₹964-₹967), showing hesitation.
Holding above ₹955 is important for stability.
Price is below the 50-day moving average → short-term weakness.
Still above the 200-day moving average → long-term structure remains intact.
RSI around 40-45 → momentum is neutral to slightly weak.
🔮 Possible Scenarios
Bullish breakout: Above ₹975-₹980 with volume → upside toward ₹1,000–₹1,018.
Sideways: Between ₹955–₹975 until a decisive breakout.
Bearish pullback: Below ₹955 → could slide toward ₹945-₹950 or even ₹940.
👉 Outlook: At the current level (₹964), the stock is sitting close to resistance. It needs strength above ₹975 to turn bullish; otherwise, it risks drifting back toward ₹955 support.

HDFCBANK 1D Time frame📊 Current Snapshot
Current Price: Around ₹967
Day Range: ₹962 – ₹976
52‑Week Range: High ~ ₹1,018, Low ~ ₹805
Volume: Slightly above recent average, showing decent trading interest
🔍 Support & Resistance
Immediate Resistance: ₹975 – ₹983
Higher Resistance: ₹989 – ₹990
Immediate Support: ₹960 – ₹954
Lower Support: ₹946
⚙️ Indicators & Trend
RSI / Stochastic: Neutral to slightly bearish, indicating mild selling pressure
Pivot Level: Around ₹968 – ₹969, meaning price is near equilibrium
Moving Averages: Mixed signals; short-term MAs under slight pressure, long-term trend still intact
🎯 Possible Scenarios
Bullish Case: Break and sustain above ₹980 → next target ₹990+
Bearish Case: Fail at resistance → pullback toward ₹960‑₹954; below ₹954 → possible drop to ₹946
⚠️ Key Points
Resistance zones are tight and need strong volume for a breakout
Price near pivot levels may lead to short-term sideways movement or volatility
Confirmation from trading volume is important for trend sustainability