DMART

DMART given breakout already can hold for long termDMART given breakout already can hold for long term RSI also positive


DMART ALART PRICE DROPI know it looks complicated but the viewers need to understand. I will try to explain at my best
(A) is showing bearish bump and run trend reversal pattern
(B) is showing bullish price channel continuation
(C) is showing bullish inverted head and shoulder trend reversal pattern
(D) is showing target price (Target 1)
As I went through ideas a lot are talking about head and shoulder and it shows uptrend will start now but
If you observe (A) it's creating a bearish bump and run trend reversal pattern in which the thick line shows the possibility up to which rates can go and the rectangle shows the supports
If you observe (B) it's showing bullish price channel continuation according to which the price has to move in bullish if it crosses the upper price channel line and the target is up to rectangle (D)
If you observe (C) it's showing a bullish inverted head and shoulder trend reversal pattern which is created inside price channel pattern but both price channel, head and shoulder are showing the same target area of (D)
Now what I'm saying is on 14/05/2020 earnings are expected to release, and the strong (A) bump and run is pulling down the rates. If it happens so then the head and shoulder will not work and the price will fall taking support at (A) rectangles and it will bounce back. when it crosses the price channel (B) upper band you can buy expecting the target price of (D)
So don't go with head and shoulder wait for the price to cross price channel upper band then with confirmation and bit of your studies buy
Any doubts or suggestion ping me

#JUBLINDS #JUBLingrea #JUBLfood #JUBLpharma #FMCG #NIFTY #BANK#JUBLINDS
CMP 221.45
Target: 256 // 283 // 308 ++
NSE:JUBLINDS
If you like my work, KINDLY LIKE, SHARE, & FOLLOW THIS PAGE for latest stock recommendations for free.
Might blast to more than 308++
Super Bullish on this stock.
From Rachit Sethia with 💚
JLong

DmartDmart - Cmp 2802
Can long at cmp with sl 2600 on closing basis.
Reason:
1. Morning star candle forming at the base of the downtrend near support area.
2. Positive divergence.

DMART : Last opportunity to go for long!DMART is looking for great buying opportunity to take the move to the upside & has the high probability to reach at 3600.

DMART : Looking for long opportunity!DMART is looking for great buying opportunity & to make some decent amount of profit.

Short Dmart Short Dmart Stoploss 2935 target 2630
Study: Breadown from Trend Continuation Pattern (Flag Pattern)

AVENUE SUPERMARTS3228 RESISTANCE LEVEL.
2735 STOP LOSS based on SUPPORT LINE.
2800 STOP LOSS based on 200EMA LINE.
.
TECHNICALLY its BULLISH view because of trading above 200EMS on 4Hrs timeframe. Since 19th OCT 2020.
FUNDAMENTALLY not recommended for Long term holding because now P/E ratio is 193.30 below (24 P/E) safe. So it's a highly expensive stock for long-term investors.

DmartDmart trend, also you can see on two occasions stock has formed similar pattern highlighted by black curves. Interesting movement indeed.

DMART is ready for ATHDmart chart is looking good, it is trying to break ATH for 5th time. It might breakout this time before next result season.

Swing Trade Idea #231 : Long on DMART This is a public swing trade idea and is only for Learning and observational purpose. Please understand your risk and take full responsibility of your actions. We would comment on any further updates on our entry, targets and stop-loss on this idea, so make sure to follow it if you want to get further updates. Our objective to help anyone who wants to learn technical analysis using charts. You can post your queries in comment section here and we will try to answer asap.

Is DMART retracing towards its support line?It showed a great breakout from the indicated trendline. Is it retracing all the way back to the same trendline?
Keep this on radar to re-enter for long term view.
Please like and follow.

DMART: BUY/SELL algo DemonstrationHOW TO FOLLOW ALGO SIGNAL:
Deciding buy/sell
1.Strictly use only on 1 hour time frame.
2.Wait for a ‘X’ sign before mind make up. A red ‘X’ means look for selling opportunity , a green ‘X’ means look for buying opportunity.
Taking a position:
3.Wait for an arrow before entering into any position. A red arrow on upside of a bar pointing downward means open short position. A green arrow below the bar pointing upward means open buy position.
4.NOTE: Only after the the signalling of X , look for arrow. Do not buy/sell if you see any arrow before the signal of X.
5.STOP LOSS should be the most recent swing high/low or most recent STRONG CANDLE’S high/low.
While maintaining the position :
6.The small triangles after the each bar completion tells you to hold the position. The red triangles appearing upside on the bar tells you to hold the short position, whereas the green triangles appearing below the bars tells you to hold the long position.
Exiting the position:
7.After you create a buy position , if you see a green arrow above any bar pointing downward, then you should either book partially/leave the position for sometime. You will get another signal to re-enter.
8.Similarly, after you create a sell position , if you see a red arrow below any bar pointing upward, then you should either book partially/leave the position for sometime. You will get another signal to re-enter.
9.While being in position if you see any X signal which is opposite of your trade , then leave your position immediately.
10.When you see a big red circle dot then you must exit all your short positions. Contrary , when you see a big green circle dot , you must exit all your long positions. And then wait for a X-signal.
No Trading Zone:
11.When you get frequent X-signals in green-red-green-red & that too very close, then its means that stock is going to form a range. One should wait for the range break & move away to another stock. (THIS IS WHERE YOU WILL REQUIRE A PRACTICE TO IDENTIFY THE RANGE)


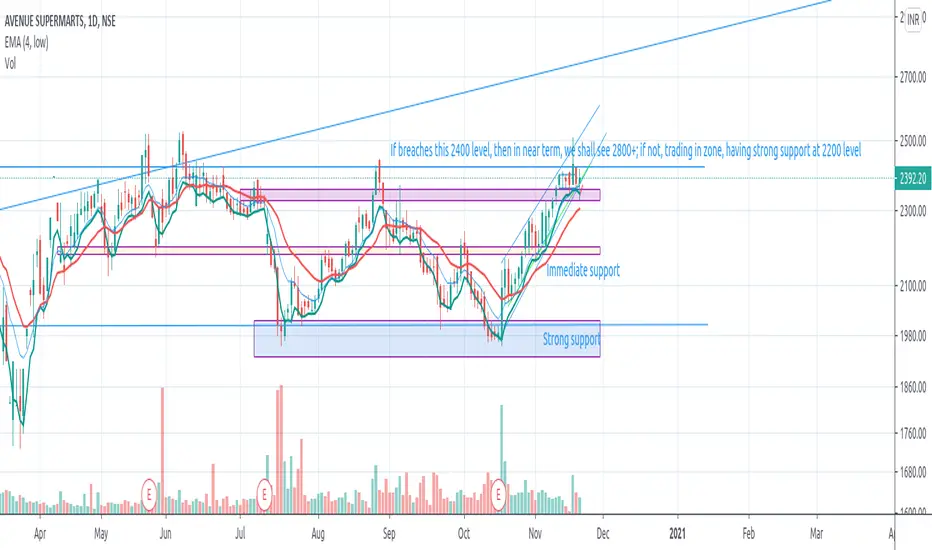
DMART_In ZoneIf breaches 2400, then 2800+ level is possible (if not, moving in zone)
near support at 2200
strong support at 2000
Only educational purpose
Watchlist Update: Dmart ascending triangle probable breakout.-Look out for Volume when breaking out!
-There are two separate possibilities of trade represented by two arrows after breakout at 2700.
-Target is set through ATR.
-Risk Reward is 3.078
-Happy Trading :)


Strongest stock - DMART (Rejection day)Buy At 2588-2600 range for an excellent entry.
SL - Exit if stock close below 2580, since it will definetely test the low's of the rejection candle.
Reason for the trade: Rejection day
Rejection Days have a range that is significantly larger than the 10-day average and The ideal swing entry is the Rejection Day midpoint,which can be defended for 1-4 days after the rejection.
Exit when : A daily close below the Rejection Day midpoint breaks the pattern, as this would indicate a retest of the Rejection Day low
Disclaimer : Author may enter in trade so take your own decision. This is an trading idea not an trading or Investment advice.


