DMART - Descending Channel💹 Avenue Supermarts Ltd (NSE: DMART)
Sector: Retail | CMP: 3841.6
View: Reaction from Higher-Timeframe Demand | Early Momentum Recovery
Chart Pattern: Descending Channel (Corrective)
Candlestick Pattern: Strong Bullish Marubozu
________________________________________
Price Action
DMART has spent the last few months in a controlled corrective decline after a prior uptrend, respecting a well-defined descending channel marked by lower highs. Price recently reacted sharply from a higher-timeframe demand base in the 3600 region, printing a decisive bullish expansion candle and closing near the session high. This move signals a shift from passive correction to active demand emergence, with sellers losing near-term control at lower levels. While the broader structure is still recovering and overhead resistance remains intact, the latest price behaviour reflects an early change in character rather than a weak bounce.
________________________________________
Technical Analysis (Chart Readings)
Technically, the chart shows improving alignment after prolonged consolidation. The bullish Marubozu indicates strong buyer dominance with minimal intraday supply. This expansion follows a compression phase, suggesting a short-term volatility release. Momentum indicators remain constructive but not euphoric — RSI around 51 reflects healthy recovery without exhaustion, while price reclaiming short-term averages points to stabilisation above demand. Volume participation is meaningfully above recent averages, confirming that the move is supported by participation rather than thin liquidity. Overall, the technical setup reflects a recovery phase with improving momentum but still within a broader corrective framework.
________________________________________
Key Levels (Chart Readings)
On the downside, a strong structural support zone lies in the 3600–3500 region, which has repeatedly absorbed selling pressure and now acts as the primary downside reference. Intermediate supports around 3719 and 3596 provide near-term cushions during pullbacks. On the upside, immediate resistance is visible near 3907–3972, followed by stronger overhead supply near 4095 and above, where prior distribution has occurred. Price is currently positioned between demand and resistance, making acceptance above these levels critical for sustained upside continuation.
________________________________________
Demand & Supply Zones (Chart Readings)
The demand–supply framework offers clear structure across timeframes. On the Daily timeframe, a major demand zone is established between 3680–3605, forming the broader base for the current recovery attempt, while a higher-timeframe supply zone remains active near 4111–4222. On the Swing timeframe, demand is concentrated around 3680–3605, with swing supply visible near 4173–4222. Intraday demand zones are clustered near 3769–3747 and 3743–3720, highlighting immediate buying interest, while short-term supply remains active near 3668–3658 on pullbacks. These zones frame the current recovery phase, with price rotating upward from demand into nearby supply.
________________________________________
STWP Trade Analysis
DMART has initiated a momentum recovery from a higher-timeframe demand base, supported by rising volume and improving price stability. From an intraday perspective, holding above the 3800–3850 zone keeps the bullish bias intact and allows scope for continuation toward upper resistance levels if participation sustains. From a short-term swing (hybrid) standpoint, the same structure supports a broader mean-expansion framework over the next few sessions, provided price does not slip back into the prior demand range. While the trend bias is turning upward, the presence of overhead supply and elevated volatility warrants disciplined execution, controlled position sizing, and strict respect for structural invalidation levels.
________________________________________
Final Outlook
Momentum: Strong
Trend: Up
Risk: High
Volume: High
The structure favours further recovery as long as price sustains above demand zones, but confirmation through acceptance above overhead supply is essential for trend acceleration. This phase rewards structure awareness, patience, and risk discipline over prediction.
Dmartanalysis

DMART – A Clean Case Study in Patience & Price Action________________________________________
Ticker: NSE: DMART
Sector: Retail – Supermarkets & Hypermarkets
Market Cap: ≈ ₹2.78 lakh crore (approx as of July 30, 2025)
Current Price: ₹4,281.40 (up ~7% on July 30, 2025)
Technical Rating: ⭐⭐⭐⭐⭐
________________________________________
📢 DMart (Avenue Supermarts) Update – July 30, 2025:
If you’re a new investor tracking India’s retail space, DMart just gave us a masterclass in how market sentiment can flip fast — and why fundamentals still matter.
In its Q1 FY26 results, DMart reported a modest 2% profit growth (₹830 cr), despite a solid 16% jump in revenue. This raised concerns among analysts about tight margins and intensifying competition, especially from fast-moving consumer goods (FMCG) and quick-commerce players. Not surprisingly, the stock dipped around 2.6% post-results.
But fast-forward to late July, and the narrative flipped.
On July 30, DMart shares surged 7–8% intraday, marking their biggest rally since March, after announcing the opening of its 426th store and laying out a bold expansion plan. The market cheered the company’s strong growth visibility and confidence in its value-retail model. CEO Neville Noronha emphasized the importance of store additions, digital scaling via DMart Ready, and the company’s resilience in a competitive landscape.
On the digital front, online grocery sales grew 21% YoY to ₹3,502 cr in FY25 — a good sign of consumer shift — though losses widened as DMart expanded into new cities.
What’s the takeaway? For learners, this is a great example of how stocks don’t move just on earnings, but on future guidance, strategy, and investor confidence. DMart may not have wowed with profits this quarter, but its long-term vision still packs a punch.
________________________________________
📉 Technical Analysis | Chart Pattern: Potential Breakout Brewing:
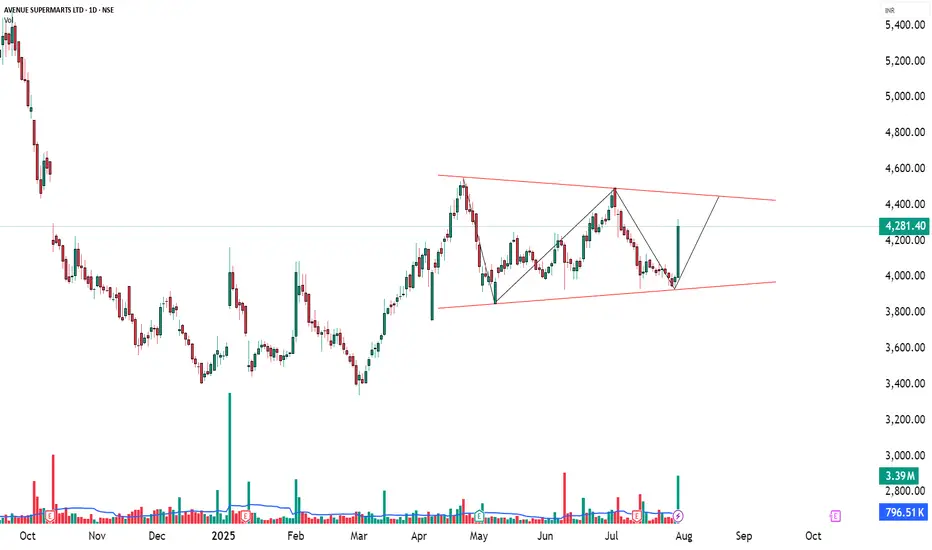
DMART has been consolidating in a symmetrical triangle pattern on the daily chart since April 2025 — a classic setup that often signals a big move ahead. On July 30, the stock showed signs of life with a strong 7% gain and a 5× volume spike, which usually reflects institutional accumulation and rising trader interest.
🔍 But here’s the key insight:
Despite the surge in volume, the price has not yet convincingly broken above the triangle’s upper trendline. This means there’s no valid price breakout yet — only a volume-based alert. For newer traders, this is a great example of why volume alone isn't enough. A true breakout needs a strong candle closing above the pattern, preferably with follow-through buying.
________________________________________
🔼 Key Resistance Levels to Watch:
₹4,403 – Recent swing high and immediate target if breakout confirms
₹4,526 – April top and near-term bullish milestone
₹4,728 – Long-term resistance if momentum builds up post-breakout
🔽 Important Support Levels:
₹4,078 – Breakout support zone and first pullback entry area
₹3,876 – Base of the triangle, also a structural support
₹3,753 – Deeper support, invalidation point if breached
________________________________________
🧭 Strategy Insight for New Traders:
This is a textbook case of a "breakout watchlist" setup. With strong bullish indicators — RSI > 60, MACD crossover, Supertrend flip, and a BB Squeeze breakout setup — the chart is preparing for a move. But confirmation is key.
✅ Wait for a clear breakout above the trendline with sustained volume
✅ Avoid chasing the move too early — breakout traps are common
✅ If the breakout confirms, ₹4,403 and ₹4,526 become logical targets
✅ A retest toward ₹4,080 could offer a low-risk long entry if supported by volume
________________________________________
🧠 Pro Note for Beginners: A breakout isn’t just about price jumping — it’s about structure, confirmation, and follow-through. Think of volume spikes as the "whispers" before the market makes a bold statement.
________________________________________
🔍 Fundamental Analysis:
If you’re just starting out in stock market investing, DMART offers an interesting case study—a well-run retail company with strong fundamentals and a clear growth story. As of July 2025, DMART has shown solid performance, especially in revenue growth, while keeping debt levels incredibly low.
In Q1 FY26, the company posted standalone revenues of ₹15,932 crore—up 16.2% YoY—highlighting strong consumer demand and steady growth momentum. Over the full FY25, consolidated revenue rose nearly 17% YoY, reflecting DMART’s consistent top-line performance. However, while revenues are rising fast, margins have seen slight compression. PAT (net profit) for FY25 stood at ₹2,707 crore with a PAT margin of 4.6%, down from 5% a year earlier.
DMART’s earnings per share (EPS) is growing steadily too—₹41.61 in FY25, up ~7% from last year. But with a price-to-earnings (P/E) ratio of ~96x, the stock trades at a steep premium compared to peers, signaling that the market has high expectations for its future growth.
One of DMART’s biggest strengths is its minimal debt—the company operates with almost zero leverage, giving it exceptional financial flexibility. It also generates healthy free cash flows from its core retail operations, though its online grocery venture (DMart Ready) is still in the investment phase, posting losses as it expands.
From a valuation standpoint, DMART is expensive, no doubt. But investors are paying for its scalability, low-risk model, and disciplined management. With 415 stores across India and consistent quarterly additions, the company continues to grow organically while maintaining a lean balance sheet.
🔔 Bottom Line for Beginners: DMART is a financially strong and well-managed company with proven business fundamentals. But with a very high valuation and slowing profit growth, new investors should be cautious. It may be wise to watch for better entry points or wait for earnings to catch up with the price. For long-term investors with patience and a high-quality bias, it could still be a worthy contender—especially if margins and digital growth improve.
________________________________________
📈 DMART Chart Study – Educational Swing Trade Example:
Disclaimer: This is an educational post intended to help new traders understand breakout setups. This is not a recommendation to buy, sell, or hold any stock or security. Always consult your registered financial advisor before making any trading decisions.
If you're learning how swing trades work, this DMART daily chart setup from July 30, 2025, offers a great example of how price action, volume, and key levels can come together. It’s a practical case study to understand the breakout trading concept.
________________________________________
🛠️ Trade Structure (For Educational Purposes)
Reference Entry Price: ₹4,324.00
Reference Stop Loss: ₹3,925.85
Risk-Reward Scenario: Approx. 1:1, with potential extension to 1:2+ (based on hypothetical higher target)
________________________________________
🔍 Key Chart Observations:
✅ Breakout Candle Formation: A strong bullish candle closed near its high — a typical sign of price strength.
✅ Volume Confirmation: Volume surged to 3.39 million shares, which is over 4× the daily average — often seen in breakout moves.
✅ Price Range Context:
• Support/Base Zone: Around ₹3,340
• Initial Target Zone: ₹4,557.70
________________________________________
📘 Educational Insights:
🔴 Risk-Reward Perspective: At the observed entry level, the risk-to-reward ratio was near 1:1 — not ideal for most strategies. A more efficient trade setup might occur on a pullback or with a more distant target.
🔄 Retest Possibility: If the price retraces to ₹4,150–₹4,200 with lower volume, that zone could serve as a reference for learners exploring re-entry setups (purely for study).
🧠 Capital Risk Planning: Risk management is crucial. Avoid risking more than 2–3% of total trading capital on any single idea, no matter how strong the pattern looks.
________________________________________
📌 Beginner Learning Point:
Breakout trading is more than just chasing big candles. A proper breakout setup usually involves volume surge, clear consolidation range, and defined risk management. Learning to combine these elements is key to developing trading discipline.
________________________________________
🧾 Why I’m Watching DMART — A STWP Perspective for Beginner Investors:
One of the best lessons I’ve learned in my investing journey is this: It’s better to buy a great business at a fair price than a fair business at a great price. And when I look at DMART (Avenue Supermarts Ltd.), I see the foundation of a truly great business — even if the price isn’t quite right just yet.
________________________________________
🛒 A Business Anyone Can Understand:
DMART isn’t chasing trends or building flashy tech. It’s focused on something much simpler — and far more reliable: selling everyday essentials. Groceries, home goods, basics — the things people need no matter what. And they do it efficiently, consistently, and affordably. That simplicity, when executed well, is a major strength.
________________________________________
🧱 A Strong, Repeatable Model:
What really impresses me is their cost discipline. DMART owns many of its stores, keeping rental costs low. They avoid unnecessary frills and instead focus on efficiency and tight operations. The result? A cost advantage that’s tough for others to beat. Even though retail has thin margins, DMART’s model is scalable, profitable, and built for the long haul.
________________________________________
👨💼 Led by a Trusted Name:
The company is backed by Radhakishan Damani — a man known for his patience, clarity, and capital discipline. He’s not in a rush to make headlines. He’s building something durable. And when you find great leadership combined with a focused business model, that’s a rare combo worth watching.
________________________________________
📉 Why This Stock Is on My Watchlist?
In one word: Valuation.
DMART often trades at 80–100 times earnings — which is expensive, even for a wonderful business. As an investor, I’d rather wait for a better deal than rush in and overpay. Great businesses can still turn into poor investments if you don’t get the price right. So for now, I’m staying patient.
________________________________________
📈 If the Price Comes Down…
If the market turns pessimistic or earnings grow into the valuation, DMART will be high on my buy list. Here’s why:
✅ A clean, debt-light balance sheet
✅ A brand people trust
✅ A scalable, cost-efficient model
✅ A long growth runway in India’s retail sector
✅ And thoughtful, no-drama leadership
________________________________________
🪙 Final Thought for New Investors:
As Warren Buffett says, “Time is the friend of the wonderful company and the enemy of the mediocre.”
DMART, in my view, is a wonderful company. I’d love to own it — but only when the price is right. Until then, I’ll keep watching, learning, and staying patient.
(Of course, one could consider buying a small quantity now and adding more on dips — a strategy that balances quality with prudence.)
________________________________________
⚠️ Disclaimer (Please Read Carefully):
This content is shared strictly for educational and research purposes only.
I am not a SEBI-registered investment advisor, and no buy or sell recommendations are being made.
All views expressed are based on personal market analysis and experience. They are not intended as financial advice.
Trading — especially in derivatives like options — involves significant financial risk. Losses can exceed your initial investment.
👉 Always do your own research and consult a certified SEBI-registered advisor before making any investment or trading decisions.
👉 Use proper risk management and only trade with capital you can afford to lose.
The author assumes no responsibility or liability for any trading losses incurred from acting on this content.
By engaging with this material, you agree to these terms.
________________________________________
💬 Found this helpful?
Drop your thoughts, questions, or insights in the comments below ⬇️ — let’s learn together!
🔁 Share this post with your trading friends and community — help them discover clean charts, structured setups, and zone-based learning.
✅ Follow @simpletradewithpatience for clear setups, educational content, and a no-nonsense approach to price action, supply-demand zones, and risk-managed trades.
🚀 Trade with patience. Trust your charts. Stay clear-headed.
Because the goal is not just to trade — it's to trade better.
Be Self-Reliant | Trade with Patience | Learn with Charts & Zones 📊
DMART – Mixed Signals with Option Chain Clues________________________________________________________________________________📈 DMART – Mixed Signals with Option Chain Clues | Option Chain + Price Action Analysis
🕒 Chart Type: 15-Minute
📆 Date: July 3, 2025
________________________________________________________________________________
🔍 What’s Catching Our Eye:
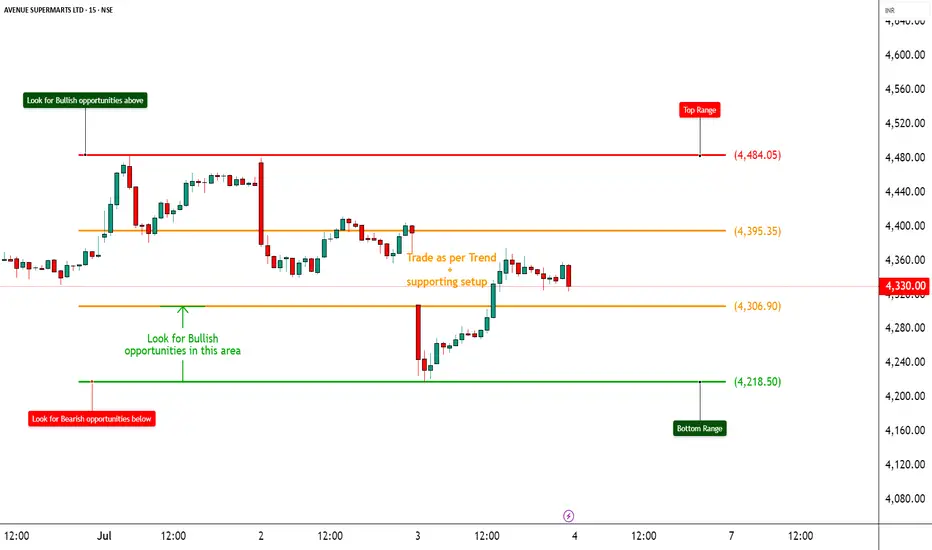
DMART is displaying notable volatility near its technical range. While the option chain reveals contrasting setups across strikes—with several Calls showing short build-ups and some Puts indicating long build-ups—the overall price action remains undecided. The current equity price (spot at 4348.70) is being carefully watched in relation to its normalized chart range.
________________________________________________________________________________
📌 What We’re Watching For:
We’re monitoring for a decisive move beyond the established range. A sustained move above the Top Range of 2464.4 (normalized chart level) could validate a bullish reversal; conversely, a breakdown below the Bottom Range of 2326.1 might trigger a bearish slide. Given the option chain dynamics, any clear directional breakout—supported by volume—will be key to shaping our view.
________________________________________________________________________________
📊 Volume Footprint:
Today’s volume is recorded at 1.83M, significantly higher than the previous 836.47k, indicating an active session. A continued high volume reading on a breakout or breakdown from our range will be critical for confirmation.
________________________________________________________________________________
📈 Option Chain Highlights:
• On the Call side, the 4,500 CE and 4,300 CE are showing strong short build-ups, while the 4,400 CE stands out with a long build-up—hinting at an emerging bullish bias if the price rallies. Additionally, the 4,600 CE continues to exhibit short build-up pressure.
• On the Put side, the 4,200 PE displays a strong long build-up, suggesting downside protection, and the 4,000 PE also shows long build-up. A notable short covering is observed in the 4,300 PE and the 4,250 PE shows additional long build-up.
These option-chain cues—combined with the volatility in the underlying—highlight the market’s mixed expectations.
________________________________________________________________________________
🔁 Trend Bias:
The bias remains directionally dependent—bullish if a reversal above the top range is confirmed, or bearish if the price falls below the bottom range.
________________________________________________________________________________
🧠 Trade Logic / Reasoning:
DMART’s price action is teetering near its critical range. The normalized technical levels (Top Range: 2464.4, Bottom Range: 2326.1) serve as key decision zones. On the options side, the presence of long build-up in the 4,400 CE suggests that, if the price reverses, buyers could step in. In contrast, the strong long build-up on the 4,200 PE underlines the protective positions if the price breaks lower. With a higher session volume amplifying the move’s significance, caution is warranted until a clear breakout or breakdown occurs.
________________________________________________________________________________
📍 Important Levels to Mark:
🔺 Top Range: 2464.4 – Look for a breakout or a reversal candlestick pattern with confirmatory volume
🔻 Bottom Range: 2326.1 – Watch for a breakdown or a bullish reversal pattern with volume support
________________________________________________________________________________
🎯 Trade Plan (Educational Purpose Only):
✅ Best Buy (Equity): Enter long on DMART if a robust bullish reversal is confirmed—ideally when the price reclaims above the top range (2464.4) with strong volume and supportive candlestick action.
✅ Best Sell (Equity): Take short positions if the price decisively breaks and holds below the bottom range (2326.1) on high volume.
✅ Best CE to Long: Opt for the 4,400 CE when the reversal is underway; its long build-up in the option chain signals the initiation of bullish interest.
✅ Best PE to Long: In a bearish scenario, consider the 4,200 PE—its long build-up indicates traders are positioning for a downside move.
🟢 Demand Zone: NA
🔴 Supply Zone: NA
⚠️ Invalidation Below:
Any bullish setup becomes invalid if DMART breaks and holds below the bottom range of 2326.1 (normalized level) with strong volume.
________________________________________________________________________________
⚠️ Disclaimer:
This post is for educational purposes only.
STWP is not a SEBI-registered advisor.
This is not a buy/sell recommendation.
Please consult your financial advisor before trading.
STWP is not responsible for any trading outcomes.
________________________________________________________________________________
💬 Found this helpful?
Drop your thoughts in the comments ⬇️
🔁 Share with fellow traders
✅ Follow STWP for zone-based price action & option chain insights
🚀 Let’s boost awareness of smart & patient trading!
________________________________________________________________________________
DEMAND ZONE TRADE SETUP📈 AVENUE SUPERMARTS (DMART) – DEMAND ZONE TRADE SETUP
📆 Date: June 5, 2025
🔍 Timeframe: 15-Minute Chart
Chart Overview:
DMART witnessed a sharp breakout supported by rising volume and faced resistance near 4240. After this move, the price is retracing, offering a possible re-entry near a fresh demand zone.
Wait for price action confirmation inside the zone
Volume analysis adds confidence to the reversal
Risk management is key – always use SL
👉 Found this useful? Hit Follow to stay updated with breakout setups, educational content, and trade-ready ideas.
Let's grow smarter, together! 💡📊
Leave your comments/feedback(it will help)

DMART : Wait to leap up the 25-28% quick gainHi friends,
Target & Stoploss are mentioned on the self explanatory chart .
DMART is a large cap & profitable company for quite a long .
Please feel free to comment or share your views on my analysis .
Note : I am not SEBI registered advisor . Please consider my analysis for education purpose only .

Avenue Supermarts Ltd - DMART - Positional TradeDate : 8-May-2024
Rating : Buy - Positional Trade
LTP : Rs. 4,806.75
Targets: (1) Rs. 5,180 --> (2) Rs. 5,900 --> (3) Rs. 7,577
SL : Rs. 4,450 on daily close basis
Technical View:
• NSE:DMART is in its primary uptrend and was going through it's secondary downtrend.
• After breaking out from its 2.5 years long secondary down trend on 19-Mar-2024, NSE:DMART has started the upward journey.
• After making a new 52w high of 4,890 on 23-Apr-2024, it has taken support at 4,450 on 29-Apr-2024 and again started the upward journey on 30-Apr-2024.
• RSI is trading at 65.32 and MACD is trading at 84.74
• Looking strong from here on.
Disclaimer : I am not a SEBI registered analyst/consultant and not recommending anyone to take any BUY or SELL position in stock market. Investing in stock market is risky and one should do a self analysis and validation before investing in stock market. Ideas are published for learning purpose only.

Long opportunity in DMart There is pole and flag pattern break in DMart, looks good for longs above 4340 with stoploss at around 3020 levels for the target of 5600 (there may be some resistance at around 4980 levels) then 6200.
--This is for educational purpose only, do your own analysis before investing and do not put more than 5 to 10% of your capital in one stock.
