Doge
💡Don't miss the great buy opportunity in DOGEUSD @dogecoinTrading suggestion:
". There is a possibility of temporary retracement to the suggested support line (0.2446).
. if so, traders can set orders based on Price Action and expect to reach short-term targets."
Technical analysis:
. DOGEUSD is in a range bound, and the beginning of an uptrend is expected.
. The price is above the 21-Day WEMA, which acts as a dynamic support.
. The RSI is at 69.
Take Profits:
TP1= @ 0.2721
TP2= @ 0.2922
TP3= @ 0.3162
TP4= @ 0.3306
TP5= @ 0.3508
SL= Break below S2
❤️ If you find this helpful and want more FREE forecasts in TradingView
. . . . . Please show your support back,
. . . . . . . . Hit the 👍 LIKE button,
. . . . . . . . . . Drop some feedback below in the comment!
❤️ Your support is very much 🙏 appreciated! ❤️
💎 Want us to help you become a better Forex / Crypto trader ?
Now, It's your turn !
Be sure to leave a comment; let us know how you see this opportunity and forecast.
Trade well, ❤️
ForecastCity English Support Team ❤️
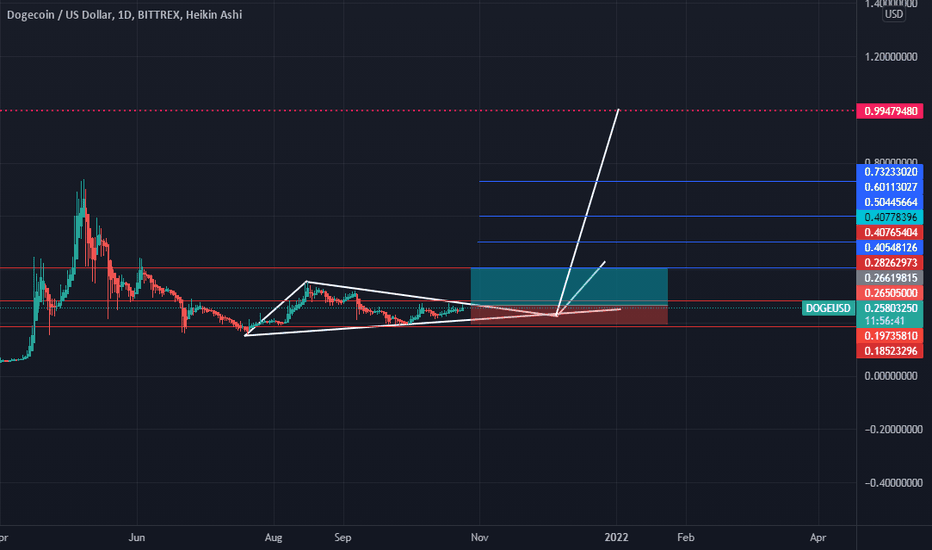
DOGE coin forming a huge triangle! ELON MUSK to tweet again?!I know that the DOGE coin is not good fundamentally, but if we look from TA point of view, this coin is about to give massive returns! The triangle is huge, it might give huge returns. But, on the other hand, never trust meme coins. Invest only that much, which you're ready to lose.
💡Don't miss the great buy opportunity in DOGEUSDTTrading suggestion:
". There is a possibility of temporary retracement to the suggested support line (0.2265).
. if so, traders can set orders based on Price Action and expect to reach short-term targets."
Technical analysis:
. DOGEUSDT is in a range bound, and the beginning of an uptrend is expected.
. The price is above the 21-Day WEMA, which acts as a dynamic support.
. The RSI is at 67.
Take Profits:
TP1= @ 0.2420
TP2= @ 0.2567
TP3= @ 0.2711
TP4= @ 0.2922
TP5= @ 0.3162
SL= Break below S2
❤️ If you find this helpful and want more FREE forecasts in TradingView
. . . . . Please show your support back,
. . . . . . . . Hit the 👍 LIKE button,
. . . . . . . . . . Drop some feedback below in the comment!
❤️ Your support is very much 🙏 appreciated! ❤️
💎 Want us to help you become a better Forex / Crypto trader ?
Now, It's your turn !
Be sure to leave a comment; let us know how you see this opportunity and forecast.
Trade well, ❤️
ForecastCity English Support Team ❤️
This Dogecoin fractal breakout could propel DOGE to $3While it might seem a little far-fetched to imagine a meme token worth $3.43, if the fractal plays out like before, theoretically, DOGE could ascend to 361.8% Fibonacci extension level at $40.91.
Readers are advised to take this double-digit forecast with a grain of salt and remember that the key word is "theoretically."
P.S.
Not Financial Advice
DOGE forming peanut in Daily Chart, Expecting Breakout soon.Peanut is a trend continuation pattern, where the price's upper trend line & bottom trend line forms a peanut shape (as I shown in the picture) and volume needs to be decreasing. Higher chances is to breakout above, but there is always possibility to trade go wrong. #DYOR #NFA
$THETA local resistance 7.9 - 8.5 Theta facing so many resistacne above it and has to break all of it in the upcoming months , it will be a hard time for Theta to do it , local resistance is t 7.9-8.5 , I can't see any clear price discovery happened to theta in the short term after the triangle break , Triangle breakout also lacks volume , be careful before taking a trade too soon
BTC Bull Or Bear The important Levels are here 48-49k is a super strong resistance and the 45-44k is a strong resistance also btc forming a massive rising wedge its a bearish sign so be careful in this zones if daily candle can give a close above the 49k then we can continue the bull run. btc is struggling to break the resistance if once again failed to break above bears will take control


