DOGEUSDT Technical analysisDOGEUSDT Technical analysis
✅ 1. NO-TRADE ZONE
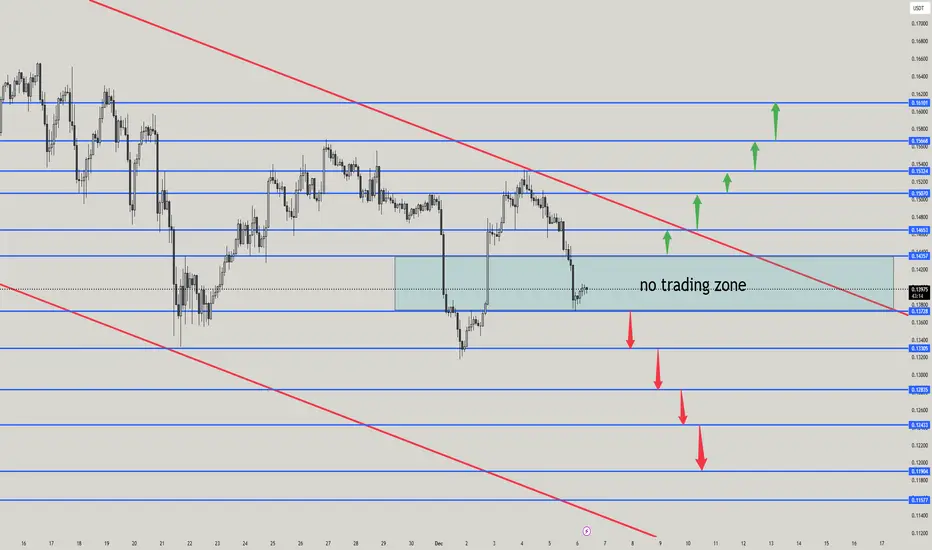
The blue shaded box (≈ 0.1378 – 0.1450) is your No-Trade Zone.
Why No-Trade?
Price is inside a sideways compression zone with no clear trend.
Buyers and sellers are equal → high probability of fakeouts.
Best trades come only after breakout + retest from this zone.
🟢 2. BUY SETUP (Long Entries)
BUY ENTRY 1 (Aggressive)
Entry: Above 0.1455
Why:
Breaking out of the no-trade zone
Breaking above downward red trendline
First confirmation that buyers are in control
SL: 0.1424
TP1: 0.1500
TP2: 0.1532
TP3: 0.1568
TP4: 0.1609
BUY ENTRY 2 (Safe Retest Buy)
Entry: Retest of 0.1500 after breakout
Why:
Key resistance → once broken, acts as strong support
Retest = low-risk entry
SL: 0.1470
TP1: 0.1532
TP2: 0.1568
TP3: 0.1609
TP4: 0.1622
🔴 3. SELL SETUP (Short Entries)
SELL ENTRY 1 (Breakdown Sell)
Entry: Below 0.1338
Why:
Clean break below structure
Leaving the no-trade zone to downside
Lower low confirms bearish continuation
SL: 0.1378
TP1: 0.1324
TP2: 0.1283
TP3: 0.1243
TP4: 0.1199
SELL ENTRY 2 (Retest of broken support)
Entry: Retest of 0.1378 from below
Why:
Broken support becomes resistance
Best risk–reward for downside continuation
SL: 0.1405
TP1: 0.1338
TP2: 0.1324
TP3: 0.1283
TP4: 0.1243
💡 Why These Levels? (Price-Action Logic)
🟢 Buy Levels
All your green arrows match previous rejection zones.
When price breaks above these, market shows shift from lower highs → higher highs.
Breakout of the red trendline = trend reversal signal.
🔴 Sell Levels
Your red arrows sit on previous demand zones.
Once broken, these become supply zones, ideal for short selling.
Downtrend channel (red lines) confirms bearish continuation targets.
🛑 FINAL TRADING PLAN SUMMARY
NO TRADE
0.1378 – 0.1450
BUY ABOVE
0.1455
Targets: 0.1500 → 0.1532 → 0.1568 → 0.1609 → 0.1622
SL: 0.1424
SELL BELOW
0.1338
Targets: 0.1324 → 0.1283 → 0.1243 → 0.1199
SL: 0.1378