The Dollar Index (DXY) and Volatility: An In-Depth OverviewThe Dollar Index (DXY) is a benchmark that measures the value of the United States dollar (USD) relative to a basket of major foreign currencies. Developed in 1973 by the Intercontinental Exchange (ICE), it is designed to provide a broad perspective on the performance of the dollar in the global foreign exchange market. The DXY has become an essential reference point for traders, investors, economists, and policymakers to gauge the dollar’s strength or weakness over time.
Composition of the Dollar Index
The Dollar Index is calculated using a weighted geometric mean of six major world currencies:
Euro (EUR) – 57.6% weight
Japanese Yen (JPY) – 13.6% weight
British Pound (GBP) – 11.9% weight
Canadian Dollar (CAD) – 9.1% weight
Swedish Krona (SEK) – 4.2% weight
Swiss Franc (CHF) – 3.6% weight
The heavy weighting of the euro makes the DXY highly sensitive to changes in the EUR/USD exchange rate. Movements in these currencies directly affect the dollar’s index value, offering a snapshot of the USD’s overall global purchasing power.
Interpreting the Dollar Index
A rising DXY indicates that the USD is strengthening relative to the basket of currencies, whereas a declining DXY suggests the dollar is weakening. The index serves as a key barometer for traders, often used alongside other financial instruments such as commodities, equities, and bonds.
For example:
A strong dollar can reduce demand for commodities priced in USD, such as gold and oil, because these assets become more expensive in foreign currencies.
Conversely, a weak dollar can stimulate exports from the U.S., as American goods become more competitive abroad, potentially boosting corporate earnings in international markets.
Volatility and Its Connection to the Dollar Index
Volatility refers to the degree of variation in the price of a financial instrument over time. In the context of the Dollar Index, volatility reflects how sharply and unpredictably the value of the USD changes against the basket of currencies.
There are two types of volatility:
Historical Volatility – Measures past fluctuations in the DXY over a specific period.
Implied Volatility – Derived from options pricing, it reflects market expectations of future dollar movement.
High volatility in the DXY indicates uncertain or turbulent market conditions, while low volatility suggests relative stability in the dollar’s value. Traders and investors closely monitor DXY volatility because it has a ripple effect across multiple asset classes.
Factors Driving Dollar Index Volatility
U.S. Economic Data
Economic indicators such as GDP growth, unemployment rates, inflation, and consumer confidence directly impact the dollar. Positive data can strengthen the USD, while weaker data can trigger declines. Volatility often spikes during major economic announcements.
Monetary Policy
Decisions by the Federal Reserve regarding interest rates and quantitative easing heavily influence the dollar. Higher interest rates attract foreign capital, boosting the DXY, while rate cuts can weaken it. Market anticipation of policy changes also fuels volatility.
Global Political Events
Geopolitical crises, trade wars, or elections can drive sudden shifts in the dollar’s value. During uncertainty, investors often flock to the USD as a safe-haven asset, creating sharp price swings.
Risk Appetite and Market Sentiment
Investor behavior plays a crucial role. In risk-off environments (e.g., global recessions), the USD typically strengthens as a safe-haven, while risk-on sentiment can lead to a weaker dollar.
Commodity Prices
Many commodities, particularly oil, are priced in USD. Changes in commodity prices can create feedback loops with the dollar. For instance, a rising oil price can strengthen exporters’ currencies, affecting the DXY.
International Capital Flows
Large-scale investments into or out of U.S. assets, including stocks, bonds, and real estate, can influence the dollar index. Volatility often rises when capital flows are sudden or unpredictable.
Implications of Dollar Index Volatility
The volatility of the DXY has far-reaching consequences across global financial markets:
Impact on Forex Trading
The DXY serves as a reference for currency traders worldwide. A volatile dollar creates opportunities for profit but also increases risk. Traders often use the DXY to hedge against currency exposure.
Effect on Commodities
Commodities priced in USD, like gold, silver, and oil, tend to move inversely to the DXY. A volatile dollar can lead to unpredictable swings in commodity prices, affecting producers, consumers, and investors.
Global Economic Implications
Emerging markets often carry debt denominated in USD. Volatility in the dollar can increase debt servicing costs, trigger capital outflows, and destabilize these economies.
Stock Market Influence
A stronger dollar can reduce earnings of U.S. multinational companies when converted back from foreign currencies, affecting stock prices. Conversely, a weaker dollar can boost revenues abroad.
Investment Strategies
Portfolio managers use DXY volatility to adjust allocations in currencies, bonds, equities, and commodities. Options, futures, and ETFs linked to the DXY allow investors to hedge or speculate on dollar movements.
Tools and Metrics to Measure Volatility
Investors use several tools to measure dollar index volatility:
Standard Deviation – Calculates average price deviation over time.
Average True Range (ATR) – Measures daily price range to quantify volatility.
VIX or Dollar Volatility Index – Although VIX measures equity volatility, there are derivative instruments and implied volatility metrics for the DXY itself.
Option-Implied Volatility – Extracted from currency options, providing insight into expected future movements.
These metrics help traders and institutions anticipate market swings, manage risk, and design hedging strategies.
Dollar Index in Global Context
The DXY is not just a U.S.-centric indicator. Its movements influence global trade, investment flows, and macroeconomic policies:
Emerging Markets: High DXY volatility can create stress in emerging economies reliant on USD debt.
Global Trade: A stronger dollar can dampen demand for U.S. exports while boosting imports.
Central Banks: Other central banks monitor the DXY to adjust their monetary policies and manage currency stability.
Conclusion
The Dollar Index (DXY) and its volatility are central to understanding the dynamics of the global financial system. The DXY provides a comprehensive measure of the USD’s strength relative to a basket of key currencies, while volatility highlights the magnitude and unpredictability of dollar movements. Together, they affect forex markets, commodities, equity markets, and macroeconomic stability worldwide.
Volatility, driven by economic data, central bank policies, geopolitical events, and investor sentiment, serves as both a risk and an opportunity. Traders use it for speculation, hedging, and risk management, while policymakers and global investors monitor the DXY to gauge market sentiment and make strategic decisions. Understanding the relationship between the dollar and its volatility is therefore essential for anyone involved in global finance, from currency traders to multinational corporations and sovereign institutions.
In today’s interconnected economy, where financial shocks can quickly ripple across continents, the dollar index and its volatility remain critical indicators of global economic health, investor sentiment, and market risk.
Dollarindex

NASDAQ bullish bias on HTF and ITFThe price is currently reacting to THE DAILY FAIR VALUE GAP , which is a good confluence for bullish and long clarity, as the dollar continues to freefall , we can consider the relative strength between the index and the currency to support our long idea.
The closest target would be the recents 4 hour highs.
Wait until 9:30 openin for any manipulation to frame our trade.
Invalidation :- closing below the (dfvg)

A New World without the US Dollar at the helm?Civilizations halt.
Empires fall.
New worlds and new world orders are built on the ruins of older greats.
Is this the slow decline of the largest empire known to mankind?
Whatever happens, I wish it happens over the next 50 years so I can be here to witness the shift in awe.
Technically speaking, US Dollar has been in a long term uptrend channel since 2008 and this channel is now seriously being tested and is at a risk of being violated. What is interesting is this isn't just a technical move, this is a move backed by a fundamental shift in Global order.
How will the world look like if US is not at the helm? Only time will tell.
see you later—ciao!

DXY Warning Zone: Commodities & IT on Alert📌 TVC:DXY Warning Zone: Commodities & IT on Alert
DXY has completed a bullish harmonic pattern and is holding strong support near 97.70 a critical medium-term demand zone.
As long as DXY stays above 97.50, the bias remains sideways to mildly bullish with upside potential toward 99.00–100.40.
A decisive breakdown below 97.50 would shift the medium-term trend to bearish, opening room toward 96.20.
🧭 Medium-Term Market Impact
🟡 Gold & Silver
Likely to face resistance and consolidation if DXY rebounds
Strong upside only if DXY slips below 97.5
🛢️Crude Oil
Medium-term pressure remains
Dollar stability keeps crude range-bound to weak
🔩 Metals (Steel, Copper, Aluminium)
Dollar strength = limited upside / corrective phase
🇮🇳 Indian Equities
Positive: Banks, FMCG, OMCs, consumption themes
Cautious: Metals, commodity exporters
IT: Neutral → weak unless DXY breaks down
🔑 Medium-Term Takeaway
📍 Dollar at structural support.
➡️ Hold above 97.5 → risk-off for commodities
➡️ Break below 97.5 → commodity & IT rally
This setup is important for Jan–Feb positioning.

$ Index - view and analysis$ Indec has clearly taken monthly month trend line support and slowly moving up.
Its could be just technical move and i am not aware of any reason for US dollar and this index to move up. Only solution for US Govt to stop shut down is only lifting limit and print more fiat currency. After the news flow mostly it will coincide with fib level and US will announce printing of more fiat currency. I still think its long time bearish view only and short term could be bullish till it reaches the point to fall down again.
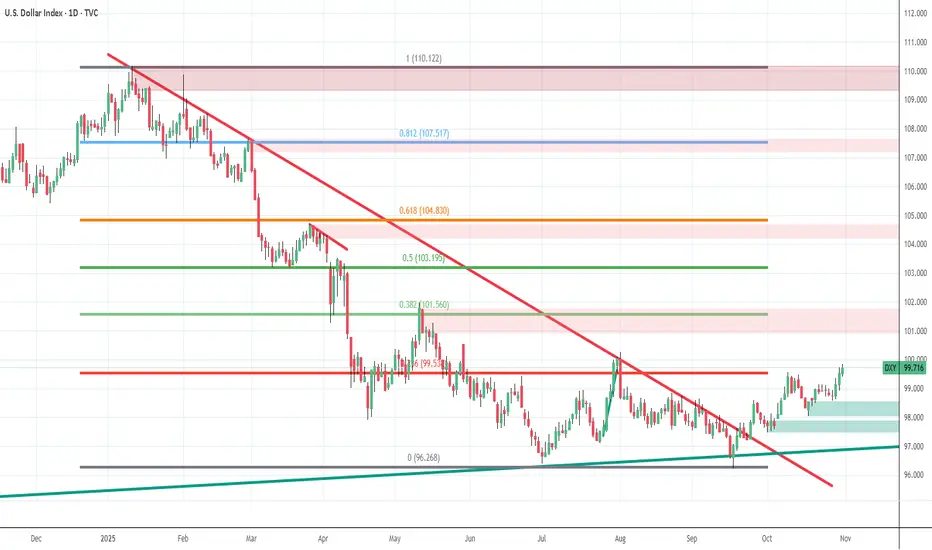
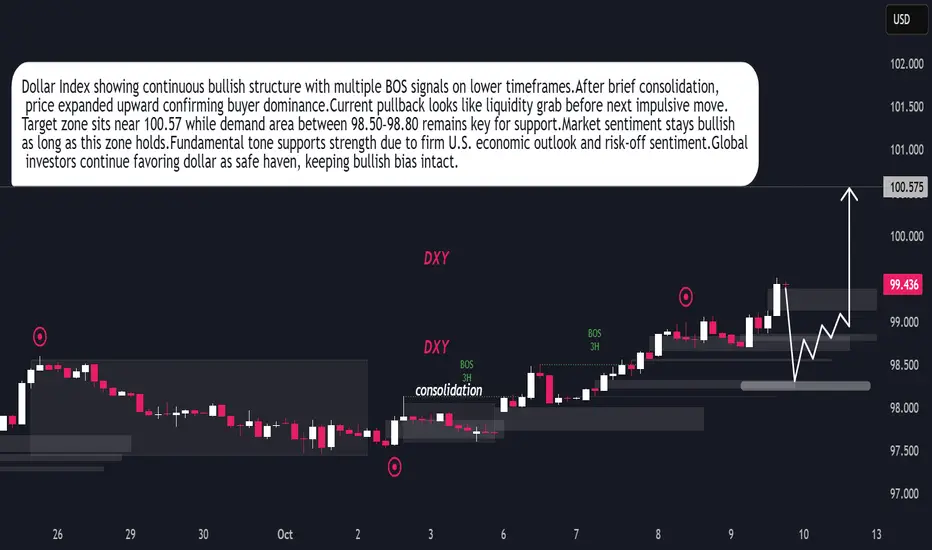
DXY Ready for Next Bullish Leg After Liquidity SweepDollar Index maintaining bullish structure after recent BOS on 3H timeframe.Market formed consolidation phase early October before expansion.Buyers showing control pushing price towards 100.57 objective.Current retracement indicates liquidity grab before next bullish impulse.Demand zone 98.50–98.80 remains key area for continuation.Technical sentiment stays positive as long as price holds above 98.50.Fundamentally, dollar supported by strong U.S. data and cautious global tone favoring safe-haven demand.Momentum outlook remains bullish with potential continuation toward 100.50+ zone.
The Dollar’s Journey💵 The Dollar’s Journey – From Blastoff to Pause, and Maybe… Another Run?
Back in May 2021 , the Dollar Index (DXY) quietly started climbing. At first, nobody gave it much thought. But then 🚀 it took off—running from 89 to 114 in just over a year. That’s what traders call a parabolic move —fast, powerful, and impossible to ignore.
Then came September 2022 . The rally cooled off. The dollar stopped sprinting and instead moved sideways. For the next three years , it was all about patience. The index slipped as low as 95.5 , testing everyone’s nerves. Was the bull run dead, or just taking a breather? ⏸️
Here’s the twist: that low wasn’t random. It actually landed right on a major long-term trendline —a line that connects the tops of 2001, 2016, and 2020 . In other words, the dollar was pulling back to recharge at home base . 📉➡️📈
Now the picture gets exciting again. The correction looks done. The index is knocking on the door of 100 —and this number isn’t just psychological, it’s technical too. If DXY sustains above 100 ✅ , it could light the fuse for the next bull run 🐂💵 .
And remember, when the dollar moves, the world feels it:
* 📉 Global equities, especially emerging markets, often struggle.
* 🛢️ Commodities like gold and oil usually come under pressure.
* 💱 Other currencies—the euro, yen, pound—tend to weaken.
So here we are, three years after the peak. The dollar looks ready to decide its next chapter. Will it stay stuck in consolidation… or break out into a brand-new bull cycle? Traders, investors, and even governments are watching closely. 👀
The story of the dollar isn’t over—it might just be about to get interesting again. 📊✨

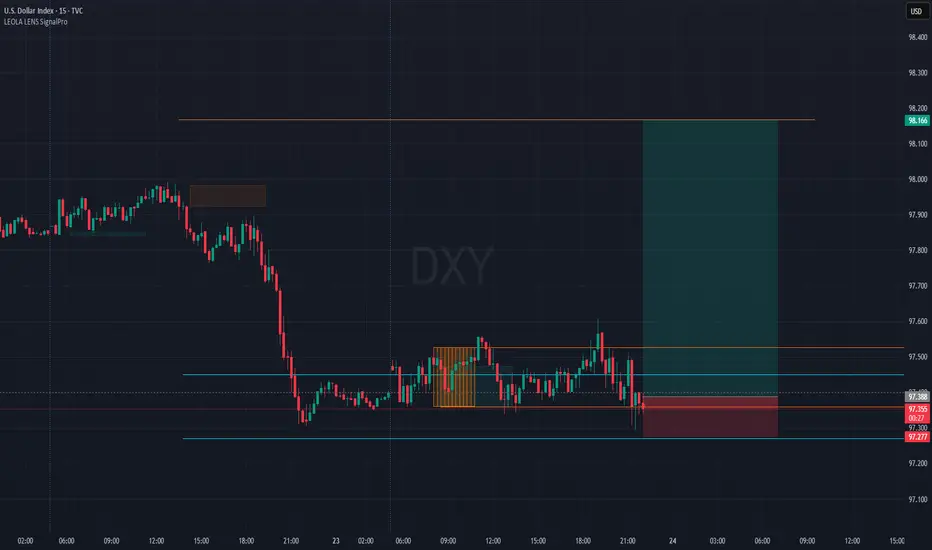
DXY Range Break Attempt- Can the Dollar Regain Control?DXY showing signs of life after an extended sideways compression near key structure lows.
Price reacting from SignalPro’s Liquidity Control Zone, hinting at possible bullish shift.
📈 Long setup framed with:
Retest of lower zone holding above 97.28
Targeting upper imbalance toward 98.166
🟧 Previous caution label reflected indecision phase – now resolving with fresh push attempt.
Key Technical View:
🔹 Tight range breakdown rejected, forming potential bear trap
🔹 SignalPro highlights entry zone clarity and risk-defined setup
🔹 Bullish continuation scenario valid above demand zone hold
🧠 Chart for learning purposes only.
📊 Tool: Leola Lens SignalPro | ⏱ Timeframe: 15m
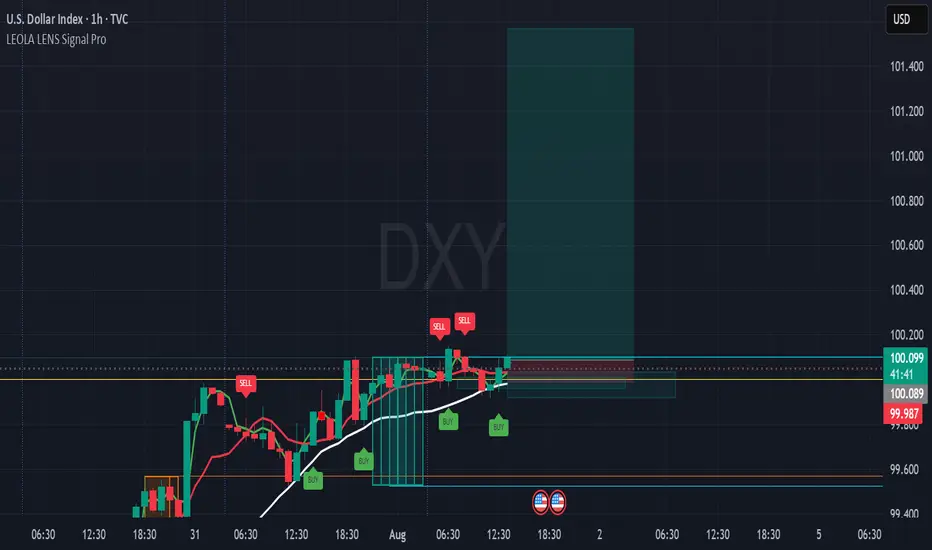
DXY Long Setup Forming After Structure Reclaim-101.567This intraday chart on DXY (U.S. Dollar Index) showcases a structure-aware long setup using Leola Lens SignalPro on the 1H timeframe.
⚙️ Key Technical Highlights:
🟢 Multiple BUY signals appeared near 99.98–100.00 zone after reclaiming short-term structure.
⚪ Price holds above the white adaptive base trendline — suggesting support strength.
🟥 Liquidity Control Box defines a clear invalidation zone under 99.98.
🔁 Prior SELL signals failed to follow through, indicating weakening bearish momentum.
📊 Target projection: 101.567 (based on structural extension and signal alignment).
📌 What to Monitor:
🔎 A decisive candle close above 100.10–100.15 can confirm bullish intent.
🎯 Reward-to-risk favored on clean setups post-breakout, aligning with momentum model.
📉 Invalid if structure re-breaks below base zone with volume.
⚠️ Educational use only. Not financial advice. Structure zones visualize behavior — not prediction.
🔐 Invite-only tool — access details in author bio.
Learn Institutional TradingWhy Learn Institutional Trading?
The financial markets are not random; they are highly structured environments controlled by large financial players who leave visible footprints on the chart. Most retail traders don’t see these footprints and end up on the wrong side of the market. By learning institutional trading, you will finally understand:
Why the market moves the way it does.
How to spot liquidity traps and avoid stop-loss hunting.
Where smart money enters and exits trades.
How to trade with confidence instead of fear and guesswork.
This course focuses on the real mechanics of price movement, not on unreliable indicators or random trade signals.
What You Will Learn in Institutional Trading
✅ Smart Money Concepts (SMC):
Learn how institutional traders accumulate and distribute orders, using liquidity to their advantage. Understand the true story behind price action.
✅ Liquidity and Order Blocks:
Master the art of identifying liquidity pools, order blocks, and market manipulation zones. Understand where smart money enters the market and how you can follow their lead.
✅ Market Structure Mastery:
Learn to read market structures with precision, identify internal and external structures, and capitalize on market shifts with high-probability trade setups.
✅ Entry and Exit Strategies:
Get access to professional-grade entry methods, including refined confirmation entries, break-of-structure (BOS) trades, and optimal risk-reward setups.
✅ Risk Management Techniques:
Understand how institutions manage risks and protect their capital. Implement strong risk management rules to protect your trading account from unnecessary losses.
✅ Live Market Sessions and Mentorship:
Participate in live market discussions, chart breakdowns, and Q&A sessions with expert traders who trade institutional concepts every day.
Who Can Learn Institutional Trading?
This course is suitable for:
📌 Beginners who want to start with professional strategies from day one.
📌 Intermediate traders who are tired of inconsistent results.
📌 Advanced traders who want to refine their understanding of market manipulation.
📌 Investors who wish to add active trading as an income source.
📌 Aspiring professionals who aim to make trading a serious career path.
Benefits of Learning Institutional Trading
✅ Trade with clarity and confidence, knowing you are on the side of smart money.
✅ Stop chasing trades and start trading with high-probability setups.
✅ Learn to avoid retail traps and false breakouts.
✅ Build a sustainable trading career with proper risk management and psychological discipline.
✅ Apply your skills to any market: stocks, forex, crypto, indices, or commodities.
✅ Experience real growth as a professional trader, thinking several steps ahead of the market.
Learn Institutional Trading is more than just a course — it’s a complete professional transformation. It equips you with the skills, mindset, and strategies to succeed in modern financial markets. Stop trading blindly and start trading with purpose, accuracy, and confidence.

Gold Hits Another Record II U.S. Tariff Plan II Daily Analysis🔥 Fundamental Analysis :
⚡Gold rose to $3,164 per ounce, a new record high as risk aversion increased following President Trump's tariff announcement.
⚡Trump outlined a 10% baseline tariff on imports from all countries, with higher rates for nations with trade surpluses, including China (34%), the EU (20%), and Japan (24%), and a 25% tariff on foreign-made automobiles.
⚡ All eyes are on the U.S. non-farm payrolls report, due Friday, for further clues on the Federal Reserve's monetary policy path.
Technical Analysis:
1. New All-Time High:
The price reached 3,168 USD, marking a new all-time high.
However, the price has slightly retraced after hitting this level.
2. Fibonacci Levels:
• 1st Fib Level: 3,183 USD – Potential resistance.
• 2nd Fib Level: 3,206 USD – Further resistance if the bullish momentum continues.
3. Support & Resistance Zones:
• Green Zone (~3,135 - 3,138 USD): Previously a resistance, now acting as support.
• Another support near 3,124 USD.
• Resistance Levels:
• 3,168 USD: (All-time high) – If broken, could push the price towards the Fibonacci targets.
4. Moving Averages:
• Red Line (Likely 50 EMA): Trending upwards, supporting price action.
• Blue Line (Likely 200 EMA): Positioned lower, indicating that the trend remains bullish as long as price stays above.
5. Trend Analysis:
• Bullish Breakout: The price broke out of a previous range and surged to a new high.
• Potential Retest: Price might revisit the 3,135 - 3,138 support zone before another leg up.
Trading Considerations:
• Bullish Case: If price consolidates above 3,135-3,138, it could retest 3,168 and move towards 3,183 or 3,206.
• Bearish Case: A break below 3,135 could push price back towards 3,124 or lower.
• Risk Management: Place stop losses below key support zones if entering long positions.
👉 Always follow TP/SL to protect your capital and maximize profits!
Stay tuned for updates once the confirmations are in place!
Please support me with your likes and comments to motivate me to share more analysis with you and share your opinion about the possible trend of this chart with me !
📢Best Regards , Silver Wolf Traders Community
Disclaimer: This is for educational purposes only.
Always trade responsibly and manage your risk effectively

U.S. Job Growth Slows: Impact on USD and Indian InvestorsIn the first two months of 2025, the U.S. economy experienced a notable slowdown in job creation, as reflected in consecutive Nonfarm Payroll (NFP) reports falling short of expectations. According to the U.S. Bureau of Labor Statistics, February saw an addition of 151,000 jobs, below the anticipated 160,000, though an improvement from January's revised 125,000.
reuters.com
+1
tradingeconomics.com
+1
Impact on the U.S. Dollar Index (DXY) 📉
The consecutive underperformance in job growth has exerted pressure on the U.S. Dollar, leading to a decline in the U.S. Dollar Index (DXY), which measures the greenback against a basket of major currencies. As of March 10, 2025, the DXY stood near a four-month low at 103.59, reflecting diminished investor confidence in the U.S. economy.
reuters.com
Federal Reserve's Response 🏦
Weak labor market data often prompts the Federal Reserve to reassess its monetary policy stance. With two consecutive NFP reports missing expectations, the Fed may consider slowing the pace of interest rate hikes or even exploring economic stimulus measures to support growth and employment. However, any policy adjustments will also weigh factors such as inflation trends and overall GDP growth.
Implications for Indian Investors 🇮🇳
The U.S. labor market's performance holds significant implications for global economies, including India:
Currency Exchange Rates 💱: A weakening U.S. Dollar can lead to the appreciation of the Indian Rupee, affecting export competitiveness and import costs.
Gold Prices 🪙: Traditionally, a softer USD boosts gold prices. Indian investors, who have a cultural affinity for gold, might see increased returns on their gold investments.
m.economictimes.com
Stock Market 📈: Global equity markets, including India's, often react to U.S. economic indicators. A slowing U.S. economy might lead to cautious sentiment among Indian investors, influencing market dynamics.
Expert Insights 🧠
Economists note that while recent U.S. job data indicates a slowdown, it's essential to consider the broader economic context. Factors such as consumer spending patterns, international trade policies, and geopolitical developments play pivotal roles in shaping both U.S. and global economic landscapes.
Conclusion 📝
The recent underwhelming NFP reports serve as a cautionary signal regarding the U.S. economy's momentum. For Indian investors, staying informed about these developments is crucial, as they can influence currency valuations, commodity prices, and equity markets. A diversified investment approach, coupled with vigilance, can help navigate the potential ripple effects stemming from shifts in the U.S. economic environment.

Possible Wave Counts on Daily Time Frame Chart of DXYMost investors treat trading as a hobby because they have a full-time job doing something else.
However, If you treat trading like a business, it will pay you like a business.
If you treat like a hobby, hobbies don't pay, they cost you...!
In this study we used Elliott Wave Theory & Structures, here we have plotted possible wave counts on daily time frame chart of DXY Dollar Index, it involves multiple possibilities, and the analysis presented focuses on one potential scenario. The provided information is for educational purposes only, not trading advice. There's a risk of being completely wrong.
I am not Sebi registered analyst.
My studies are for educational purpose only.
Please Consult your financial advisor before trading or investing.
I am not responsible for any kinds of your profits and your losses.
Hope this post is helpful to community
Thanks
RK💕
Disclaimer and Risk Warning.
The analysis and discussion provided on in.tradingview.com/u/RK_Charts/ is intended for educational purposes only and should not be relied upon for trading decisions. RK_Charts is not an investment adviser and the information provided here should not be taken as professional investment advice. Before buying or selling any investments, securities, or precious metals, it is recommended that you conduct your own due diligence. RK_Charts does not share in your profits and will not take responsibility for any losses you may incur. So Please Consult your financial advisor before trading or investing.

$ - Sell ?For several months $ was weak but as US Equity reached new ATH $ was making accumulation at lower levels and took lot of time to rise. Right now $ index is at golden ration level and I expect possibilities are distribution and price could fall in coming days and I do not expect $ index to rise further higher. with new president having plans to make US exporter and wanted a weak dollar combined with BRICS and world nations following non-dollar trades. So I am expecting $ index to fall and its right time to sell Dollars and Buy Euro and Yen.

Nifty Analysis: Double Bottom Formation and Bullish OutlookThe Nifty index appears to be forming a classic "W" or double bottom pattern at its current lower levels, which it has been testing for the past few weeks. This is a strong technical signal often indicative of a potential trend reversal.
Meanwhile, the Dollar Index (DXY) is hovering near its peak levels and is showing signs of a divergence pattern on key technical indicators. This divergence suggests a possible shift in momentum, which could further support bullish sentiment for Nifty.
Based on this pattern analysis, it’s becoming increasingly clear that the market clouds are dissipating, and a brighter phase may be emerging. Nifty is poised for a bullish move, and this could create opportunities in related stocks. Stay vigilant and look out for stocks aligning with your trading framework.
Disclaimer:
This is a technical analysis based on chart patterns and is shared for educational purposes only. Please conduct your own research and analysis before making any trading decisions.

DXY Bearish Setup Update - DXY is currently trading at 105.7 and it exactly got rejected from my POI
- DXY looks all set to mitigate 103.8, bringing more upside to all pairs denominated by USD, risky assets like Crypto, and Stocks.
- Watch out for 103.8 and 101.9 to expect another leg up from
- We have a market structure shift from 103.3 if we flip below that on a weekly TF, we might soon see DXY turning bearish.
- DXY can soon show impulsive moves on Monday post bullish commentaries

DXY PARABOLIC SETUP Update- DXY is currently trading at 107.4
- DXY has made a lot of USD-denominated pairs bleed and they are still getting slaughtered
- DXY is currently at a point where there's a lot of limit sell stops above the buy side liquidity
- Once the orders are consumed we might see another round of Impulse up to the marked displacement of 110-111$
- DXY pumping along with the Equity market, Crypto isn't a good sign there's a negative smart money divergence laying that's trapping and sucking liquidity from retail suckers.
- Sit at the sidelines and keep locking in gains until you see DXY flipping its structure to bearish
- Retail pattern traders might get flushed when they call this a double bottom.

DXY gearing up for a big fallDate: 30 Oct’24
Symbol: DXY
Timeframe: Weekly
US Dollar Currency Index currently seems to be in final stages of Wave (e) of B. One more leg up and DXY will be ready to head lower sharply and in a big way. It is likely to head towards 90 and lower. This also means with DXY treading lower, Nifty is likely to witness an up move.
This is not a trade recommendation. Please do your own analysis.
US Dollar Currency Index vartamaan mein Wave B (e) ke antim charan mein lagta hai. Ek aur pair upar aur DXY teji se aur bade paimaane par neeche jaane ke lie taiyaar hoga. Iske 90 aur usase kam kee or badhane kee sambhaavana hai. Iska matalab yah bhee hai ki DXY ke nichale star par chalane se Nifty mein teji dekhne ko mil sakti hai.
Yah koi trade karne ki salah nahin hai. Kripya apana vishleshan khud karen.

Dollar IndexHello and welcome to this analysis
With FED all set to start the rate cut cycle from today's FOMC meet, DXY is expected to enter the potential reversal zone (PRZ) of not one but two bullish Harmonic patterns, namely, bullish AB=CD and bullish Crab, likely forming a triple bottom in the weekly time frame.
The PRZ is between 100 - 99.60 while the patterns would be considered invalid below 99.50, for a possible bounce (if not reversal) till 103.
When will it enter the PRZ by? Will depend totally on hawkish/dovish, FED Chairman Jeremy Powell is in his statement today.
Regards

DXY Dollar Index Trade Setup - The Dollar Index is currently trading at 100.691
- The Dollar Index looks all set to break below the important liquidity area
- We can see an either side's Liquidity grab cause of the FOMC
- Watch out for the FOMC closely as market likely shows a direction before that

DXY 1D Price Delivery AnalysisThe Dollar Index is currently trading at 101.8$
- NFP helped the dollar to climb higher last week
- We saw a major sell off in the stock markets too
- Watch out for the 2 paths drawn we might see dry spells and lack of action before CPI
- IMO we are going to fill the FVG before CPI and then post the CPI publication we will pierce the lows and make new lows
- If you see the CPI coming above estimates and we will surely run up more higher


USDJPY - POSITIONAL SHORT TRADESymbol - USDJPY
USDJPY is currently trading at 157.700
I'm seeing a trading opportunity on sell side.
Shorting USDJPY pair at CMP 157.700
I will be adding more if 158.200 comes & will hold with SL of 158.500
Targets I'm expecting are 154.800 - 151.900 & beyond.
Disclaimer - Do not consider this as a buy/sell recommendation. I'm sharing my analysis & my trading position. You can track it for educational purposes. Thanks!
