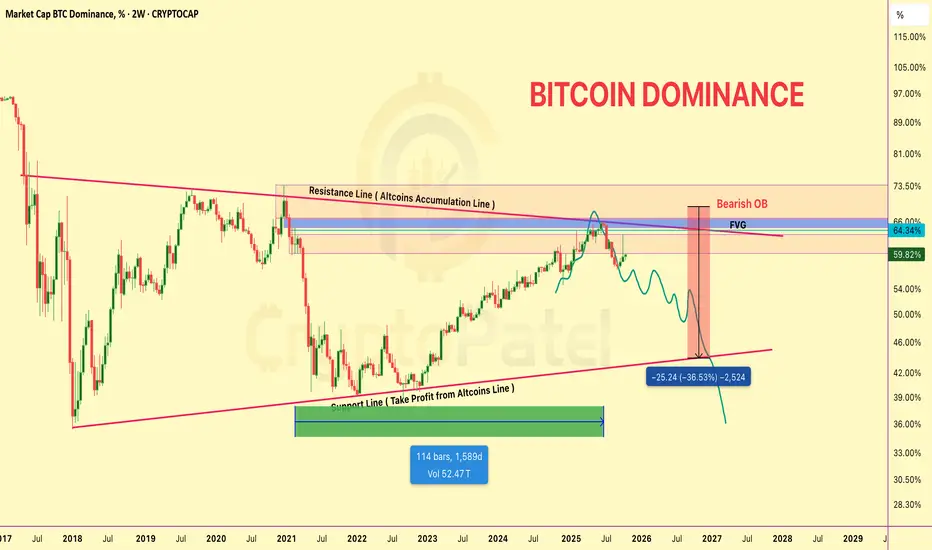
BTC Dominance (BTC.D) – Macro Structure BreakdownBTC Dominance Is Respecting A Multi-Year Symmetrical Triangle Structure That Has Been In Play Since 2017. Price Recently Tagged The Upper Resistance / Altcoins Accumulation Zone Around 64–66%, Where Strong Supply Entered The Market.
🔴 Technical Confluence:
Price Tapped A Bearish Order Block Near 65–66%
Resistance Retest Completed → Failure To Reclaim
Market Structure Turning Bearish Below 64%
Fair Value Gap (FVG) Formed At Resistance Acting As Supply
Momentum Weakness With Acceptance Below Prior Support
Downside Projection:
If This Breakdown Confirms, BTC.D Could Expand Lower Toward The Macro Support Trendline / Altcoins Take-Profit Zone Around 38–40%, Representing A Potential −25% To −36% Move Into Late 2026–2027.
Market Implication:
Bitcoin Dominance Decreasing = Big Altseason Rally Loading
Capital Rotation From BTC Into Altcoins Historically Aligns With This Phase.
Key Level To Watch:
Sustained Acceptance Below 58% Confirms Bearish Continuation.
❌ Invalidation:
Strong Reclaim And Acceptance Above 64–66% Resistance.
Bias: Bearish BTC Dominance → Bullish Altcoins
Dominancebtc

Why Altcoin Holders Need to See This BTC Dominance Chart RIGHT NWhy Altcoin Holders Need to See This BTC Dominance Chart RIGHT NOW
BTC.D still trending UP → targeting 63% before the reversal
Yes, it hurts altcoin bags right now 😤
63% → flip to 40-45% → ALTSEASON 🚀
Let BTC run. Your bags will pump after.
Patience wins.
NFa & DYOR
Btc dominance analysis Learn and understand how to reads market 👍 (These charts will help you to understand market)
- Btc dominance took breakout and chances to test upper resistance if it holda this breakout (so we can see dip in alts)👍

Bitcoin Dominance Chart ( Altcoins Pump or Dump ? )Bitcoin Dominance Chart Analysis: Market Insights and Predictions
Bitcoin dominance, or BTC dominance, is a metric that measures the ratio of Bitcoin's market capitalization to the total market capitalization of all cryptocurrencies. This indicator is used to gauge the strength of Bitcoin relative to the broader crypto market. Currently, Bitcoin dominance stands at 51.30%.
Key Takeaways:
- Bitcoin dominance is trading at a higher resistance zone, which may lead to a retracement.
- A potential test of the 47.50% support level is possible before a leg up.
- The relationship between Bitcoin dominance and altcoins:
a. Increasing Bitcoin dominance: Altcoins may go down in value.
b. Decreasing Bitcoin dominance: Altcoins may experience a pump in value.
Support and Resistance Levels:
Support levels: 47.50% / 40%
Resistance levels: 53% / 70%
Analysis:
Bitcoin dominance is currently at a higher resistance zone, which could result in a retracement to the support level of 47.50%. This could potentially lead to a short-term pump in altcoins' value, as Bitcoin dominance decreases.

BITCOIN Crossed Dominance 50% after May 2021BITCOIN DOMINANCE 1-day Chart
As Per Broadening Wave pattern movement into BTC Dominance Chart, it's crossed today 50% of Dominance now. Its last time into above 50% of Dominance at 1st May 2021 at final stage of Bullrun finish point. but very big chances, as per pattern that it revert at 45-46% again last time in July to August into Last Bearish Zone cycle and Altcoins season starts in Bullish mode from here.
Always #DYOR and Trade wisely with using #StopLoss too.
Must LIKE & SHARE

BTC (Dominance ) 1Hr Chart BTC (Dominance) 1Hr Chart
Its Dominance Chart Of Bitcoin
It's Forming Descending Triangle Pattern i.e. Bilateral Patter
Where It Can Break Both ways
If It Breaks Upward ALT Coins Will Be Green
If it Breaks Down ALT Coins Will Be In Red

Double vottom in Btc DominanceThese chart is very bearish for alts.
These may cause atleast 20% dump in Alts if the double bottom plays.


BTC Dominance Update❗️BTC Dominance Update❗️
Btc Dominance looking bullish and can very bad for alts.
Also this month Dominance have a great fundamental that is march month.
So I request you all that plz trade carefully with proper stoploss.

Bitcoin Dominance at critical levelBitcoin dominance is at major support. If dominance break below the support zone we will see a good rally in altcoins. The DeFi hype may break the support zone and bring a good altseason. Many altcoins did 3-5x from their all-time low price. The alt rally will attract new investors and that will increase the price of bitcoin also.
The dominance will bounce back from the support zone. Don't forget to book profits
