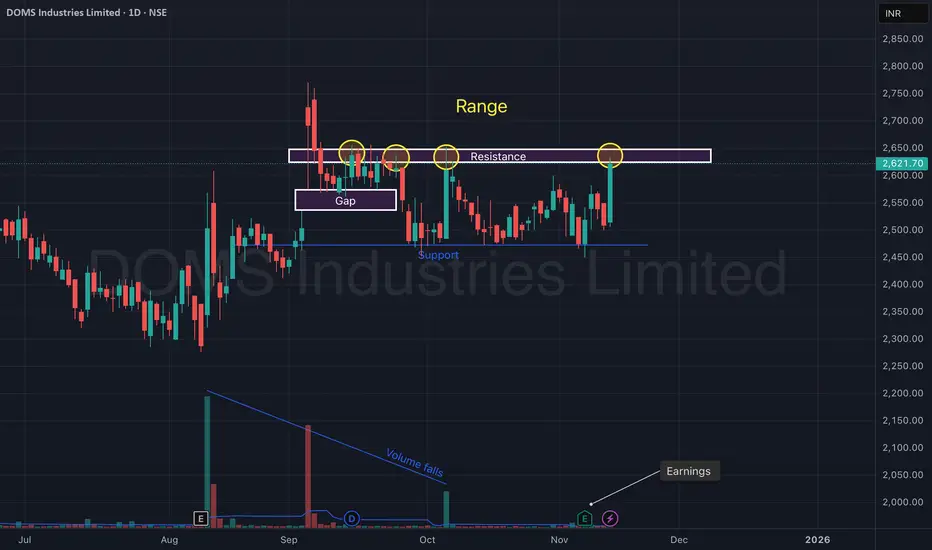
DOMS Industries Ltd – Range Breakout Attempt After Earnings.DOMS Industries continues to trade inside a well-defined range structure, with price repeatedly rejecting the ₹2,630–₹2,660 resistance zone. The recent strong bullish candle toward the upper boundary, combined with improving sentiment after earnings, signals a potential breakout attempt.
A clear gap zone retest around ₹2,520–₹2,550 provided a solid base. Support at ₹2,450 has held cleanly multiple times, validating the lower boundary of the range.
With volume slowly recovering from its multi-week decline and price pressing into resistance again, DOMS is approaching a decisive move.
🎯 Key Technical Levels
CMP: ₹2,621.70 (+4.49%)
Resistance Zone: ₹2,630 – ₹2,660 (Range high)
Gap Support: ₹2,520 – ₹2,550
Major Support: ₹2,450
Breakout Levels to Watch: Close above ₹2,660 with strong volume
📈 Technical View
Price is respecting a horizontal range for several weeks.
Repeated rejections highlighted by circles show strong supply near ₹2,650.
Gap zone acted as demand, helping price bounce back toward resistance.
Volume trend has been falling, suggesting participation has been subdued — a pickup in volume during any breakout would be critical.
Structure stays bullish above ₹2,520; bearish only if price closes below ₹2,450.
📊 Latest Earnings Snapshot
DOMS continues to deliver strong quarterly performance, supporting the technical setup:
Q2 FY26 (Sep 2025):
Net Profit: ~₹55.8 Cr
YoY Profit Growth: ~16%
Q1 FY26:
Revenue: ₹508.7 Cr (↑ ~26% YoY)
PAT: ~₹59.1 Cr (↑ ~8.8% YoY)
Consistent earnings growth strengthens the medium-term outlook and boosts confidence in a potential range breakout.
🧠 View
DOMS is back at its major resistance zone after a clean bounce from the gap support. A strong-volume breakout above ₹2,660 can trigger a momentum extension toward fresh highs, while ₹2,520 and ₹2,450 remain key demand zones to watch.
Domsindustries
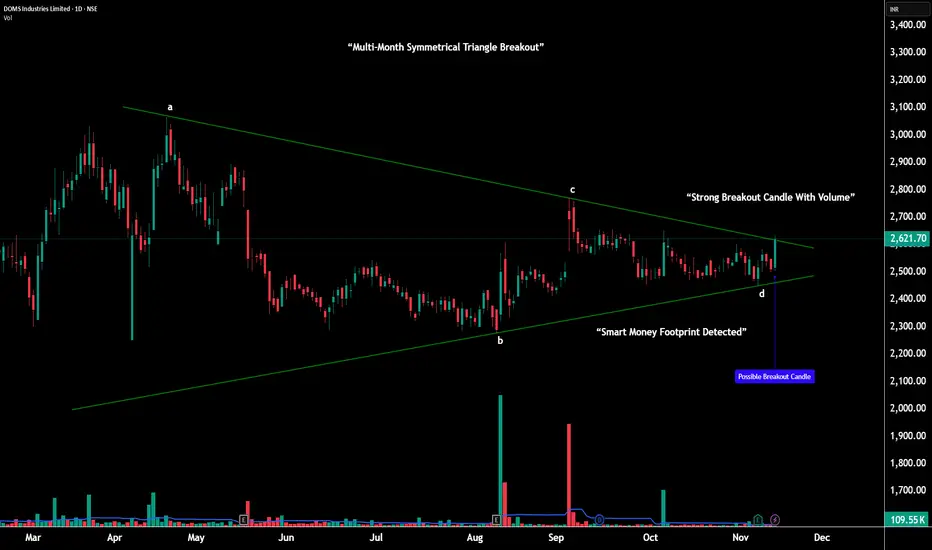
DOMS – Multi-Month Triangle Breakout |________________________________________
💹 DOMS Industries Ltd (NSE: DOMS)
Sector: Consumer & Stationery Products | CMP: 2621.70 |
View: Multi-Month Symmetrical Triangle Breakout With Expanding Momentum
________________________________________
📊 Price Action:
DOMS has spent the last five months forming a large symmetrical triangle — a volatility contraction structure marked by steady lower highs and higher lows from points A–B–C–D.
Throughout this period, buyers consistently defended the broader 2470–2500 demand belt, while sellers lost strength on every push lower.
This slow tightening shows how the market was preparing for a decisive move.
In the latest session, DOMS finally broke above the upper trendline, backed by a strong bullish range candle and a clear rise in volume, confirming the start of a fresh expansion phase.
________________________________________
📉 Chart Pattern Analysis – Large A–B–C–D Symmetrical Triangle:
This multi-month structure represents a major volatility compression following a previous uptrend — a classic continuation setup.
Point A: First major lower high
Point B: Deep anchor low
Point C: Lower high confirming supply weakening
Point D: Higher low showing demand strengthening
This clean A–B–C–D formation validates the symmetrical triangle perfectly.
As price approached the apex, volatility dried up, volume decreased, and the range narrowed — all ideal ingredients for a strong breakout.
The breakout candle now signals the end of compression and beginning of trend expansion.
________________________________________
📈 STWP Trading Analysis:
Bullish Breakout Zone: 2621.70 – 2633.20 | Stop Loss: 2498.60
The breakout candle shows high momentum and elevated volume, signaling institutional activity. Price has reclaimed all key moving averages with trend strength visible across 1H–1D–1W timeframes. As long as DOMS holds above the 2570–2590 structure zone, the bullish continuation bias remains active. Upside resistance levels can be used as potential levels of partial profit-taking, momentum checkpoints, and trend continuation targets.
________________________________________
🕯️ Candlestick Structure – Strong Bullish Breakout Candle:
The latest session printed a wide-range bullish candle, breaking through the upper triangle boundary decisively.
This type of candle — strong body, controlled wicks, clean range expansion — reflects conviction buying, not speculative spikes.
When this appears at the apex of a large compression pattern, it often marks the start of a new trending phase.
________________________________________
📏 Fibonacci Analysis:
Measured from swing low 2275.40 to swing high 2585.70:
38.2% @ 2393 → Secondary support
50% @ 2430 → Balanced support zone
61.8% @ 2467 → Strong golden zone (defended repeatedly)
The rebound from the 61.8% area aligns with the D-point of the triangle — reinforcing the structural validity and strengthening the breakout.
________________________________________
🧭 STWP Support & Resistance:
Resistances: 2667 | 2713 | 2794
Supports: 2540 | 2459 | 2413
The 2470–2500 region remains a major demand base, where the stock formed its higher lows at point D.
Immediate supply lies near 2667–2713, the first test zone after the breakout.
________________________________________
📊 STWP Volume & Technical Setup:
Volume climbed to 109.55K, significantly higher than recent averages — showing accumulation on the breakout.
RSI at 59 and Stochastic at 67 suggest healthy momentum with room for continuation.
MACD structure remains bullish, and multi-timeframe trend strength is intact.
Trend Direction: UPTREND | Volume Confirmation: Strong Buying Activity
________________________________________
🧩 STWP Summary View:
Momentum: Strong
Trend: Bullish
Risk: Moderate
Volume: High
DOMS has broken out of a large multi-month symmetrical triangle, a pattern known for initiating strong directional moves once volatility expands.
The structure remains bullish above 2570–2590, with continuation potential toward 2667 → 2713 → 2794 in the coming sessions.
________________________________________
⚠️ Disclosure & Disclaimer – Please Read Carefully
This analysis is for educational purposes only and should not be treated as investment advice.
I am not a SEBI-registered financial advisor.
Trading carries risk — use stop-loss, risk limits, and disciplined position sizing.
Please consult a SEBI-registered adviser before making trading decisions.
________________________________________
Position Status: No active position in (DOMS) at the time of this analysis.
Data Source: TradingView & NSE India
________________________________________
💬 Found this useful?
🔼 Boost this post to help more traders learn structured analysis
💭 Share your thoughts — does this breakout hold the strength for trend expansion?
🔁 Share with traders who study breakout structures
👉 Follow for more clean, price-action-driven institutional breakdowns
🚀 Stay Calm. Stay Clean. Trade With Patience.
Trade Smart | Learn Zones | Be Self-Reliant 📊
________________________________________