Will Polkadot Hit $50 Again ?Polkadot Looks Ready to Explode — $3 Might Be the Bottom, and $30+ Could Be Next
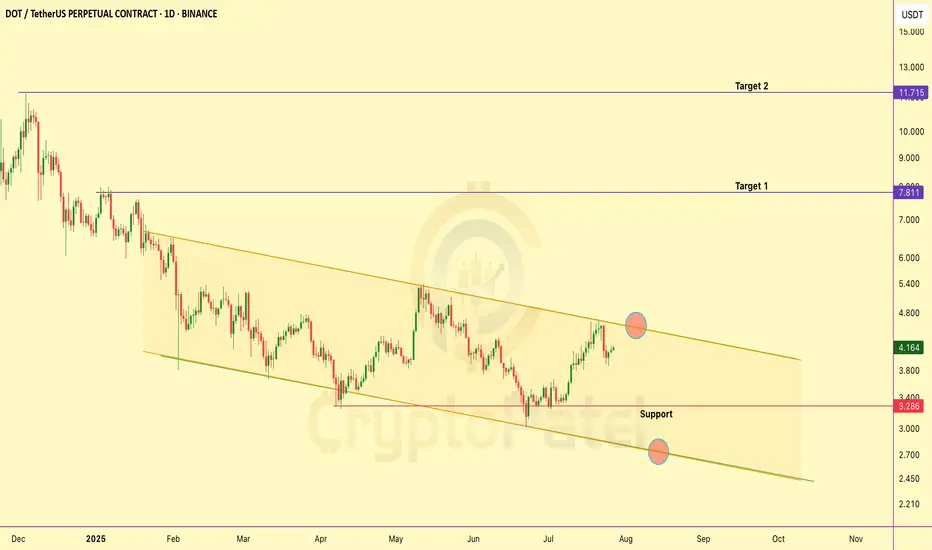
DOT is consolidating in the $4–$3 Accumulation Zone, right at the retest of a multi-year trendline breakout.
🔹 IMO: Best accumulation range = $4.00–$3.00
🔹 Holding this zone could trigger a macro reversal
🔹 HTF structure favors bullish continuation if support holds
Targets = Key resistances: $9.24 / $16.67 / $40.85
Expecting $30+ this bull run- $50 is the bonus target.
❌ Invalidation: HTF close below $3 = Exit
NFa & DYOR
DOTUSDT

Polkadot is at $4.60 — breakout or last chance to buy?Polkadot is trading just under a key resistance at $4.60 — a level it’s failed to break several times in the past.
If it finally breaks above this, we could see a strong rally toward $8 and maybe even $12 in the coming weeks.
But if it gets rejected again, the price might drop back to the $3.30–$2.60 zone which has been a strong support area before and a good place to build long positions.
For now, DOT is still inside a long downtrend. A clean breakout above $4.60 could flip the whole structure bullish.
If it breaks — it could fly
If it fails — it’s a re-entry chance
Risk-takers can start slow accumulation from here because let’s be honest, no one can predict the exact bottom or top.
Not: NFA & DYOR
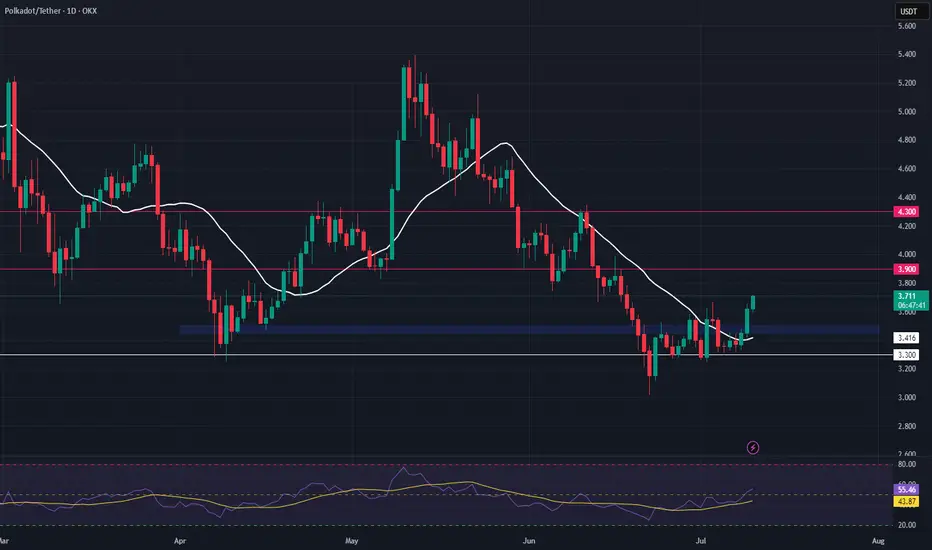
DOT Long Swing Setup – Structural Recovery with Support RetestDOT is showing early signs of recovery, reclaiming its 20-day SMA and flipping key horizontal resistance into support. We’re now watching for a retest of the $3.45–$3.50 zone to confirm the level and trigger a long entry.
📌 Trade Setup:
• Entry Zone: $3.45 – $3.50
• Take Profit Targets:
o 🥇 $3.90
o 🥈 $4.30
• Stop Loss: Daily candle close below $3.33
DOTUSDT: Ready for a Big Breakout or Sudden Drop?Yello Paradisers! Is DOTUSDT about to make a breakout move that will catch traders by surprise? Let’s break down what the charts are saying right now 👇
💎DOTUSDT is shaping up an intriguing pattern with an inducement and the formation of a descending triangle, which suggests a potential bullish breakout on the horizon.
💎If DOTUSDT breaks out and closes a strong candle above the resistance zone and trendline, this would signal a higher probability of an upward move. This is the confirmation many are waiting for before taking action.
💎Should DOTUSDT pull back, watch for a bounce from the support zone. This could set up a potential double bottom pattern. To strengthen your conviction, look for a bullish I-CHoCH (Internal Change of Character) on the lower timeframes as further confirmation.
💎If the price breaks down and candle closes below the support zone, it would invalidate the bullish outlook. In this case, the best approach would be to remain patient and wait for more reliable price action to develop before making any moves.
🎖Stay vigilant, Paradisers. Discipline and patience in analyzing confirmations are what set apart profitable traders from the rest. Always wait for the highest probability setups to increase your success rate in this volatile market.
MyCryptoParadise
iFeel the success🌴

DOT FALLING WEDGE PATTERNCRYPTOCAP:DOT is showing a bullish trend with a falling wedge pattern on the daily timeframe. A breakout from this formation could spur upward momentum,
If the breakout occurs, the initial target could be around 6.80.

After absorbing liquidity, DOTUSDT has formed a W pattern🚀💎 Paradisers, #DOT is showing a Break of Structure (BOS) towards a bullish market structure and has formed a 'W' pattern after absorbing liquidity, which increases the likelihood of a bullish move.
💎 This level is also supported by the Fibonacci 61.80% level, which further enhances the bullish probability. However, for confirmation, we need the price to break above the resistance level, after which we can expect a bullish move up to the next resistance levels.
💎 If the price breaks down below the bullish OB level, it will invalidate the bullish structure. In that case, it would be better to avoid it and wait for better price action to form.

DOT Trade Setup - Polkadot plunged from 11.5$-5.7$ more than 50% drop
- Polkadot Accumulation Zones - 4-6$ looks very solid and valuable to me when I think about it's fundamentals
- Polkadot current trading price is also cheap 30% accumulation from your total accumulation looks good to me
- Polkadot is currently trading at a very good zone however BTC isn't stable and this can fall way more if the WAR situation escalates and the same for BTC drop

DOT Sparks Potential Bullish Reversal with Inverse H & S💎 #DOT is currently demonstrating a bullish market structure, notably forming an inverse head and shoulders pattern. This pattern typically signifies a potential bullish reversal.
💎If #DOTUSDT manages to break above the high , it would confirm the breakout and could lead to further upward movement, with potential targets being the next resistance levels.
💎In the event of a pullback, traders may anticipate a bounce from the bullish order block (OB) level, providing support to the bullish bias.
💎However, if the price breaks below the bullish OB level, it would invalidate the pattern and increase the probability of a bearish trend. In such a scenario, it is advisable to exercise caution and wait for clearer price action signals before making trading decisions.

Polkadot Trade Setup - Dot is a robust project and has a strong roadmap for the upcoming years
- I have marked some key areas where you can think about accumulating DOT, kindly consult your financial advisor once as well
- I will personally be investing 80-120k in DOT in this dip because of its underlying fundamentals
- I have marked the important key zones for your reference
- From an investment perspective make sure your horizon is 3-6months and not 3-6 days
- From a Trading perspective 7-8$ can be a solid zone to accumulate DOT as a swing trade

DOT: Bullish Momentum Supported by Breakouts and Patterns💎 DOT has found support within the support zone marked by the 0.618 Fibonacci level and has broken out of a descending channel pattern, forming a W pattern supported by the 200 EMA. Additionally, the price is displaying a Break Of Structure(BOS), further increasing the likelihood of bullish momentum.
💎If the price manages to break above the first resistance area, we can anticipate further bullish movement towards subsequent resistance levels.
💎In the event of a pullback, we may see a bounce from the bullish order block (OB) levels.
💎However, if the price declines below the support level, it could signal a bearish movement for DOT. Nonetheless, given the current bullish sentiment in the overall market, it would be prudent to align with the prevailing trend.

DOT/POLKADOT Technical PerspectiveDot is a strong project
Dot currently lacks momentum
Do not park your money in DOT if you are looking for short term gains or to take more advantage of this bullish trend in the market
If you are looking to hold this for long then it's a yes to buy it
Dot needs to mitigate and then pierce through it's overhead supply in order to show an impulsive move to 7$

DOT/USDT Scalp Chart Analysis for ScalpDOT/USDT Scalp Chart Analysis
Current Price: $5.19
- Anticipating a solid 8-10% upward surge!
- Strong support at $5, eyeing an entry between
$5.0-$5.20.
- Targets: $5.48 & $5.72.
- Set Stop Loss at $4.90 for risk management.

DOT/USDT's Inverse Cup and Handle: Bearish Hints or Reversal ?💎 Paradisers, let's zoom into DOT/USDT on the daily chart. It's sketching out an inverse cup and handle formation. Interestingly, the handle's peak faced resistance at the Fibonacci's 0.5 level, bolstering the bearish narrative. The cup's top showcases a Lower High (LH), while the handle's peak indicates a Lower Low (LL).
💎 If DOT/USDT breaches the demand threshold of 4.100, we're forecasting a descent towards the subsequent demand zones at 3.383 and potentially even 2.934. However, keep your radars on! If the price surges past the handle's peak at 5.974, it would invalidate our pattern. Stay sharp and navigate wisely, ParadiseSquad!

DOTUSD : Looking for long!DOTUSD is looking for great buying opportunity after forming descending channel lined up with the double bottom expecting to reach at 9.70$


Dot Analysis on daily TF with supp & resis SPOT trade setup
For Dot coin spot entries are marked in chart

DOT/USDT Swing TradePolkadot is near support zone on hourly chart, we can take a small swing trade here.
Entry:
We can go long after close of strong bullish candle near support zone.
Stoploss:
We can keep the stoploss below the support zone.
Target:
We can keep the target near the next resistance zone.
Thank You, Please give a Like & Follow me.

Bitcoin Marke Update Today, Ethereum, Avax, Matic, Dot AnalysisBitcoin has been in a strong uptrend for the past few months, with the cryptocurrency reaching a local high above $25000. However, since then, the price has been consolidating within a range between $24500-25000
Currently, Bitcoin is showing signs of a potential bullish continuation, as the price has formed a bullish flag pattern, with a narrowing range and decreasing volume.
Furthermore, the overall market sentiment towards cryptocurrencies has been positive, and institutional adoption has continued to grow. This could lead to increased demand for Bitcoin, especially as a hedge against inflation and uncertainty in traditional financial markets.
However, it's important to keep an eye on potential resistance levels, such as the 25000-25500 levels, which could provide some challenges for further upward movement.
Therefore, I believe that BTCUSDT presents a good opportunity for bullish continuation, with a potential price target of 28000 . However, as always, it's important to keep an eye on risk management and to adjust your position accordingly based on market conditions.
Disclaimer: This is not financial advice, and I am not a financial advisor. Always do your own research and make your own investment decisions. Trading cryptocurrencies involves risk and may not be suitable for all investors.

Top 4 coins which have outperformed BTCBitcoin has increased by almost 48.97% in the year 2023. Let us have a look at the top 5 coins (based on market cap) which have outperformed BTC (we have not considered meme coins for our analysis).
1.Cardano (ADA)
YTD(%): 61.63
Price is currently moving within a range (0.385-0.421).
25% upside movement can be expected if price breaks above the range with 0.527 level acting as resistance.
Bearish RSI divergence has formed, thus, keep an eye on price movement.
2. Polygon (MATIC)
YTD(%): 86.26
Price moving within parallel channel.
21% upside movement is expected with resistance at 1.72.
If price breaks the channel, support can be found at 1.153.
3. Solana (SOL)
YTD(%): 150.57
Price is currently moving within a range (19.7-26.75). 56% upside movement can be expected if price breaks above the range with 38.95 level acting as resistance.
If price breaks below the range 14.9 level will act as support.
4. Polkadot (DOT)
YTD(%): 68.71
Price is currently trading near support (7.13 level). 10% upside movement can be expected with resistance at 8.06.
Bearish RSI divergence has formed. If price breaks 7.133 support with high volume, we can expect it to find support at 6.02.
Note: Studies are for educational purposes only.
We will not be responsible for any kind of your Profits & Losses.

DOT/USDT Price SignalPolkadot Best Features Trade
Long Setup Lev 10x - 20x
buy 5.8$ To exit Target 6.6$


DOT forming Cup&Handle upward moveBINANCE:DOTUSDTPERP
possible move to upwards movement
long at the handle breakout
FOLLOW FOR MORE
FROM: 𝕄🌚🌚ℕ𝕋𝔸ℕ𝔾 ℂ𝕃𝔸ℕ™️
