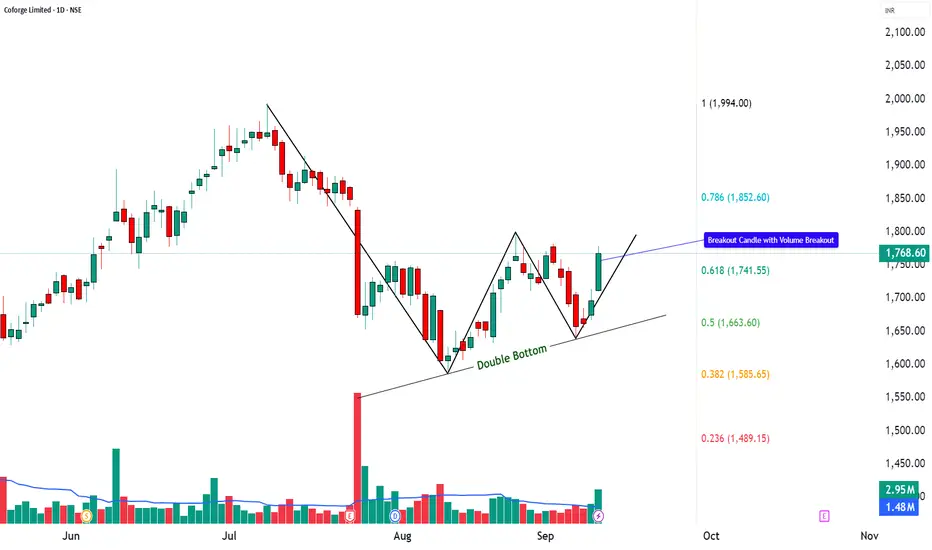
Coforge | Double Bottom Reversal with RSI + MACD Breakout📌 Coforge Ltd. – Closing Price: ₹1,768.60
📊 Technical Indicators Explained
Coforge is showing strong technical signals. A Double Bottom pattern 📉➡️📈 suggests a possible bullish reversal, while a strong bullish candle 🔥 confirms momentum. The RSI breakout ⚡, MACD crossover 📊, and volume surge 🚀 all indicate growing trader participation. With supports holding firm and resistances nearby, the stock is entering a decisive zone.
________________________________________
📈 Bullish Case – Why the stock could go up
Double Bottom signals potential trend reversal.
Strong bullish candle with volume validates buying interest.
RSI breakout + MACD crossover = bullish confirmation.
Fibonacci retracement levels open upside zones towards ₹1,852 – ₹1,994+.
📉 Bearish Case – Potential downside risks
If price fails to sustain above ₹1,726, weakness may return.
Broader market corrections could weigh on momentum.
A breakdown below ₹1,657 would weaken the bullish outlook.
⚡ Momentum Case – Short-term Trading Edge
Strong bullish candle + RSI breakout = near-term strength.
Sustaining above ₹1,780–₹1,800 could push towards higher Fibonacci levels.
Heavy volume indicates short-term traders are active.
📊 Support & Resistance Levels
Support Zones: ₹1,657 | ₹1,683.67 | ₹1,726.13
Resistance Zones: ₹1,794.93 | ₹1,821.27 | ₹1,863.73
📅 Short-term vs. Long-term Perspective
Short-term: Stock may test resistance levels between ₹1,795 – ₹1,860 if momentum sustains.
Long-term: Formation of a double bottom indicates potential for a structural trend reversal if higher levels hold.
✅ Conclusion: Coforge is showing a technical reversal pattern with strong momentum signals.
👉 The stock is at a key breakout zone — short-term traders may track resistances closely, while long-term investors can monitor the double bottom for confirmation of sustained trend change.
⚠️ Disclaimer – Please Read Carefully
The information shared here is meant purely for learning and awareness. It is not a buy or sell recommendation and should not be taken as investment advice. I am not a SEBI-registered investment advisor, and all views expressed are based on personal study, chart patterns, and publicly available market data.
Trading — whether in stocks or options — carries risk. Markets can move unexpectedly, and losses can sometimes exceed the money you have invested. Past performance or past setups do not guarantee future results.
If you are a beginner, treat this as a guide to understand how the market works — practice on paper trades before risking real money. If you are experienced, always assess your own risk, position sizing, and strategy suitability before entering trades.
Consult a SEBI-registered financial advisor before making any real trading decision. By engaging with this content, you acknowledge full responsibility for your trades and investments.
💬 Found this useful?
🔼 Give this post a Boost to help more traders discover clean, structured learning.
✍️ Drop your thoughts, questions, or setups in the comments — let’s grow together!
🔁 Share with fellow traders and beginners to spread awareness.
👉 “If you liked this breakdown, follow for more clean, structured setups with discipline at the core.”
🚀 Stay Calm. Stay Clean. Trade With Patience.
Trade Smart | Learn Zones | Be Self-Reliant 📊
Double Bottom
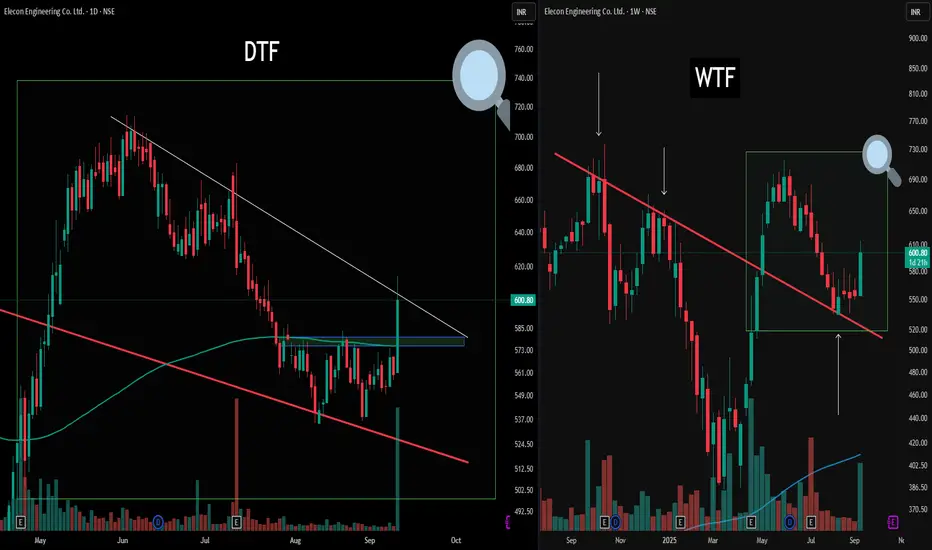
Unlocking Structure: Multi-Timeframe Mapping Today’s chart highlights the value of multi-timeframe analysis for structured observation.
On the right (WTF), the weekly perspective provides a broad structure, showcasing a clean counter trendline and its reaction zone. A green box and magnifier zoom into this region, framing the context for the daily (DTF) chart on the left.
On the DTF view, the same zone is explored in detail. Here, there's an active counter trendline (white) and a pronounced double bottom formation resting on a blue Flip zone—noted for educational reference rather than outcome prediction. Both timeframes display how structural overlaps and retests can be identified, serving as useful pattern recognition and risk management.
Disclaimer: Trading involves significant risk and is not suitable for all investors. Past performance does not guarantee future results. Always conduct your own research, consider seeking advice from a qualified financial advisor, and trade only with capital you can afford to lose.
SBI Card | Double Bottom Breakout | Bullish BiasSBI Card is showing signs of strength on the daily timeframe, completing a double bottom pattern, a classic bullish reversal setup. The stock is expected to close positively today around ₹830, confirming breakout intentions.
🔹 RSI is hovering near 60, indicating rising bullish momentum without being overbought.
🔹 The 20 EMA is sloping upward, reinforcing the short-term bullish trend.
🔹 Watch for resistance near ₹880, which coincides with a falling window gap — a likely profit-booking and supply zone.
📌 Key Levels:
Breakout above ₹830 can trigger momentum towards ₹880.
₹880 remains a crucial level to watch for follow-through or rejection.
🔔 Keep an eye on volume confirmation to validate the breakout.

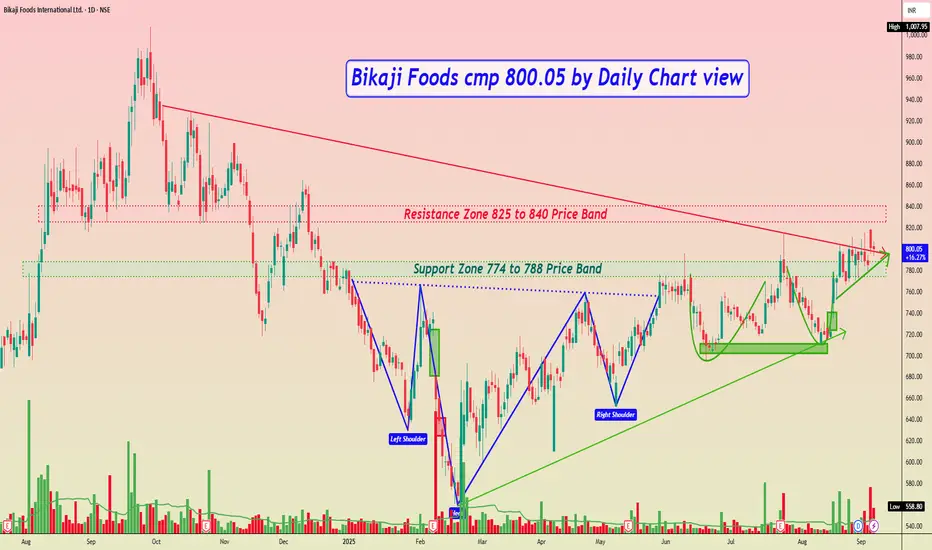
Bikaji Foods cmp 800.05 by Daily Chart viewBikaji Foods cmp 800.05 by Daily Chart view
- Support Zone 774 to 788 Price Band
- Resistance Zone 825 to 840 Price Band
- Pretty closely considerate Bullish Double Bottom formed
- Support Zone seems like going thru testing retesting mode
- Falling Resistance Trendline Breakout seems been attempted
- Price momentum seem respecting the Rising Support Trendlines
- Bullish Rounding Bottoms with Head & Shoulders below Support Zone
- Price Breakout will sustain after closure above Resistance Zone for few days
Multi-Confirmation Price Action: Fibonacci Zones, Base BreakoutsExplore multi-confirmation techniques using Fibonacci retracement to identify high-probability base breakout zones. Learn how to spot double bottom and inverted head & shoulders patterns at demand levels and execute confirmation trades for precision entries

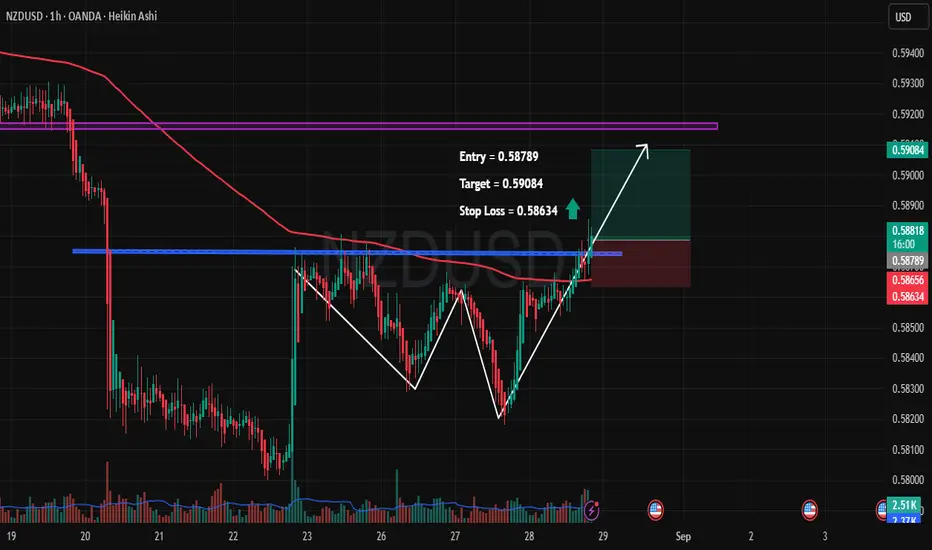
NZDUSD – Breakout Confirmation with Upside Potential🔹 Pair: NZDUSD (1H, Heikin Ashi)
🔹 Entry: 0.58789
🔹 Target: 0.59084 🎯
🔹 Stop Loss: 0.58634 🛑
🔑 Trade Rationale:
✅ Double Bottom Formation – Price respected key support twice, signaling potential reversal.
✅ Breakout Above Resistance – Clean breakout above horizontal resistance (blue line).
✅ 200 EMA Retest – Price is now pushing above the EMA, adding strength to the bullish case.
✅ Volume Spike – Recent surge in buying volume supports the upside move.
📊 Trade Plan:
I’m going long from 0.58789, looking for a quick move toward 0.59084. Risk is limited with a tight SL at 0.58634.
This setup offers a favorable R:R with a technical confluence of breakout + pattern confirmation.
⚠️ Disclaimer: This is not financial advice. Trade at your own risk. Always use proper risk management.
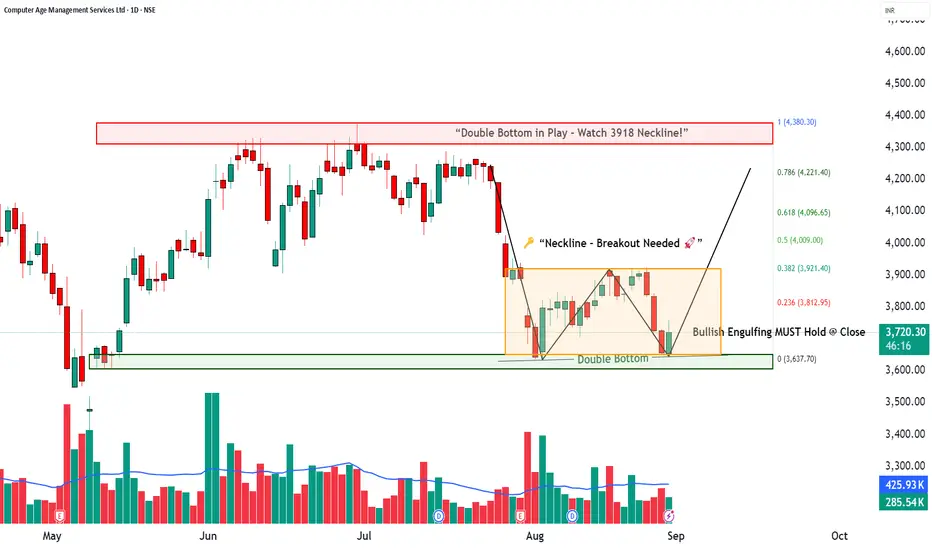
CAMS | Reversal in Sight? How to Trade a Double Bottom📈 CAMS | How to Trade a Double Bottom
Stock: Computer Age Management Services Ltd (CAMS)
Timeframe: Daily
Pattern: Possible Double Bottom (bullish reversal structure)
________________________________________
🔹 Pattern Identification
Bottom-1: 3632.40
Bottom-2: 3645
Neckline (Breakout Point): 3918
Candle Confirmation: Bullish Engulfing/Piercing on the second bottom
Volume: Improving on bounce, needs stronger confirmation on breakout
________________________________________
📘 Regular Trading Strategy (Conservative)
The Double Bottom is confirmed only when price closes above the neckline with strong volume.
Entry: Go long on close > 3918 preferred with volume ≥ 1.5–2× 20-DMA
Measured Height: 3918 − 3632 = 286 pts
Targets:
🎯 4094 (62% move)
🎯 4204 (full measured move)
🎯 4380 (161.8% Fibonacci extension)
Stoploss: Below 3630 (pattern invalidation)
Invalidation: Daily close below the bottoms
________________________________________
🔹 Alternative Entries
1️⃣ Retest Entry (Safer):
After breakout >3918, buy the pullback to neckline (3918–3925) if reversal candle appears.
SL below retest low.
2️⃣ Early Entry (Aggressive):
Trigger already seen at 3758.90 (bullish engulfing/piercing).
SL below 3668.
Add position if 3918 breakout confirms.
________________________________________
📊 Key Levels
Supports: 3668 | 3599 | 3554
Resistances: 3783 | 3827 | 3895
Fibonacci Zones: 3821 (23.6%) | 3921 (38.2%) | 4009 (50%) | 4096 (61.8%) | 4221(78.6%) | 4380 (100%)
________________________________________
💡 Trading View
CAMS is forming a potential Double Bottom reversal near major support.
Early signs of buying are visible at 3758.9, but real confirmation will come only above 3918 neckline.
Breakout with strong volume can open upside towards 4094 → 4204 → 4380.
📌 Bias: Bullish above 3750; stronger confirmation only on breakout above 3918.
📌 Risk: Invalidation below 3630.
👉 The Bullish Engulfing/Piercing candle at the second bottom MUST hold at daily close for the setup to remain valid.
⚠️ Disclaimer – Please Read Carefully
The information shared here is meant purely for learning and awareness. It is not a buy or sell recommendation and should not be taken as investment advice. I am not a SEBI-registered investment advisor, and all views expressed are based on personal study, chart patterns, and publicly available market data.
Trading — whether in stocks or options — carries risk. Markets can move unexpectedly, and losses can sometimes exceed the money you have invested. Past performance or past setups do not guarantee future results.
If you are a beginner, treat this as a guide to understand how the market works — practice on paper trades before risking real money. If you are experienced, always assess your own risk, position sizing, and strategy suitability before entering trades.
Consult a SEBI-registered financial advisor before making any real trading decision. By engaging with this content, you acknowledge full responsibility for your trades and investments.
💬 Found this useful?
🔼 Give this post a Boost to help more traders discover clean, structured learning.
✍️ Drop your thoughts, questions, or setups in the comments — let’s grow together!
🔁 Share with fellow traders and beginners to spread awareness.
👉 “If you liked this breakdown, follow for more clean, structured setups with discipline at the core.”
🚀 Stay Calm. Stay Clean. Trade With Patience.
Trade Smart | Learn Zones | Be Self-Reliant 📊
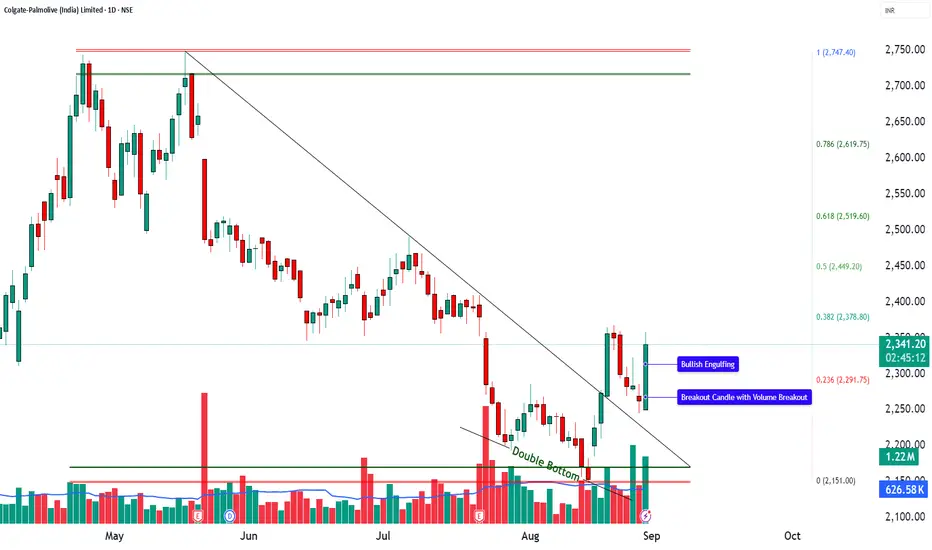
COLPAL | Double Bottom Retest + Volume Breakout🚀 COLPAL | Double Bottom Retest + Volume Breakout
📌 Pattern Setup:
🔹 Double Bottom retest spotted
🔹 Bullish Engulfing candle at support
🔹 Breakout candle with strong volume surge
📊 Technical Snapshot:
RSI: 58 → Healthy momentum
MACD: Bullish crossover
CCI: 107 → Strong positive bias
Stochastic: 89 → Overbought but strong
Volume: 1.22M vs 626k avg → ⚡ Breakout confirmed
🛠 Levels to Watch:
🔼 Long Entry: Above 2357.9
🔽 Stoploss: Below 2243
🎯 Targets: 2472 | 2587
📉 Pullback Buy Zone: 2291–2273
❌ Invalidation: Below 2207
⚡ Resistance Levels: 2382 | 2424 | 2490
⚡ Support Levels: 2274 | 2208 | 2167
🎯 Fibonacci Zones: 2378 → 2449 → 2519 → 2619 → 2747
💡 View:
COLPAL is breaking out from a Double Bottom Retest with strong volume & bullish signals. Sustaining above 2358 could open the gates towards 2472 – 2587 in the short term.
👉 Bias: Bullish till 2207 holds.
⚠️ Disclaimer – Please Read Carefully
The information shared here is meant purely for learning and awareness. It is not a buy or sell recommendation and should not be taken as investment advice. I am not a SEBI-registered investment advisor, and all views expressed are based on personal study, chart patterns, and publicly available market data.
Trading — whether in stocks or options — carries risk. Markets can move unexpectedly, and losses can sometimes exceed the money you have invested. Past performance or past setups do not guarantee future results.
If you are a beginner, treat this as a guide to understand how the market works — practice on paper trades before risking real money. If you are experienced, always assess your own risk, position sizing, and strategy suitability before entering trades.
Consult a SEBI-registered financial advisor before making any real trading decision. By engaging with this content, you acknowledge full responsibility for your trades and investments.
💬 Found this useful?
🔼 Give this post a Boost to help more traders discover clean, structured learning.
✍️ Drop your thoughts, questions, or setups in the comments — let’s grow together!
🔁 Share with fellow traders and beginners to spread awareness.
👉 “If you liked this breakdown, follow for more clean, structured setups with discipline at the core.”
🚀 Stay Calm. Stay Clean. Trade With Patience.
Trade Smart | Learn Zones | Be Self-Reliant 📊
ECLERX SKYROCKETS 35%! This Pattern Signals ₹4,200 TargetNSE:ECLERX SKYROCKETS 35%, Made a Beautiful Chart Structure to Qualify for the Chart of the Week
Price Action:
- It experienced a powerful rally from ₹2,200 to ₹3,877 (all-time high) between July and October 2024
- Recent correction formed a descending wedge pattern from October 2024 to early May 2025
- Currently showing an explosive breakout at ₹3,301.80, up ₹852.40 (+34.80%) in this Week.
- Massive single-week gain with a long bullish candle breaking above both resistance levels and the downtrend line
- The weekly chart shows a strong V-shaped recovery from support
Volume Analysis:
- This Week's volume at 2.28M shares vs. average of 420.79K (over 5x normal volume)
- Previous support bounces have also witnessed above-average volume
- Extremely high volume on today's breakout suggests significant institutional participation
- Volume pattern confirms the legitimacy of the price action
Key Support and Resistance:
- Strong support zone at ₹2,200-2,300 (green horizontal box) - tested and held multiple times over the past year
- Previous resistance now likely support at ₹3,200-3,250 (green horizontal line)
- Next resistance at all-time high of ₹3,877 (marked as "High")
- Downtrend line (white diagonal) now broken with conviction
Technical Patterns:
1. Descending Wedge Breakout- Classic bullish reversal pattern completed this week
2. Double Bottom*- Formed at ₹2,300 level in March-May 2025
3. Support Retest- Successfully retested the major support zone before the breakout
4. V-Shaped Recovery - Strong reversal indicating powerful buying interest
Trade Setup:
- Pattern: Descending wedge breakout with volume confirmation
- Confirmation: Explosive price action and volume expansion
- Context: Bullish reversal after testing major support zone
Entry Points:
1. Aggressive Entry: Current price (₹3,301.80) with partial position
2. Pullback Entry: On retest of breakout level ₹2,900-3,000
3. Confirmation Entry: On consolidation and holding above ₹3,200 for 2-3 sessions
Exit Strategy:
- Target 1: ₹3,600 (psychological resistance)
- Target 2: ₹3,877 (previous all-time high)
- Target 3: ₹4,200 (pattern projection based on measured move)
- Trailing Stop: 7% trailing stop after Target 1 is achieved
Stop Loss Placement:
- Aggressive Stop: ₹2,950 (below recent swing low)
- Conservative Stop: ₹2,800 (near the breakout point of the wedge)
- Pattern-Based Stop: ₹2,500 (invalidation level for the pattern)
Risk Management:
- Position sizing: Limit risk to 1-2% of trading capital
- Risk-reward ratio: Minimum 1:1.5 for aggressive entry, 1:2 for pullback entry
- Consider scaling approach:
* Enter 50% position now
* Add 25% on confirmation of trend (holding above ₹3,200)
* Add 25% on pullback (if it occurs)
- Take partial profits: 30% at Target 1, 30% at Target 2, hold remainder with trailing stop
NSE:ECLERX shows a powerful technical setup with its powerful breakout from a descending wedge pattern on record volume. The price action respects key technical levels, with the stock holding major support at ₹2,200-2,300 before staging today's massive rally. The breakout above both the wedge pattern and horizontal resistance, with 5x normal volume, suggests potential for continued upside momentum toward previous highs and beyond.
Keep in the Watchlist.
NO RECO. For Buy/Sell.
📌Thank you for exploring my idea! I hope you found it valuable.
🙏FOLLOW for more
👍BOOST if you found it useful.
✍️COMMENT below with your views.
Meanwhile, check out my other stock ideas on the right side until this trade is activated. I would love your feedback.
Disclaimer: "I am not a SEBI REGISTERED RESEARCH ANALYST AND INVESTMENT ADVISER."
This analysis is intended solely for informational and educational purposes and should not be interpreted as financial advice. It is advisable to consult a qualified financial advisor or conduct thorough research before making investment decisions.

OPTIEMUS Price ActionOptiemus Infracom Limited (OPTIEMUS) is currently trading around ₹608 as of August 2025. The stock has shown a strong recent performance, gaining approximately 4% in the latest trading sessions, with daily price ranges between ₹585 and ₹625.
Over the past year, the stock price has fluctuated substantially, with a 52-week low near ₹378 and a high nearing ₹874. The current price sits closer to the mid-to-upper end of this range, indicating a recovery from lows but still beneath recent highs.
Financially, Optiemus Infracom has an earnings per share (EPS) of about ₹7.58. The price-to-earnings (PE) ratio stands elevated, above 80, which highlights strong market expectations for future growth or reflects a premium valuation often seen in technology or telecom-related firms.
The price trades above its 50-day average (~₹609) and 200-day average (~₹595), indicating a positive medium-term trend. Volume levels are moderate, consistent with stable investor interest.
While the stock has seen volatility, the trajectory suggests a gradual uptrend supported by its core business segments in electronics and telecommunications infrastructure. Key support is seen around ₹580, while resistance near ₹630 could test the strength of the ongoing rally.
In summary, Optiemus Infracom is positioned in an upward trading range with strong growth expectations, but valuation is relatively high, which should be monitored alongside company earnings and sector dynamics for future moves.

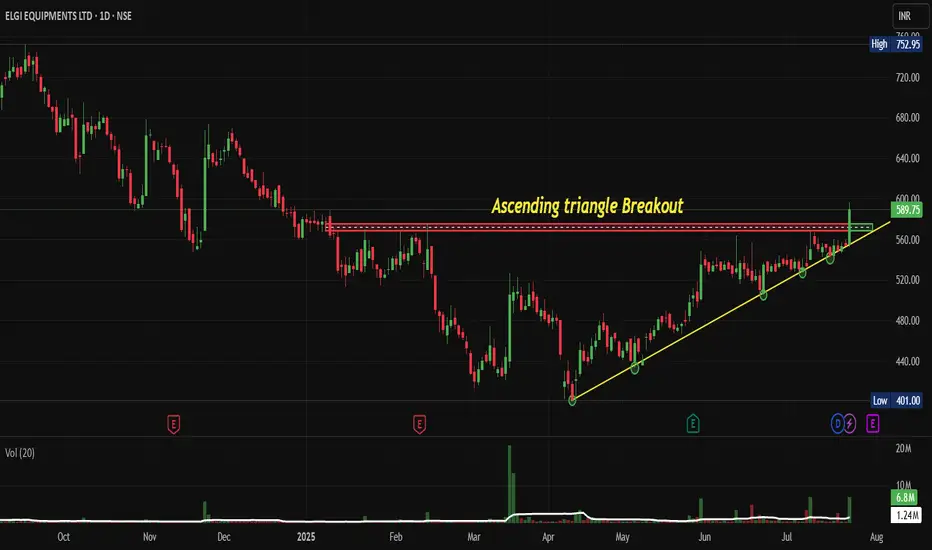
ELGIEQUIP: Breaks Out of its Ascending Triangle PatternNSE:ELGIEQUIP Breaks Out of its Ascending Triangle Pattern: This Industrial Giant Could Be Your Next Multi-Bagger as Manufacturing Boom Accelerates
Price Action:
- Current Price: ₹589.75 (as of chart date)
- 52-Week High: ₹752.95
- 52-Week Low: ₹401.00
- Daily Change: +₹35.95 (+6.41%)
- Market Cap: ₹18,703 Cr.
Volume Spread Analysis:
Volume Profile Assessment:
- Breakout Volume: 6.8M shares (significantly above average)
- Volume Trend: Increasing volume during breakout phase
- Volume-Price Relationship: Positive correlation during an uptrend
- Distribution vs Accumulation: Clear accumulation pattern visible
Volume Indicators:
- 20-day Average Volume: 1.24M shares
- Breakout Volume Confirmation: Yes (above average volume)
- Volume Concentration: Higher volumes at support levels indicate buying interest
My Key Technical Observations:
- Stock has successfully broken out from a major ascending triangle pattern
- Strong volume confirmation on the breakout day
- Price action showing momentum acceleration after months of consolidation
- Clear trend reversal from the March 2025 lows
Pattern Recognition and Structure Analysis:
Primary Pattern: Ascending Triangle Breakout
- Formation Period: Jan 2025 to July 2025 (7 months)
- Resistance Level: ₹570-580 (horizontal resistance)
- Support Trendline: Rising from ₹401 lows in March 2025
- Breakout Confirmation: Volume spike accompanying price breakout
- Pattern Target: ₹680-700 (measuring the height of the triangle base)
Secondary Patterns:
- Double Bottom formation at ₹401 levels (March 2025)
- Flag and pennant consolidations during the uptrend
- Higher highs and higher lows structure since March 2025
Key Support and Resistance:
Key Resistance Levels:
- Immediate Resistance: ₹600-610 (psychological level)
- Major Resistance: ₹650-680 (pattern target zone)
- 52 Week High Resistance: ₹750-755 (previous swing high)
Key Support Levels:
- Immediate Support: ₹560-570 (breakout level, now support)
- Strong Support: ₹520-530 (previous consolidation zone)
- Major Support: ₹480-490 (ascending trendline support)
- Critical Support: ₹440-450 (50% retracement of current move)
Base Formation Analysis:
- Primary Base: ₹480-580 consolidation zone (7 months)
- Base Characteristics: Tight consolidation with reduced volatility
- Base Quality: High-quality base with multiple retests of support/resistance
- Accumulation Evidence: Consistent volume during the consolidation phase
Trade Setup and Entry Strategy:
Primary Trade Setup - Momentum Play:
- Entry Strategy: Buy on pullback to ₹570-575 (breakout retest)
- Alternative Entry: Current levels for aggressive traders
- Entry Rationale: Ascending triangle breakout with volume confirmation
Secondary Trade Setup - Swing Trade:
- Entry Strategy: Accumulate on dips to the ₹520-530 zone
- Entry Rationale: Strong support zone with multiple bounce history
- Time Horizon: 3-6 months
Entry Levels and Execution:
Aggressive Entry (Short-term):
- Entry Price: ₹585-590 (current market price)
- Quantity: 30% of planned position
- Rationale: Momentum continuation play
Conservative Entry (Medium-term):
- Entry Price: ₹570-575 (breakout retest)
- Quantity: 50% of the planned position
- Rationale: Better risk-reward ratio
Value Entry (Long-term):
- Entry Price: ₹520-530 (support zone)
- Quantity: 70% of planned position
- Rationale: High probability support zone
Exit Levels and Profit Targets:
Short-term Targets (1-3 months):
- Target 1: ₹620-630 (5-7% upside from current levels)
- Target 2: ₹650-660 (10-12% upside)
- Target 3: ₹680-690 (pattern target)
Medium-term Targets (3-12 months):
- Target 1: ₹700-720 (psychological resistance)
- Target 2: ₹750-760 (52 Week high retest)
- Target 3: ₹800-820 (extension target)
Exit Strategy:
- Partial Profit Taking: 25% at each target level
- Trailing Stop: Implement after reaching the first target
- Final Exit: Technical breakdown below key support
Stop-Loss Strategy:
Initial Stop-Loss Levels:
- Aggressive Traders: ₹555 (5% below entry)
- Conservative Traders: ₹530 (below support zone)
- Long-term Investors: ₹480 (below ascending trendline)
Stop-Loss Management:
- Initial Risk: 5-10% of entry price
- Trailing Strategy: Move stop-loss to breakeven after 5% profit
- Progressive Tightening: Reduce stop distance as price advances
Position Sizing and Risk Management:
Position Sizing Framework:
- Conservative Approach: 2-3% of portfolio
- Moderate Approach: 3-5% of portfolio
- Aggressive Approach: 5-7% of portfolio
Risk Management Rules:
- Maximum Risk per Trade: 2% of total capital
- Risk-Reward Ratio: Minimum 1:2 for all trades
- Portfolio Concentration: Maximum 10% in a single stock
- Sector Exposure: Maximum 20% in the capital goods sector
Capital Allocation Strategy:
- 30% on initial breakout entry
- 40% on pullback to support
- 30% reserved for additional weakness
Sectoral Backdrop:
Capital Goods Sector Overview:
- Sector Performance: Outperforming broader markets in 2025
- Government Support: PLI schemes boosting manufacturing
- Infrastructure Push: Continued focus on industrial development
- Export Opportunities: Growing global demand for Indian machinery
Industrial Compressor Market Dynamics:
- Market Size: India air compressor market valued at $1.09 billion (2023)
- Growth Projection: Expected to reach $1.64 billion by 2030
- CAGR: 5.4% growth from 2024 to 2030
- Volume Growth: From 64,000 units (2023) to 120,000 units (2030)
Manufacturing Sector Tailwinds:
- Target Achievement: Manufacturing sector expected to reach $1 trillion by 2025
- Industrial Growth: Rapid expansion in the automotive and electronics sectors
- Policy Support: Make in India and PLI schemes driving demand
- Infrastructure Development: Continued capex cycle supporting industrial equipment demand
Fundamental Backdrop:
Company Overview:
- Business: Leading manufacturer of air compressors and pneumatic tools
- Market Position: Strong presence in the industrial compressor segment
- Product Range: Oil-lubricated piston compressors, reciprocating compressors
- Employee Strength: 2,172 employees
Financial Highlights:
- Market Capitalization: ₹ 18,703 Cr.
- EPS (TTM): ₹11.05
- Book Value per Share: ₹58.90
- Price to Book Ratio: 10
- Dividend Yield: 0.37%
Recent Performance:
- Q4 FY25 Revenue: ₹ 993 crore
- Q4 FY25 Net Profit: ₹102.00 crore
- Annual Revenue (FY25): ₹3,510 crore
- Annual Net Profit (FY25): ₹350 crore
Earnings Outlook:
- Next Earnings Report: July 30, 2025 (Expected)
- Annual General Meeting: August 12, 2025 (Expected)
- Dividend Declared: ₹2.20 per share for FY25
- Management Assessment: Economic quality in terms of earnings and margins
Risk Factors and Considerations:
Technical Risks:
- False Breakout Risk: Potential failure to sustain above resistance
- Market Correlation: High correlation with broader market movements
- Sector Rotation: Risk of funds moving away from capital goods
- Volume Sustainability: Need for continued volume support
Fundamental Risks:
- Economic Slowdown: Impact on industrial capex cycles
- Competition Intensity: Pressure from domestic and international players
- Raw Material Costs: Inflation in steel and component prices
- Export Dependency: Global economic uncertainty affecting demand
Market Risks:
- Interest Rate Sensitivity: Impact of monetary policy changes
- Currency Fluctuation: Export revenue exposure to forex volatility
- Regulatory Changes: Potential policy modifications affecting industry
- Liquidity Risk: Lower institutional participation during market stress
My Take:
NSE:ELGIEQUIP presents a compelling technical setup with its successful breakout from a 7-month ascending triangle pattern. The combination of strong volume confirmation, favourable sectoral tailwinds, and robust fundamental positioning makes it an attractive investment opportunity. The stock is well-positioned to benefit from India's manufacturing sector growth and the expanding industrial compressor market.
The risk-reward profile appears favourable for both short-term momentum traders and long-term investors, with multiple entry strategies catering to different risk appetites. However, proper position sizing and disciplined stop-loss management remain crucial for the successful execution of this trade setup.
Keep in the Watchlist and DOYR.
NO RECO. For Buy/Sell.
📌Thank you for exploring my idea! I hope you found it valuable.
🙏FOLLOW for more
👍BOOST if you found it useful.
✍️COMMENT below with your views.
Meanwhile, check out my other stock ideas on the right side until this trade is activated. I would love your feedback.
Disclaimer: "I am not a SEBI REGISTERED RESEARCH ANALYST AND INVESTMENT ADVISER."
This analysis is intended solely for informational and educational purposes and should not be interpreted as financial advice. It is advisable to consult a qualified financial advisor or conduct thorough research before making investment decisions.
NZD/USD Technical Analysis 🧠 NZD/USD Technical Analysis | Smart Money Perspective
Currently, the NZD/USD pair is trading around 0.5960, positioned between a well-defined resistance zone (0.6130–0.6150) and a support zone (0.5890–0.5900).
Here are the key technical aspects to note:
🔹 1. Liquidity Sweep
The price recently dipped below the previous swing low near 0.5900, tapping into a pool of sell-side liquidity. This move is typically seen as a liquidity grab, where institutional players push the price to trigger retail stop losses before reversing direction.
🔹 2. Double Bottom Formation
The chart suggests a potential double bottom forming at the support level — a classic sign of accumulation. This pattern indicates buyers may be coming in after liquidity has been cleared, expecting a reversal.
🔹 3. Fair Value Gap (FVG)
A Fair Value Gap, or imbalance, is visible between 0.5985 and 0.6015. This gap was created due to a sharp bearish move, leaving price action unbalanced. The price is now likely to retrace into this area to rebalance orders, which is typical smart money behaviour.
🔹 4. Market Structure Outlook
If the double bottom confirms with a bullish break of structure above 0.5980, we could see a continuation towards:
- First Target: FVG zone around 0.6015
- Second Target: Major resistance near 0.6150, where past distribution occurred
✅ Conclusion
This setup integrates key smart money concepts:
- Liquidity grab below support
- Accumulation phase at demand
- FVG as a target
- Potential bullish shift in market structure
Traders should keep a close watch on price action around the support zone for confirmation, such as a bullish engulfing candle or a break of recent short-term highs, before taking long positions. Targets remain at the FVG and resistance zones; however, sound risk management is crucial in case of a deeper sweep or any macroeconomic developments.

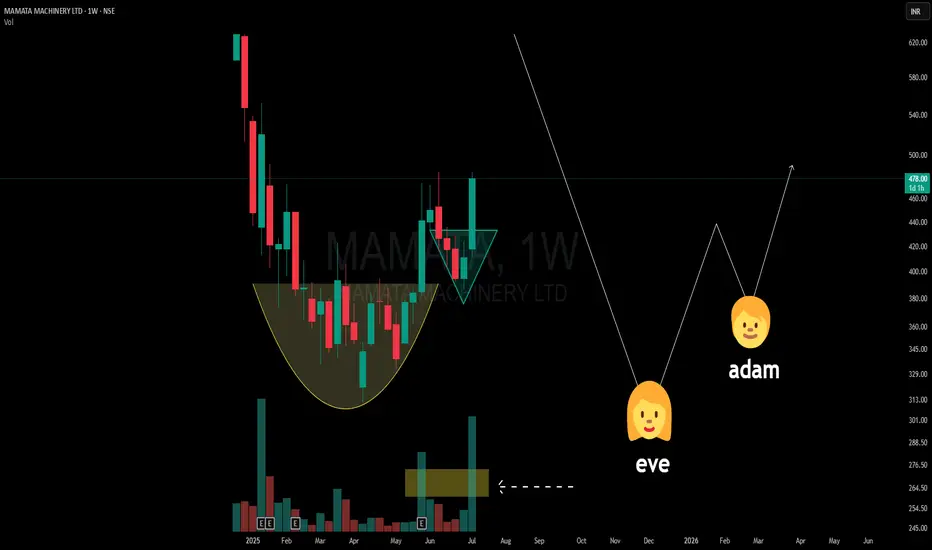
Eve-Adam Pattern Forming? A Rare Double Bottom Pattern Explained📉 Pattern Study (Not a Buy/Sell Tip/Not Forecasting anything)
On the weekly chart of Mamata Machinery Ltd, we’re potentially witnessing a classic yet uncommon pattern — the Eve-Adam Double Bottom.
🔍 What is the Eve-Adam pattern?
🧑🦰 Eve Bottom: Broad, rounded, and forms slowly with increased volume — showing gradual accumulation.
👦 Adam Bottom: Sharp, V-shaped recovery with relatively lower volume — a quick retest signaling renewed demand.
📈 What makes this setup notable?
-A clear Eve structure formed over several weeks.
-Volume started rising visibly into the breakout, especially during the right-side thrust.
-A possible Adam leg is being projected based on the symmetry of the pattern.
🟡 Additionally, a rounding base / cup-like structure preceded this, which may act as a broader accumulation phase.
🔄 This isn’t a forecast or trade call. It’s simply a chart observation intended for pattern study and educational analysis.
📚 Patterns like these are rare — but when supported by volume confirmation, they deserve attention from a learning standpoint.
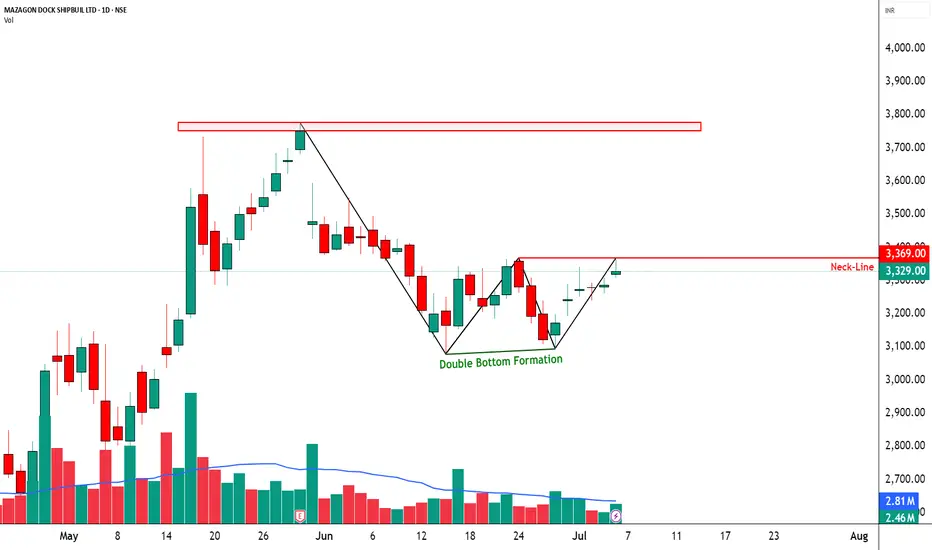
MAZDOCK – TECHNICAL ANALYSIS - W PATTERN________________________________________________________________________________
📈 MAZDOCK – TECHNICAL ANALYSIS
📆 Date: July 4, 2025 | ⏱ Timeframe: Daily Chart
🔍 Educational Breakdown – For Learning & Study Use Only
________________________________________________________________________________
🔹 Price Action Zones
• 🔴 Top Range: 3775
• Resistance: 3362 – 3396 – 3423
• 🟢 Bottom Range: 3077.7
• Support: 3241 – 3274 – 3301
________________________________________________________________________________
🔹 Chart Pattern: ✅ W-Bottom Formation
A clean W-shaped reversal pattern is forming. Price is respecting demand zones and gradually forming higher lows. Neckline lies around 3369 — breakout above this may fuel further upside.
________________________________________________________________________________
🔹 Reversal Candlestick Patterns:
⛔ No major reversal candle on 4th July 2025.
________________________________________________________________________________
🔹 Volume Footprint:
✅ Gradual volume pickup
🚨 Watch for breakout above 3362–3396 with volume >3.5M
🔼 A successful breakout may trigger a swift move toward 3425–3520.
________________________________________________________________________________
🔹 Trend Bias: ✅ Bullish
Short-term momentum favors the bulls with sectoral tailwinds from PSU + Defense themes.
________________________________________________________________________________
📌 What’s Catching Our Eye:
• W-Bottom Pattern nearing breakout
• Price reclaimed key demand zone and consolidating just below resistance
• PSU + Defense theme rally adds sector momentum
________________________________________________________________________________
👀 What We’re Watching For:
• Breakout Confirmation: Daily close above 3396 with 3.5M+ volume
• Pullback Re-entry: Ideal zone 3300–3310 for fresh entries
• Volume Spike: Key trigger for breakout validation
________________________________________________________________________________
⚠️ Risks to Watch:
• Low volume breakout = Bull trap risk
• Sector rotation or sudden weakness in PSU/Defense
• Breakdown below 3240 = pattern failure & shift in bias
________________________________________________________________________________
🔮 What to Expect Next:
• ⚡ Retest of 3362–3396 range likely
• 🔄 Minor consolidation / handle formation possible
• 🔄 Watch for volatility near resistance (intraday fakeouts)
________________________________________________________________________________
📊 Trade Plan (Based on Logic + Volume Confirmation)
🔼 Breakout Long Setup:
• Entry: Above 3369
• Stop Loss: 3300
• Risk–Reward: ~1:1 to 1:2
📌 Why:
• W-bottom breakout
• Sector strength + price structure alignment
• Volume >3.5M is the key trigger
________________________________________________________________________________
🔁 Pullback Long Setup:
• Entry Zone: 3305–3310
• Stop Loss: 3240 (Support 3)
• Risk–Reward: ~1:1 to 1:2
📌 Why:
• Tight SL near structure
• Good risk-reward for early entry
________________________________________________________________________________
🔽 Bearish Setup (Rejection from Resistance):
• Entry: Below 3300
• Stop Loss: Above 3365
• Risk–Reward: ~Flexible — as per individual trader's strategy and risk appetite
📌 Why:
• Rejection from neckline
• Low-volume breakout = trap
• Breakdown below support shifts structure to bearish
________________________________________________________________________________
❌ Invalidation Triggers:
• Daily Close below 3240
• Bearish Marubozu with volume = shift to supply pressure
________________________________________________________________________________
📌 Intraday Supply Zones Noted (15-Min Chart):
The 15-minute chart reveals the presence of multiple intraday supply zones, indicating short-term selling pressure.
🟥 Tested Supply Zone: 3337.30 – 3346.30 | SL: 3352.20
🟥 Strong Supply Zone: 3349.40 – 3358.60 | SL: 3364.50
These zones may act as resistance levels for intraday traders. Watch for price rejection or confirmation candles in these areas before planning any breakout trades.
________________________________________________________________________________
⚠️ Disclaimer:
This analysis is for educational purposes only.
STWP is not a SEBI-registered advisor.
No buy/sell recommendations are made.
Please consult your financial advisor before trading.
STWP is not responsible for trading decisions based on this post.
________________________________________________________________________________
💬 Found this helpful?
Have you caught this W-pattern early?
Share your thoughts in the comments ⬇️
🔁 Spread the insight with fellow traders
✅ Follow STWP for smart technical setups backed by volume and price action
🚀 Let’s trade with patience, logic, and clarity!
Be Self-Reliant | Trade with Patience | Learn with Logic
________________________________________________________________________________
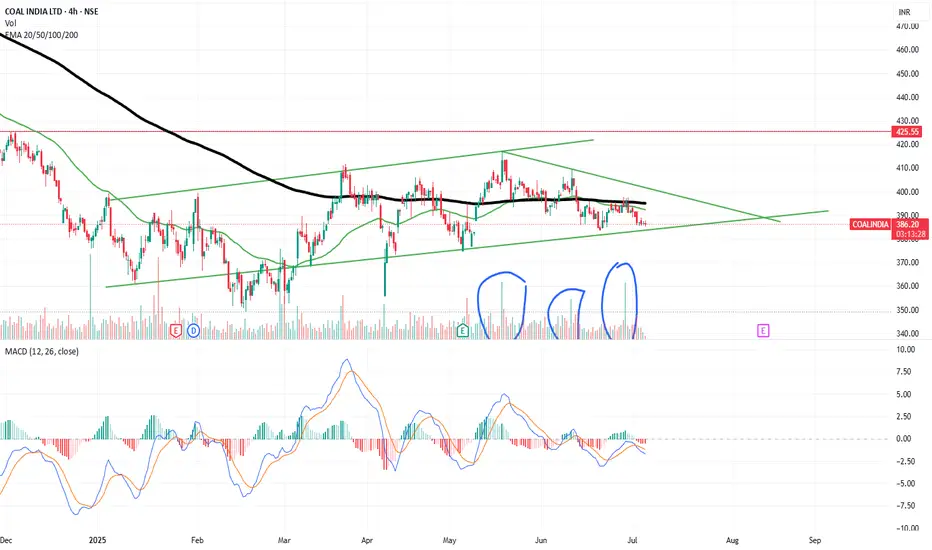
Coal India | Double bottom | W chart patternWhat your study says about this stock.?
comment it here. and share your thought.
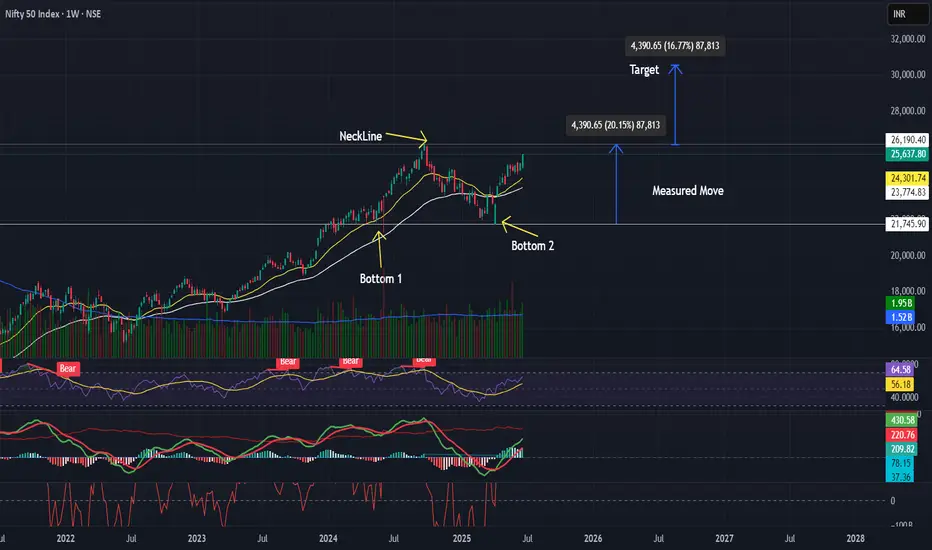
NIFTY Weekly Chart – Double Bottom Breakout Analysis📌 NIFTY Weekly Chart – Double Bottom Breakout Analysis
After a long corrective phase, NIFTY is forming a classic Double Bottom pattern on the weekly timeframe. This is typically a bullish reversal signal.
✅ Pattern: Double Bottom on Weekly Chart
✅ Bottom Levels: ~21,800
✅ Neckline Resistance: ~26,200
📈 Breakout Strategy:
Watch for a weekly close above 26,200 with higher volume to confirm breakout strength.
✅ Measured Move Target: ~30,600
Calculation: Neckline + (Neckline – Bottom) ≈ 26,200 + (4,400)
✅ Stop-loss Options:
ATR-based stop: ~25,530
Chart-based conservative stop: ~24,500
🔎 Bias: Bullish above 26,200 with confirmed weekly close and volume expansion.
📌 Volume Note: Look for rising volume near the neckline to validate the breakout.
This setup aligns with strong macro drivers such as India’s economic resilience and sector rotation into large caps.
Edelweiss - Double Bottom Reversal PatternNSE:EDELWEISS Made Beautiful Chart Structure today Before Q4 Results with Good Price and Volume action.
Today's Price Action:
- The stock has been in a clear downtrend since December 2024, forming a descending resistance line (white trendline)
- Recently broke above this major downtrend line with strong momentum
- Current price at ₹86.44, up 5.50 points (+6.80%) in today's session
- The stock appears to have formed a Double bottom Pattern around the ₹75 levels, confirming a potential reversal
Volume Analysis:
- Volume spike visible in today's session (13.85M shares traded)
- The previous volume averaged around 5.6M shares
- This high-volume breakout suggests strong buying conviction
- Volume confirms the price movement, adding credibility to the breakout
Key Supports and Resistances:
- Strong resistance zone at ₹87-90 (previous consolidation area marked by red horizontal line)
- Key support established at ₹75-77 (green horizontal line)
- Previous support at ₹86-87 may now act as resistance that needs to be cleared decisively
Trade Setup:
Entry Points:
1. Aggressive Entry: Current level (₹86.44) with partial position size
2. Conservative Entry: On breakout confirmation above ₹90 with closing price
3. Pullback Entry: If price retraces to the ₹82-83 range (previous breakout level)
Exit Strategy:
- Target 1: ₹95 (first resistance level)
- Target 2: ₹105 (previous support turned resistance)
- Target 3: ₹115-120 (major resistance zone from January-February 2025)
- Trailing Stop: Consider implementing a 5% trailing stop after achieving Target 1
Stop Loss Placement:
- Aggressive Stop: Below today's low (approximately ₹82)
- Conservative Stop: Below the green support line at ₹75
- Double Bottom Pattern-Based Stop: Below ₹73
Risk Management:
- Position sizing: Limit to 1-2% risk of total capital per trade
- Risk-reward ratio: Minimum 1:1 for aggressive entry, 1:1.5 for conservative entry
- Consider scaling out of position at each target level (e.g., 33% at each target)
The improved price action comes after several months of decline, with the potential Double Bottom pattern suggesting a possible trend reversal if completed successfully.
Keep in the Watchlist.
NO RECO. For Buy/Sell.
📌Thank you for exploring my idea! I hope you found it valuable.
🙏FLLOW for more
👍BOOST if useful
✍️COMMENT below with your views.
Meanwhile, check out my other stock ideas on the right side until this trade is activated. I would love your feedback.
Disclaimer: "I am not SEBI REGISTERED RESEARCH ANALYST AND INVESTMENT ADVISER."
This analysis is intended solely for informational and educational purposes and should not be interpreted as financial advice. It is advisable to consult a qualified financial advisor or conduct thorough research before making investment decisions.

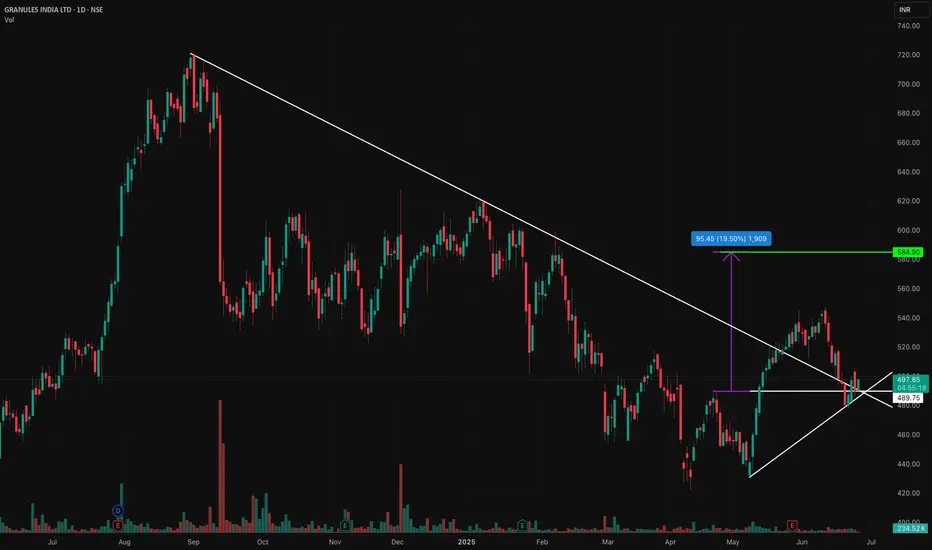
Granules - Double Bottom Breakout Double Bottom Breakout and Retest Done
Buy @ 495-497
SL 475
Target - 585
Resistance Trendline Breakout as well !!
Dhani BO: Ready for Its Next Rally After 80% Correction?NSE:DHANI Breakout: Is This Med/Fin Tech Stock Ready for Its Next Rally After 80% Correction?
Price Action Overview:
- Stock has undergone a significant correction from highs of ₹109.88 to lows of ₹47.05, representing nearly a 57% decline
- Currently trading at ₹71.09 with recent bullish momentum showing +14.42% gains
- Price action suggests a potential bottoming process after prolonged consolidation
Volume Spread Analysis:
- Significant volume spikes observed during major price movements
- Recent breakout accompanied by above-average volume (4.22M vs average 30.03M)
- Volume concentration during earnings announcements (marked 'E' on the chart) indicates institutional participation
- Higher volume during recent uptick suggests renewed interest
Key Technical Levels:
Support Levels:
- Primary Support: ₹50-52 zone (previous consolidation area)
- Secondary Support: ₹47.05 (absolute low)
- Immediate Support: ₹62-65 (recent breakout zone)
Resistance Levels:
- Immediate Resistance: ₹82.71 (marked horizontal level)
- Major Resistance: ₹96.79-₹109.88 (previous highs zone)
- Intermediate Resistance: ₹75-78 (previous resistance turned support)
Base Formation:
- Extended consolidation base formed between ₹50-₹68 over 4-5 months
- Classic rectangle/range-bound pattern with multiple tests of support and resistance
- Recent breakout from the upper boundary of this base suggests the completion of the accumulation phase.
Technical Patterns:
- Descending triangle pattern from February to April 2025
- Internal Flag & Pole Breakout
- Recent breakout from the consolidation rectangle
- Potential inverse head and shoulders formation on smaller timeframes
- Rising volume during breakout confirms pattern validity
Trade Setup:
Entry Strategy:
- Primary Entry: ₹68-₹70 (on pullback to breakout level)
- Aggressive Entry: Current levels ₹71-₹72 (momentum play)
- Conservative Entry: ₹65-₹67 (retest of breakout zone)
Exit Levels:
- Target 1: ₹82-₹85 (immediate resistance zone) - Risk: Reward 1:2
- Target 2: ₹95-₹98 (major resistance area) - Risk: Reward 1:3.5
- Target 3: ₹110-₹115 (previous highs extension) - Risk: Reward 1:4.5
Stop Loss:
- Conservative Stop: ₹62 (below recent consolidation)
- Aggressive Stop: ₹58 (below key support cluster)
- Trailing Stop: Implement an 8-10% trailing stop after the first target achievement
Position Sizing:
- Risk per trade: Maximum 2% of portfolio
- Position size calculation: Portfolio value × 2% ÷ (Entry price - Stop loss)
- For ₹1,00,000 portfolio with ₹70 entry and ₹62 stop: Position size = ₹2,000 ÷ ₹8 = 250 shares
Risk Management:
- Maximum exposure to single stock: 5% of total portfolio
- Sector exposure limit: 15% to financial services
- Use of stop-loss orders mandatory
- Position review after every 10% move in either direction
- Risk-reward ratio minimum 1:2 for all trades
Sectoral Backdrop:
Fintech Sector Overview:
- Digital lending sector experiencing regulatory scrutiny, but long-term growth prospects intact
- Increasing digital adoption post-pandemic, supporting fintech growth
- RBI guidelines on digital lending create compliance costs but also barriers to entry
- Consolidation is expected in the sector, favouring established players
Industry Trends:
- Growing smartphone penetration is driving digital financial services adoption
- The government push for financial inclusion through digital means
- Rising interest rates are impacting borrowing costs but improving net interest margins
- Increasing focus on data analytics and AI-driven lending decisions
Fundamental Backdrop:
Company Overview:
- Dhani Services operates in the digital financial services space
- Diversified business model including lending, insurance, and investment services
- Strong technology platform enabling scalable operations
- Focus on serving underbanked population segments
Recent Developments:
- Quarterly earnings showing revenue growth trajectory
- Management focuses on improving asset quality and reducing NPAs
- Strategic partnerships for expanding product offerings
- Regulatory compliance improvements undertaken
Financial Health Indicators:
- Need to monitor debt-to-equity ratios given the lending business nature
- Asset quality metrics are crucial for long-term sustainability
- Revenue diversification, reducing dependence on single income streams
- Technology investments supporting operational efficiency
Catalyst Factors:
- Potential regulatory clarity on digital lending norms
- Expansion of credit underwriting capabilities
- Strategic alliances or acquisition opportunities
- Improved economic conditions support loan demand
Risk Factors:
- Regulatory changes in the fintech space
- Competition from established banks entering the digital space
- Credit risk in unsecured lending segments
- Technology and cybersecurity risks
- Dependence on external funding for growth capital
My Take:
This technical setup suggests a potential medium-term opportunity with proper risk management, though investors should monitor both technical levels and fundamental developments closely.
Keep in the Watchlist.
NO RECO. For Buy/Sell.
📌Thank you for exploring my idea! I hope you found it valuable.
🙏FOLLOW for more
👍BOOST if you found it useful.
✍️COMMENT below with your views.
Meanwhile, check out my other stock ideas on the right side until this trade is activated. I would love your feedback.
Disclaimer: "I am not a SEBI REGISTERED RESEARCH ANALYST AND INVESTMENT ADVISER."
This analysis is intended solely for informational and educational purposes and should not be interpreted as financial advice. It is advisable to consult a qualified financial advisor or conduct thorough research before making investment decisions.

Crude may bounce up to 5522 level.Crude oil is on bounce, As per chart Crude is showing divergence with morning start. It is at demand zone and add more if come down to 4900 level. It may test minimum 5522 level soon.

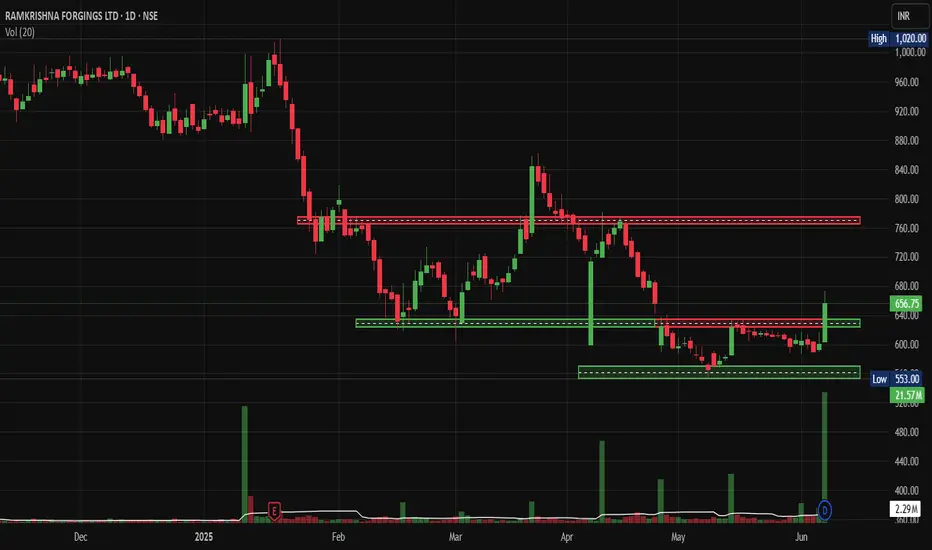
RKF Massive Breakout After 6-Month Consolidation.NSE:RKFORGE Hidden Auto Component Gem Ready for Massive Breakout After 6-Month Consolidation, after Breaking out Today With King Candle and Volumes.
Price Action:
- Current Price: ₹656.75 (+9.37% gain)
- Trading Range: ₹553.00 - ₹1,020.00
- Market Cap Category: Mid-cap stock with decent liquidity
- Chart Pattern: Extended consolidation phase with recent breakout attempt
Support and Resistance Levels
- Primary Resistance: ₹760-780 zone (red horizontal line)
- Secondary Resistance: ₹1,020 (previous high)
- Immediate Support: ₹620-640 zone
- Major Support: ₹553-580 zone (green horizontal rectangle)
- Critical Support: ₹553 (52-week low)
Base Formation:
- Base Type: Rectangle/Sideways consolidation base
- Duration: Approximately 6 months (January 2025 to June 2025)
- Base Depth: ~45% correction from highs
- Base Quality: Tight consolidation with reduced volatility
- Breakout Characteristics: Recent volume spike suggests potential base completion
Technical Patterns:
- Rectangle Pattern: Clear horizontal support and resistance boundaries
- Volume Accumulation: Declining volume during consolidation, spike on recent move
- Flag Formation: Potential bull flag pattern forming at current levels
- Double Bottom: Possible formation around ₹553-580 support zone
Volume Spread Analysis
- Volume Characteristics: 21.57M shares traded (above average)
- Volume Pattern: Higher volume on up days, lower on down days
- *Accumulation Signs: Volume spike coinciding with price breakout attempt
- Volume Confirmation: Recent breakout supported by increased participation
Trade Setup:
Entry Strategy:
- Primary Entry: ₹650-665 (current levels on pullback)
- Aggressive Entry: ₹680-690 (on breakout above resistance)
- Conservative Entry: ₹620-630 (on retest of support)
Exit Levels:
- Target 1: ₹750-760 (15% upside)
- Target 2: ₹850-880 (30% upside)
- Target 3: ₹980-1,000 (50% upside)
Stop Loss Levels:
- Tight Stop: ₹620 (5% risk)
- Swing Stop: ₹580 (12% risk)
- Position Stop: ₹550 (16% risk)
Position Sizing:
- Conservative Allocation: 2-3% of portfolio
- Moderate Allocation: 4-5% of portfolio
- Aggressive Allocation: 6-8% of portfolio (for risk-tolerant investors)
Risk Management:
- Risk-Reward Ratio: Minimum 1:2 for all entries
- Portfolio Risk: Maximum 2% portfolio risk per position
- Position Monitoring: Weekly review of technical levels
- Profit Booking: 25% at Target 1, 50% at Target 2, remainder at Target 3
Sectoral Backdrop:
Auto Components Sector Overview
- Sector Performance: Recovery phase post-COVID disruptions
- Growth Drivers: EV transition, export opportunities, aftermarket demand
- Challenges: Raw material inflation, supply chain disruptions
- Government Support: PLI schemes, Make in India initiatives
Forging Industry Dynamics
- Market Position: Specialised manufacturing with high entry barriers
- Demand Drivers: Commercial vehicle recovery, export growth
- Competitive Advantage: Technical expertise, established client relationships
- Cyclical Nature: Linked to auto industry cycles and capex spending
Fundamental Backdrop
Company Overview
- Business Model: Automotive forging components manufacturer
- Key Clients: Major OEMs in domestic and international markets
- Product Portfolio: Crankshafts, connecting rods, front axle beams
- Manufacturing Facilities: Multiple locations with modern equipment
Financial Health Indicators
- Revenue Growth: Recovery trajectory expected post-consolidation
- Margin Profile: Improving operational efficiency
- Debt Levels: Manageable debt-to-equity ratios
- Cash Flow: Positive operating cash flow generation
Growth Catalysts
- Export Expansion: Increasing share in global supply chains
- Product Diversification: Entry into new automotive segments
- Technology Upgrades: Investment in advanced manufacturing
- Market Recovery: Commercial vehicle segment revival
Risk Factors
- Cyclical Demand: Vulnerability to auto industry downturns
- Raw Material Costs: Steel price volatility impact
- Competition: Pressure from low-cost manufacturers
- Regulatory Changes: Environmental and safety compliance costs
My Take:
NSE:RKFORGE presents a compelling technical setup after a prolonged consolidation phase. The stock appears to be breaking out from a well-defined base with strong volume support. The risk-reward profile is attractive for medium-term investors, with clear support and resistance levels providing good trade management opportunities. However, investors should remain mindful of the cyclical nature of the auto components sector and size positions accordingly.
Keep in the Watchlist.
NO RECO. For Buy/Sell.
📌Thank you for exploring my idea! I hope you found it valuable.
🙏FOLLOW for more
👍BOOST if you found it useful.
✍️COMMENT below with your views.
Meanwhile, check out my other stock ideas on the right side until this trade is activated. I would love your feedback.
Disclaimer: "I am not a SEBI REGISTERED RESEARCH ANALYST AND INVESTMENT ADVISER."
This analysis is intended solely for informational and educational purposes and should not be interpreted as financial advice. It is advisable to consult a qualified financial advisor or conduct thorough research before making investment decisions.
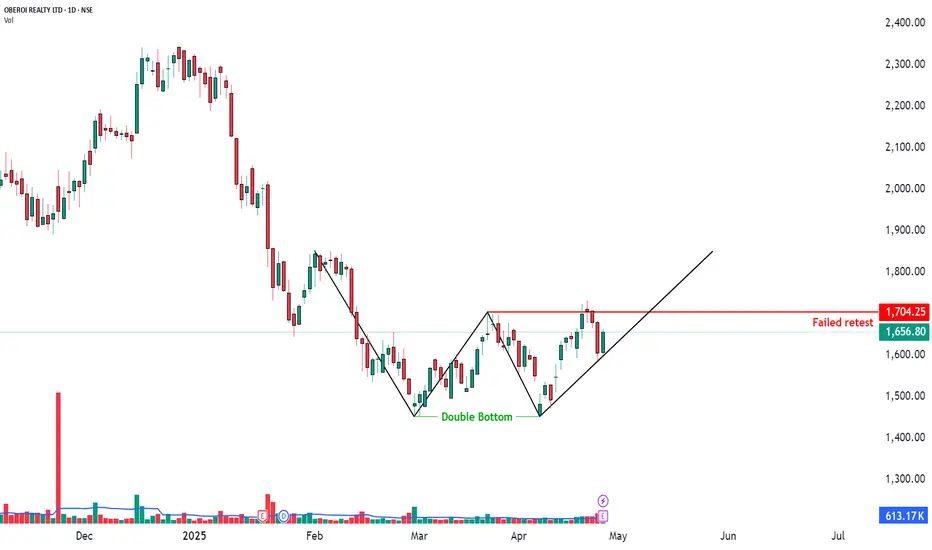
Double Bottom but Failed Breakout Retest | Daily Time Frame📉 OBEROI REALTY LTD – Double Bottom but Failed Breakout Retest
📅 Date: April 28, 2025
📈 Timeframe: Daily Chart
🔍 Stock: Oberoi Realty Ltd (NSE)
📌 Technical Overview:
A Double Bottom pattern was formed indicating bullish reversal potential.
Price attempted a breakout above the neckline near ₹1704.25, but the retest failed — price could not sustain above the breakout zone.
Price is currently trading at ₹1656.80, under the trendline support.
🧩 Key Observations:
✅ Double bottom structure was confirmed.
❌ Breakout retest failed — caution needed.
📉 Watch trendline support (black line) closely — breakdown could trigger weakness.
📊 Volume during the failure was moderate (not aggressive selling yet).
🧠 Observational Bias:
Weak below the trendline support.
Bulls must reclaim and hold above ₹1704.25 to regain strength.
Bharat Dynamics Ltd (BDL)🚀 BDL - Technical Breakout in Play!
Weekly breakout above key resistance zone 🔥
Pattern: Double Bottom ➕ Break of Monthly Mother Candle High
Potential Upside:
🎯 Target 1: ₹1968.50
🎯 Target 2: ₹2590.00
