Double Bottom

BATA INDIA with Double BottomBata India formed double bottom pattern between its 100 EMA and 200 EMA, we can long here with stoploss below 1819 for a target of 2025.
It may face resistance near 1920 and 1960,
Once it touches 1960, we should trail stoploss to 1919
and after touching 2000, we should trail our stoploss to 1960..

EICHER MOTORS LONGDaily chart of Eicher motors shows double resistance breakout plus double bottom formation
Auto Sector shows breakout too
Overall market seems strong till 17620 levels atleast
Can enter @2570 after a healthy retest with target around 2743
Main strict SL @2546 closing basis as there is chip shortage going on in auto sector.
FOLLOW FOR MORE IDEA
LIKE AND COMMENT WHAT YOU THINK ABOUT THIS...

CHZ target of 0.65chzusdt have a dobule bottom on weekly chart. It should reverse from first week of january. Its a buy now!
I have a target of 0.65

ELECON ENGINEERINGEducational idea
Elecon looking good for target of 220
buying range-180-190
sl-165

Solana towards ATH again!Solana has made a double bottom around $155. Solana has also taken support from its long term trendline and has moved up. It is right now moving towards its current all-time high and will break it very soon. It will be more bullish after it close on or above 185-190 range.

MUTHOOTFIN - Double Bottom, Morning Star, 200EMA support The analysis is done on daily TF hence price may take few days to few weeks in order to reach the targets.
Trade setup is explained in image itself.
The above analysis is purely for educational purpose. Traders must do their own study & follow risk management before entering into any trade
Checkout my other ideas to understand how one can earn from stock markets with simple trade setups. Feel Free to comment below this or connect with me for any query or suggestion regarding this stock or Price Action Analysis.

IOTEX SHOWING DOUBLE BOTTOM BUY SIGNFRIENDS IOTEX take a long same support and making double bottom pattarn this is good sign of buy and take some good profit in your portfoliyo but always remamber SL is very must and the risk reward ratio is 1:2 and as you much and take risk is your own anlaysis thank you and god bless you

LTI - already broke the ascending triangle - where will it go?LTI _FSP
LTI has already broken the ascending triangle and the W formation is also in completion. will the price give a break out or will the price will come back down again? what are your thoughts?
let me know in comments

Tata Elexi - double bottom formationTata Elexi is now moving in the same formation for quite sometime it has to cross the marked entry point for a good uptrend movement.
It has been giving closing in red 4 times in a week. Once it crosses and closes above the entry point it will be an uptrend

Berger Paint - Double Bottom PatternBerger Paint - Double Bottom Pattern.
Retracement of Fibonacci 50% level is 768.
One Should buy @770.

Nifty - Emerging with Double Bottom Chart PatternHello Everyone,
Let's have a look at the technical chart of Nifty, can you see a double bottom formation on Nifty Charts? Do you think Nifty reversal started form here?
Yes I hope it is perfect double bottom chart pattern and the break out point of double bottom comes at 17470 & we can expect Nifty to reach at 18140 levels and further more.
The contents updated here are only for Educational Purpose.

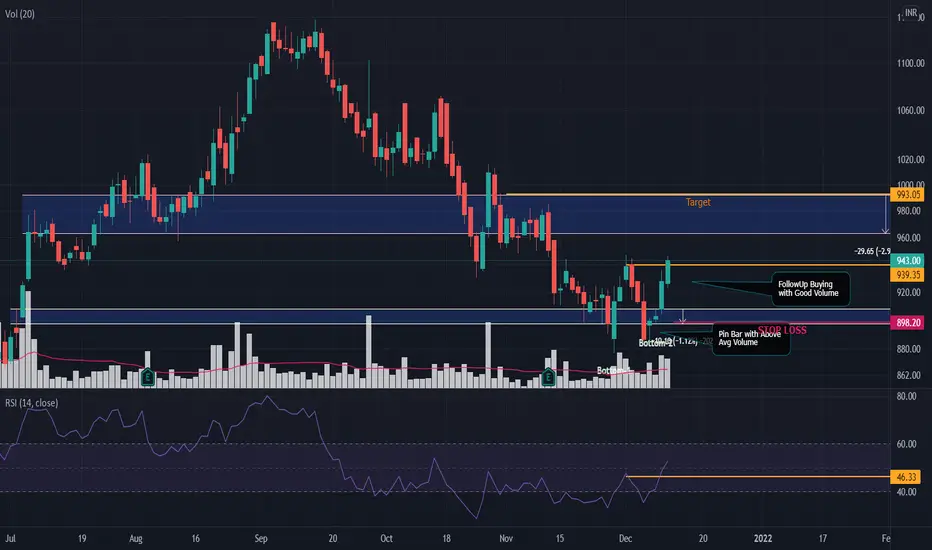
GODREJCP - Double Bottom SetupDouble Bottom Setup , Pin Bar and Followup buying seen. Good time to Enter
HIKAL - Double Bottom SetupDouble Bottom Setup with Rising Volume, Fundamentals are strong and closing above breakeven can take it higher

Short term Analysis for Nifty PharmaNifty Pharma shows Double bottom in the daily time frame. Just to double confirm, even RSI is showing positive divergence. The chart is indicating a medium term bullish. SunPharma being the dragger, you can go through the chart of sunpharma. Also, suggest any good stock in pharma if you have any.


Adani Ports And Special Economic Zone LimitedDouble bottom reversal pattern in Adani Ports And Special Economic Zone Limited

Schneider Electric Infrastructure LtdDouble bottom reversal in Schneider Electric Infrastructure Limited form support line. Also there is bullish MACD crossover

Mindtree (Hourly) - Double Bottom Chart Pattern Mindtree (Hourly)- Double Bottom Chart Pattern
Current market price - 4653
Target - 4893
Bollinger band is challenged on the upper end
RSI is above 60
Stochastic 14,3,3 is in positive crossover
ADX is above 15 and +DI is above -DI in Directional Movement Index
On the daily tide, all indicators / oscillators are positive too
MACD of the daily tide is uptick
Elliott wave count
Price is in 3rd wave in hourly timeframe
Price is in 5th wave in daily timeframe

RIIL - Double Bottom with Rising VolumeRIIL has made a Double Bottom Pattern + Weekly Congestion + Monthly Rising Volume, Closing above Breakeven is a trigger point to Buy and Hold for 1:1 Reward

BLS | W Pattern / Double bottom - Potential for 25%BLS | W Pattern / Double bottom - Potential for 25%
CMP : 211
SL : 190
Target : 270
1:3+ risk reward setup
We traded this stock already and it has already doubled. Now taking small trade again.

DTF short term sellTrade based:
Weekly market reach the fib extension 1.
In day tf market form a DT and also market broken the DT. it indicates short term market in sell trend.
when market retest the braked support then we can go for sell

Possible W Pattern ?Double bottom support, Take off can be possible from here to achieve Target 1 at neck line and Target 2 at ATH.
