WIPRO Available @ major support zone - Breakout of Double BottomThis can be a great position to add for investment as well with very low risk. IT stocks have already faced big downside and in longer term, the downside is limited but upside is huge.
The analysis is done on daily TF hence price may take few days to few weeks in order to reach the targets.
Trade setup is explained in image itself.
The above analysis is purely for educational purpose. Traders must do their own study & follow risk management before entering into any trade
Checkout my other ideas to understand how one can earn from stock markets with simple trade setups. Feel Free to comment below this or connect with me for any query or suggestion regarding this stock or Price Action Analysis.
Doublebottombreakout

[Positional] HAVELLS Double Bottom BreakoutHavells has formed a nice double bottom.Today it has come out of Double bottom pattern also it has broken the resistance zone- so higher levels are expected going forward.
The length of bottom is quite high - and it exceeds the ATH of HAVELLS if projected upwards - so our R:R will be low in this case.
Entry - 1348-1350
Target - 1486
SL - 1200
Though R:R is very low - Probability of profit is high.

Double Bottom- Full ExplanationA Double Bottom is considered a bullish signal, indicating a possible reversal of the current downtrend to a new uptrend. Sometimes called an "W" formation because of the pattern it creates on the chart, the Double Bottom is one of the most frequently seen and common of the patterns.
The Double Bottom is a reversal pattern of an downtrend trend in a financial instrument's price. The Double Bottom marks an downtrend in the process of becoming a uptrend.
A Double Bottom consists of two well-defined, sharp bottoms at approximately the same price level. The two bottoms are distinct and sharp . The pattern is complete when prices rise above the highest high in the formation. The highest high is called the "confirmation point".
The bullish momentum may be evidenced through a higher bottom on an oscillator like RSI . Though not required, the market may break below the first low, even if briefly. A slight and temporary break below the first bottom is preferred as it may excite the bears only to reverse and trend higher. The neckline is formed between the price low of the valley between the two bottoms. A break above this neckline will confirm the double bottom pattern. The bullish confirmation is specified by a break in the key price resistance level (neckline) situated at the high point between the ‘bottoms’.
Important Characteristics
Following are important characteristics for a Double Top .
Downtrend Preceding Double Top
The Double Bottom is a reversal formation. It begins with prices in an downtrend. The trend downwards should be fairly long and healthy.
Time between Bottoms
Generally, the longer the time between the two bottoms, the more important the pattern is as a good reversal signal.
Volume
Volume tends to be heaviest during the first bottom and lighter on the second. It is common to see volume pick up again at the time of breakout.
Pullback after Breakout
A pullback after the breakout is usual for a Double Bottom. The higher the volume on the breakout, the higher the likelihood is for a pullback.
Two Peaks at Different Levels
Sometimes the two comprising a Double Bottom are not at exactly the same price level. This does not necessarily render the pattern invalid.
Trading with Double Top:
There are certain rules when trading with Double Bottom chart patterns.
Firstly one should see the market phase whether it is up or down. As the double bottom is formed at the end of a downtrend , the prior trend should be an downtrend.
Traders should spot if two rounding bottoms are forming and also note the size of the bottoms.
Traders should only enter the long position when the price break out from the resistance level or the neckline.
Example:
From the below example of the 15 Min chart of BANKNIFTY we can see how bullish reversal takes places after the formation of the double bottom
Stop Loss & Target :
In the case of a Double Bottom chart pattern, the stop loss should be placed at the second bottom of the pattern and can be trailed at the pullback low as price moves higher but this will be a bit aggressive.
The price target should be equal to the distance between the neckline and the bottoms.
The False Break: How to trade the Double Bottom Pattern and profit from “trapped” traders
Now…
When you trade the Double Bottom, you must pay attention to the time and space between the lows — the larger the “gap”, the better.
Why?
Because when the lows are far apart, it gets the attention of more traders who could push the price higher.
And with this concept, you can use it to profit from “trapped” traders.
Here’s how…
The first and second lows should have time and space between them
Let the price break below the first low
Wait for a rejection of lower prices and then go long
The idea is simple.
As the price breaks below the first low, bearish traders will short the markets and have their stops above the lows.
But if the price quickly reverses higher, the short traders are “trapped”.
And you can take advantage of it by going long, anticipating if the price moves higher, it’ll trigger their stops and push the market in your favor.
Hope you all learnt from this post. Share with the community if you liked it.
Regards
Omahto

#niftyauto breakout confirmation Nifty auto index is showing. A firm confirmation of breakout from the previous resistance and also from a double bottom W pattern.
The last weekly candle is wide range bullish open = low pattern. The momentum and trend is bullish on all timeframes.
From the fundamental side covid recovery and festive sales could help stocks in the sector to sustain the bullishness in the short term.

Double Bottom Formation Breakout - Keep AccumulatingRallis India belongs to the Industry of Agro Chemicals/Pesticides.
The Stock has formed double Double Bottom on Charts and there is a clear breakout with excellent volume. The stock from a technical standpoint is comfortably placed above its key moving averages, around 13% and 17% from 50DMA and 200DMA.
The Company is fundamentally sound with a reasonable debt to equity of 2% which signals a healthy Balance Sheet. Rakesh Jhujhunwala holds a stake of 9.93% in the Company.
Keep Accumulating at these levels with positional to long term mindset for targets of 400-450
Feel free to share your feedback and queries

H breakout in Monthly & weekly charts1. Strong weekly/ multi year breakout with good volume.
2. Also double bottom breakout in monthly chart
Target 1 is all time high
Target 2 is height of double bottom pattern

Supreme Industries - Range Breakout- Fundamentally strong company
- Breakout from a consolidated range showing a double bottom pattern
- Buying pressure indicated by the long lower wicks
- Breakout is supported by volumes, however it seems there is huge selling at 2130-2170 range but the net price change on the day is still +ve
- Don't chase the stock as it might correct a bit and a good entry can be near 2130-2100 levels
- Good for short term as well as medium term trading
- Once 2200 level is crossed there might nice momentum

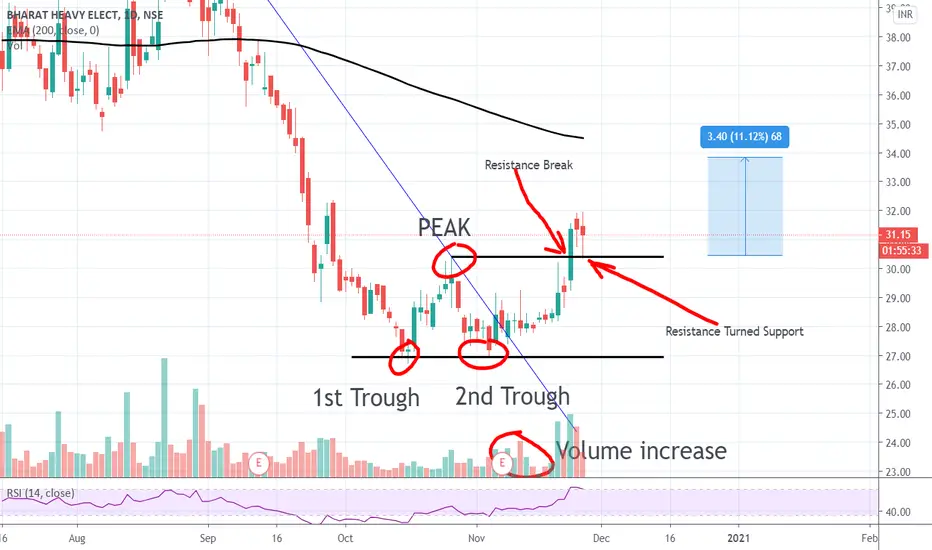
BHEL long | Double bottom pattern | TRG 33.6/-Perfect Double bottom pattern
BHEL NEWS for receiving orders
TECHNICALLY STRONG Bullish
Fundamentally Supported